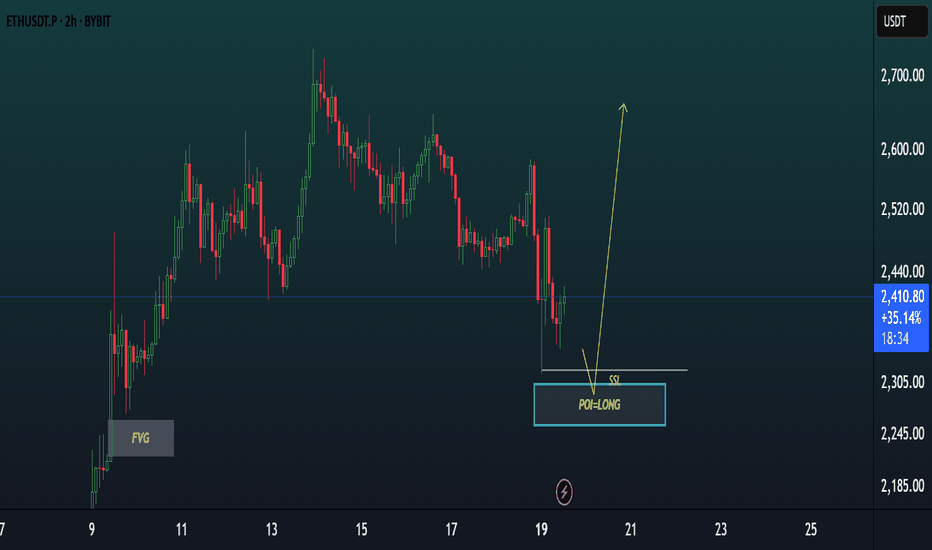
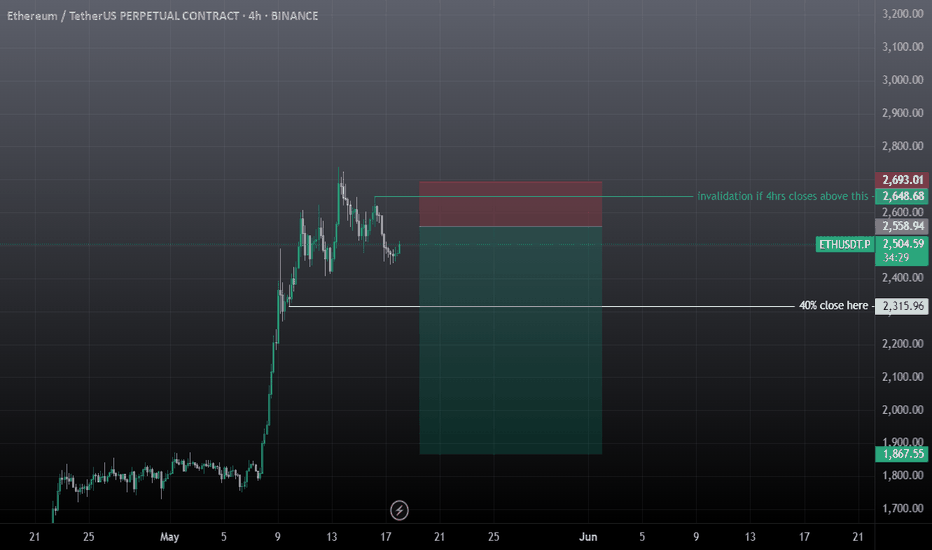
1D ETH/USDT Range Chart ProjectionWhile the SQZ indicator develops its negative slope, the price, with high probability, will be encapsulated within a side with purchases (accumulation) or bullish entries at prices of $2,323 dollars and taking profits at prices of $2,738, as in the larger chart, 1S, we have the development of a bullish movement, purchases or bullish entries are prioritized, in favor of the developing trend.
ETHUSDT.3S trade ideas
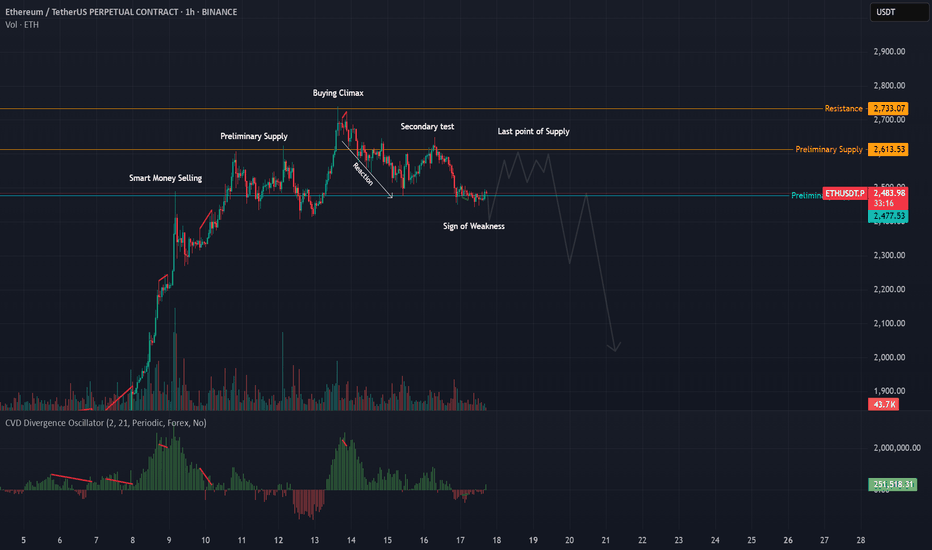
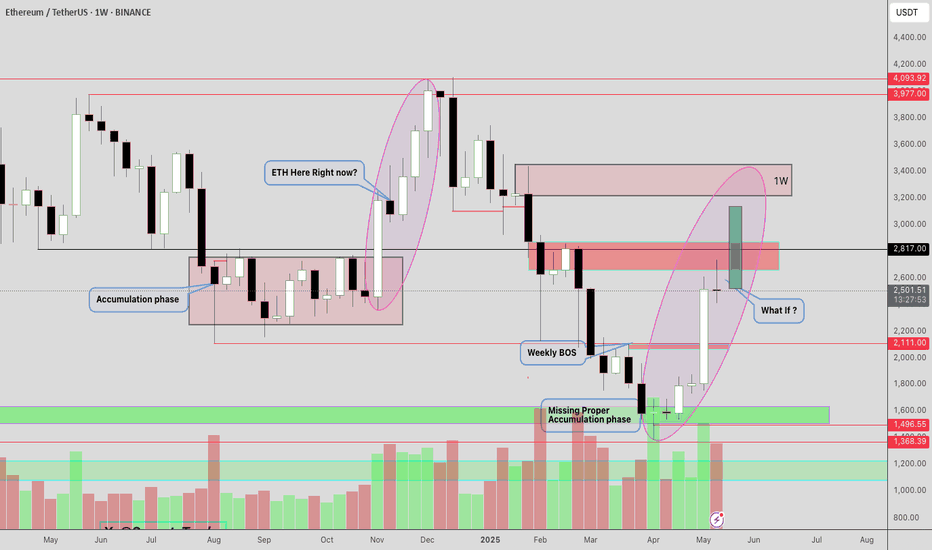
ETH Distribution Playing Out After Clean Accumulation Target HitThis is a follow-up to my last ETH idea, where I called for accumulation and a breakout from the falling wedge — price hit the exact target I mapped out, and since then, the behavior has shifted.
We are now seeing the classic signs of distribution forming. It began with smart money stepping in selling into strength, which led into preliminary supply . That was followed by a strong climatic volume push into a buying climax , the heavy volume came in right at the top, and since then, we’ve seen a reaction down, a weak bounce ( secondary test ), and now a potential sign of weakness.
The delta has been confirming the distribution as well. It showed bearish divergence at the buying climax , showing aggressive selling happening even as price pushed up. Now with this move down, we’re seeing increasing negative delta confirming supply is in control. Volume is also heavier on the drops, confirming distribution rather than re-accumulation.
After a sign of weakness like this, we usually get one more push up into a last point of supply — a weaker rally that gets sold into before the real markdown begins. Be aware of a possible trap move above the secondary test or buying climax , but the structure suggests the highs are likely in for now.
Whether this plays out clean or gets messy with one more fakeout, the context has seemd to shift. Smart money appears to be offloading, and delta continues to confirm it. Bias flips bearish until proven otherwise.
Overall, I believe the recent up move was a stop hunt and ETH has much more downside ahead.
ETH + ALTSEASON | NEW All Time Highs Soon ??This would have been the first time that BTC made a new ATH during a bullish cycle, but ETH didn't - are we too hasty?
Very interesting to compare the two side by side and see that ETH has much more to gain than BTC:
The BTC new ATH update can be found here:
______________________
BINANCE:BTCUSDT BINANCE:ETHUSDT
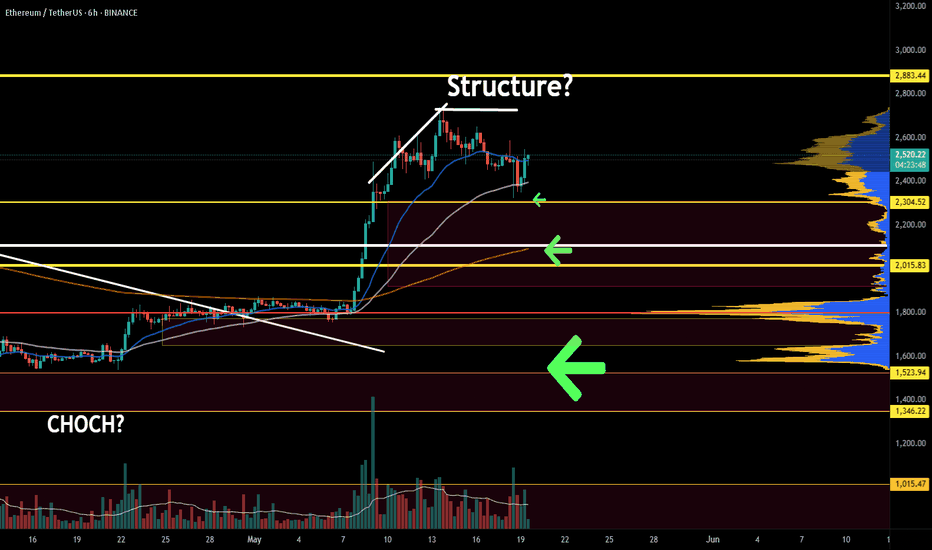
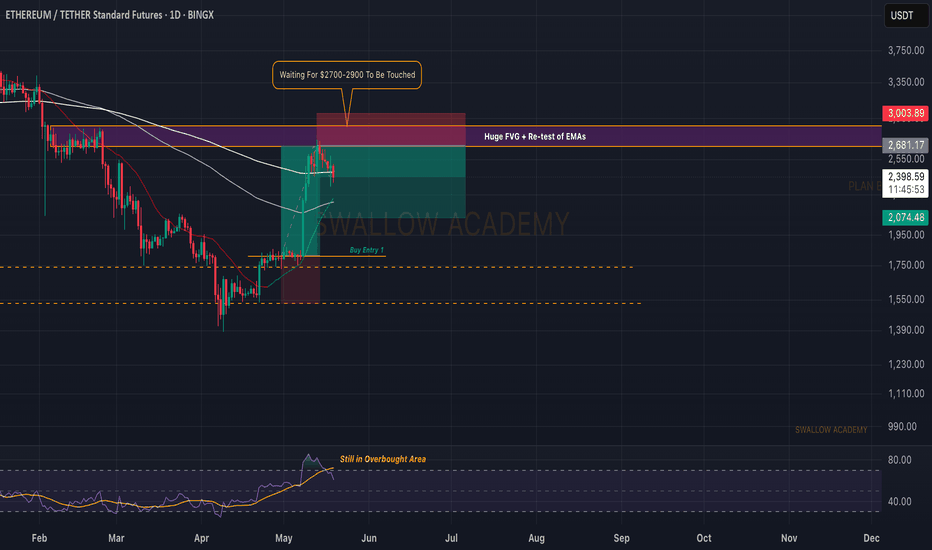
Ethereum (ETH): Good Rejection Happening | Correctional MovementEthereum had a good rally, but now we are seeing the dominance has fallen to sellers. While seeing the smaller correction that we have been looking for, we are seeing the price fall towards the 100EMA, where we expect to see another upward movement from there on.
So the game plan is simple here: we wait for clarity and proper touch to the 100EMA before looking for a long position on ETH.
Swallow Academy
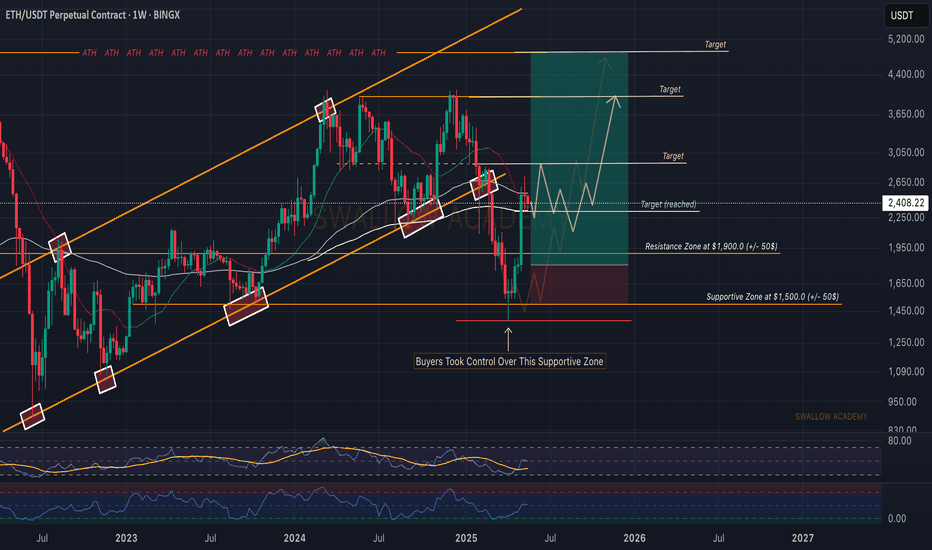
Ethereum (ETH): Sellers Showing Dominance, ETH up by 50% Ethereum is up by 50% since our entry on that coin, where we already took some decent profits as well (more than 60%). Despite us seeing further movement to upper zones, price has fallen for now to the major EMA line (200), where we need to see dominance fall back into buyers to see our second target reached.
With that being said, we are looking for upward movement towards our second target, from where we expect to see another wave of correction, similar to what we are seeing right now.
Swallow Academy
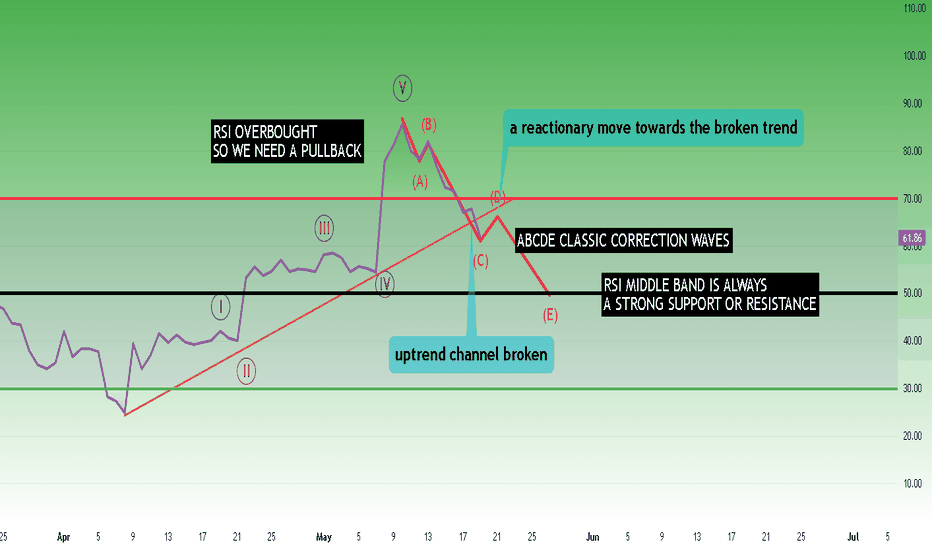
Short-term correction waves.Ethereum’s RSI has been rising significantly recently and has reached the overbought region. Therefore, it would not be surprising if it drops to the RSI mid-band from here. Then I expect Ethereum to continue its bullish waves.
* The purpose of my graphic drawings is purely educational.
* What i write here is not an investment advice. Please do your own research before investing in any asset.
* Never take my personal opinions as investment advice, you may lose your money.
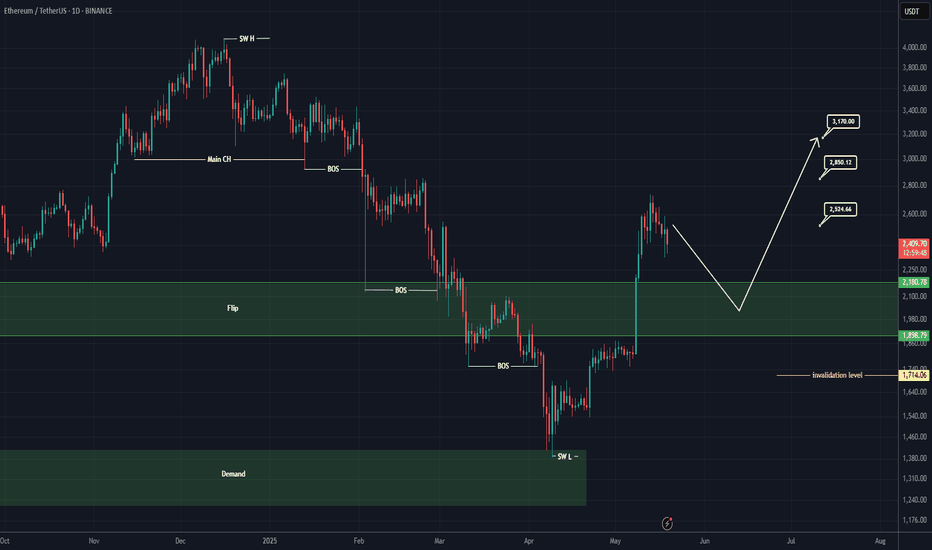
ETHEREUM New Update (1D)Ethereum has reclaimed the flip zone, but it hasn't tested this area or made a proper pullback yet.
It's expected that this zone will be tested before the price moves toward higher targets.
If we see a strong reaction around the green zone, we can look for potential buy/long positions.
A daily candle closing below the invalidation level would invalidate this analysis.
For risk management, please don't forget stop loss and capital management
When we reach the first target, save some profit and then change the stop to entry
Comment if you have any questions
Thank You
HolderStat┆ETHUSD wedge liftoff eyes 3 k sell zoneCRYPTOCAP:ETH blasted out of a multi-month falling wedge, erupting from 1.8 k to 2.7 k in one vertical burst. Price is now hovering above the broken wedge roof and an intersecting long-term trend line at roughly 2.55-2.60 k. If this freshly minted support holds, the pattern’s measured move directs attention to the 2.9-3.1 k sell zone in red. A dip under 2.45 k would simply delay, not negate, the bullish structure while the broader trend stays up-sloping.
ETH IS SHORT TIMEEthereum (ETH) recently enjoyed a strong bullish run, capturing investor excitement and surging in value. However, after the rally, it’s now pausing—consolidating gains and catching its breath. This cooldown is natural and healthy for long-term growth, setting the stage for potential future moves with renewed strength and stability.
ETH ANALYSIS📊 #ETH Analysis
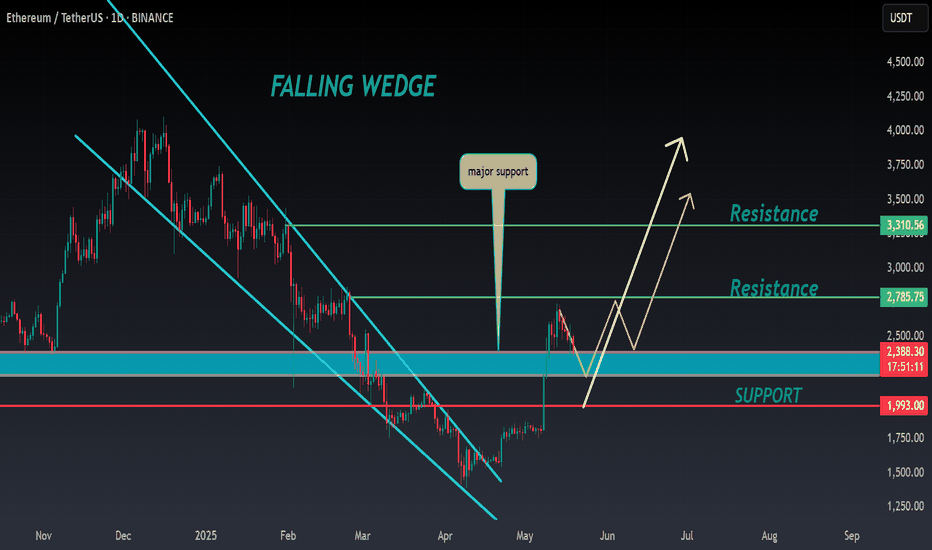
✅There is a formation of Falling Wedge Pattern on daily chart and currently trading around its major support zone🧐
Pattern signals potential bullish movement incoming after sustain above the major support zone
👀Current Price: $2380
🚀 Target Price: $2785
⚡️What to do ?
👀Keep an eye on #ETH price action and volume. We can trade according to the chart and make some profits⚡️⚡️
#ETH #Cryptocurrency #TechnicalAnalysis #DYOR
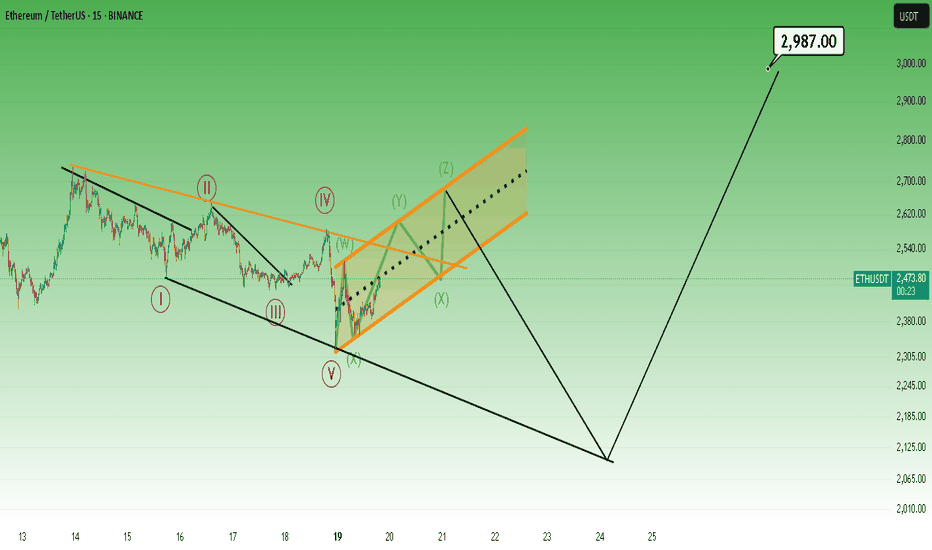
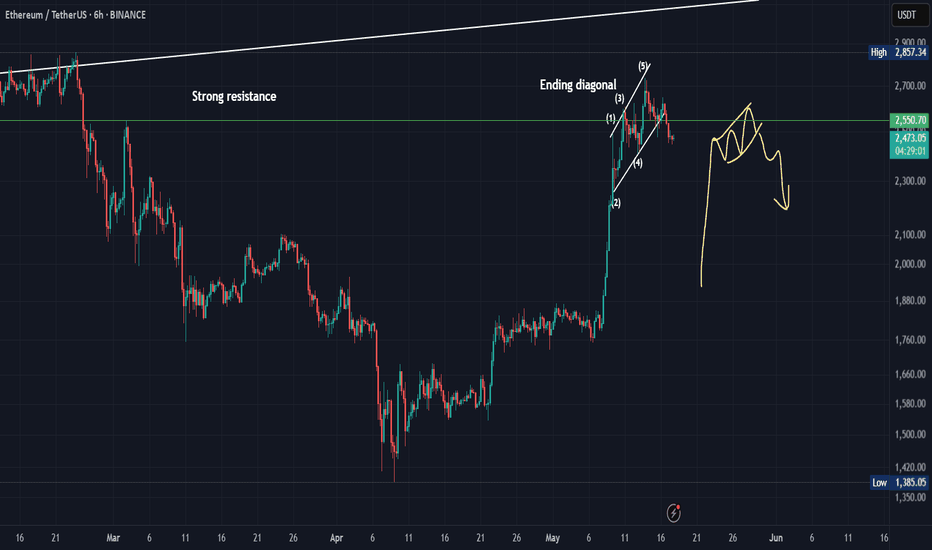
Next step for ETHThere is a ending diagonal formed from five overlapping waves and now it is preparing to break the bottom of the first wave and then decline again.
*In principle, I am not a supporter of any direction, but I am only giving my point of view, which may be right or wrong. If the analysis helps you, then this is for you. If you do not like this analysis, there is no problem. Just ignore it. My goal is to spread the benefit. I am not one of the founders of the currency.
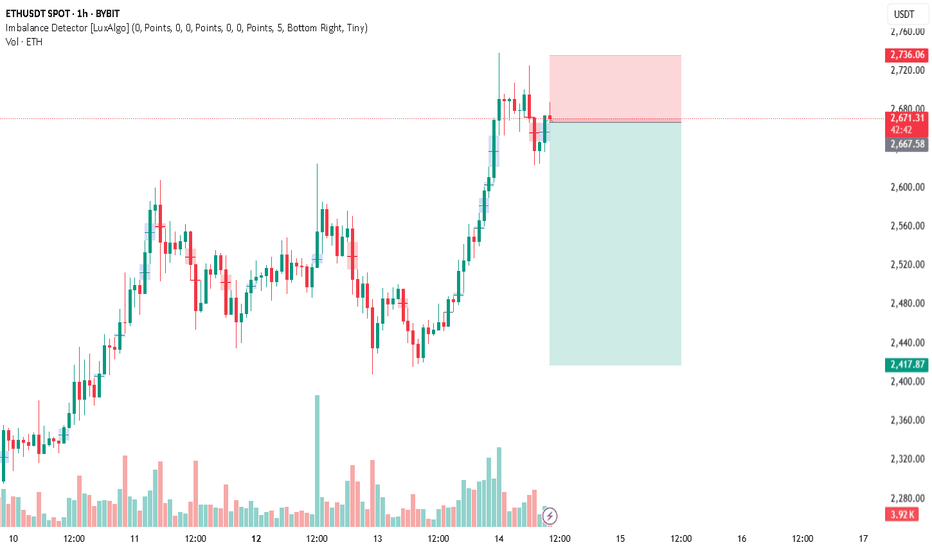
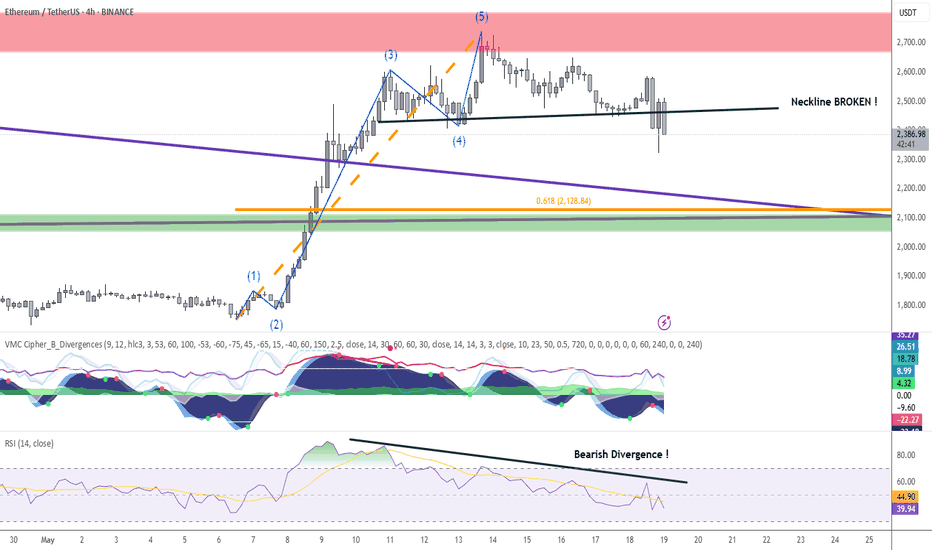
Short ETH | Target: $2,128ETH has tapped into a key resistance zone, potentially completing a 5-wave Elliott impulsive structure.
We’re also observing bearish divergences across multiple indicators, suggesting weakening bullish momentum.
Additionally, the neckline of a Head & Shoulders pattern has been broken, further supporting the bearish outlook.
I'm targeting the $2,128 level as the next area of interest, aligning with .618 Fib support and previous structure.
On the daily timeframe (D1), the $2,128 level aligns with a local demand zone and major trendlines that are likely to be retested
📉 Let’s see if the market confirms this setup.
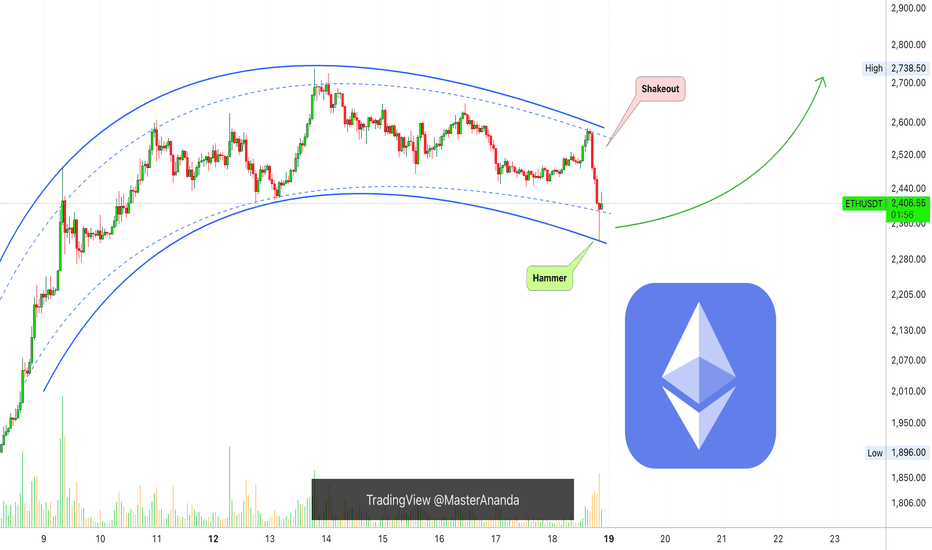
Ethereum Short-Term, Bullish Or Bearish?Notice this recent shakeout on the chart, this is a major move and surely removes lots of over leveraged positions. It also traps the bears, a bear-trap.
If this move continued lower it would be bad news but the 1H candle ended with a long lower wick, producing a hammer which is a reversal signal. This candle produced the lowest price since 9-May, 9 days ago, and the current candle is green, this tells us that a shakeout is confirmed.
The bearish move is a failed signal so the next move is up. With a very small bullish continuation, the current candle closing at current price or higher, it is confirmed ETHUSDT to continue rising.
(If the current candle were to close red and lower this would be a bearish confirmation.)
Short-term bullish structure intact. It is normal to see the market shaking before a major move. Remember, Bitcoin is about to close its 6th consecutive week green, the most bullish development of the decade. This affects Ethereum of course and the entire Cryptocurrency market.
Namaste.
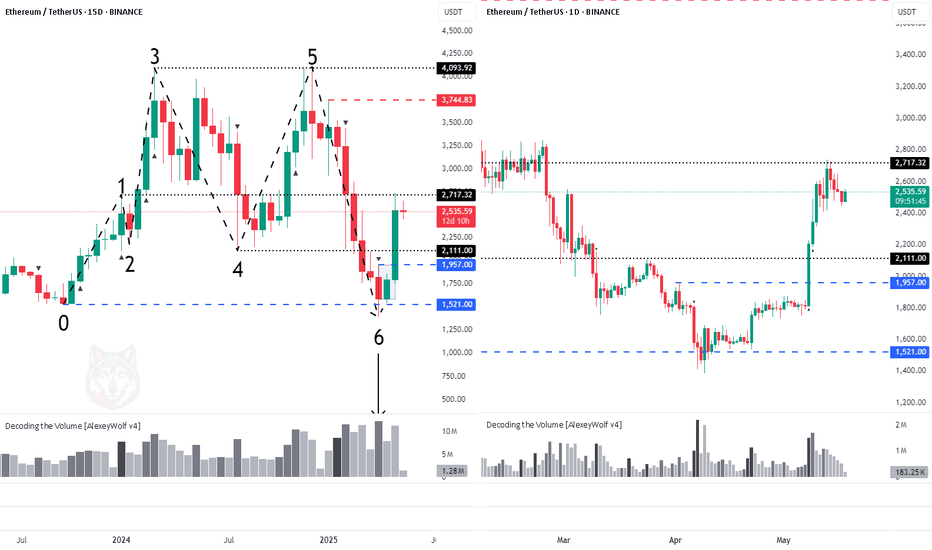
Ethereum: +80% in a Month — What’s Next?Hey traders and investors!
The price of ETH has surged by more than 80% over the past 30 days, but the momentum is starting to slow.
To understand the current position, we’re using the magic of timeframe switching and focusing on the 15-day chart.
Key Observations
1️⃣ A sideways range (consolidation) has formed on the 15D chart, with anchor points 1–6 (see chart).
2️⃣ The last major initiative came from sellers (move from point 5 to 6), and it includes some key features:
The initiative pushed below the lower boundary of the range — $2111.
The highest volume occurred on the last bar of this move (IKC bar).
The IKC bar absorbed liquidity not only below point 4 of the range but also below point 0 — the origin of the price move that preceded the formation of the range.
3️⃣ Buyers began developing their initiative by absorbing the sellers’ IKC bar, pushing price back into the range, and forming a buyer zone (blue rectangle on the chart, with the upper boundary at $1957).
4️⃣ Buyers have already reached the first target — $2717 (point 1 level).
What Does It Mean?
The rapid rally may slow down — the market likely needs some consolidation or a pullback.
A correction toward $2111 or even $1957 is possible. Both zones are attractive for medium-term long setups.
The medium-term bullish scenario remains valid as long as price stays above $2111.
Trade Outlook
📈 Long zones: $2111, $1957, or after a breakout and hold above $2717
🎯 Targets: $3744, then $4100
📉 Shorts are currently not justified — sellers show no real strength
Be ready for a potential “pause” in the rally and watch buyer activity — they currently hold the initiative (!).
This analysis is based on the Initiative Analysis concept (IA).
Wishing you profitable trades!
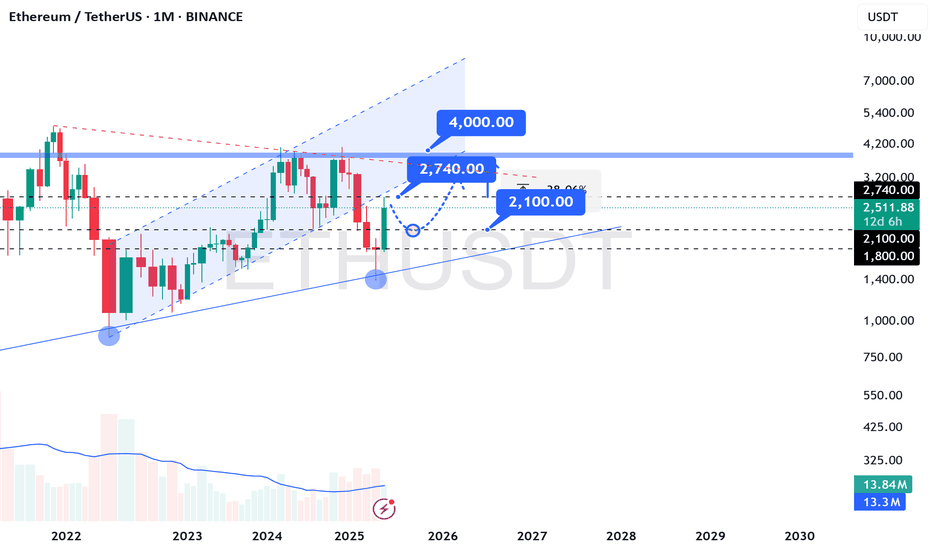
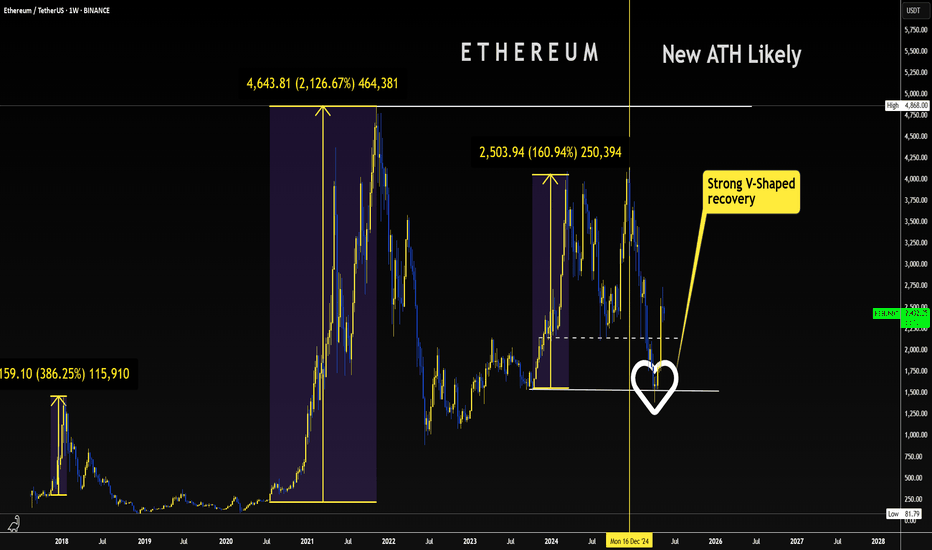
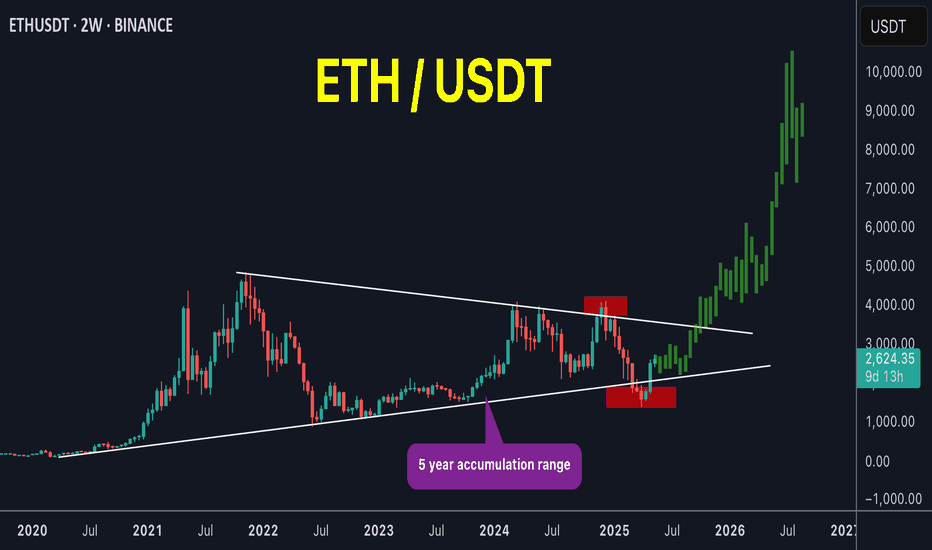
ETH (5 year of accumulation!)ETH / USDT
📌 Background: i shared an analysis about ETH/BTC chart and i predicted the ultimate bottom, from which ETH/BTC pumped 52% and ETH/USDT pumped 97% in few days !
you can check previous analysis: click here
📌 Today we have different chart against stable coin … Ethereum is being accumulated since 5 years in mega accumulation range with 2 major stop-loss hunt (long and short)
📌 What IF ?
What if ETH made a breakout throughout this accumulation ? i think we can see scenario like that in the green candles in my chart
DO YOU AGREE ?

