ETH is still Bullish!!Hello TradingView Family / Fellow Traders. This is Richard, also known as theSignalyst.
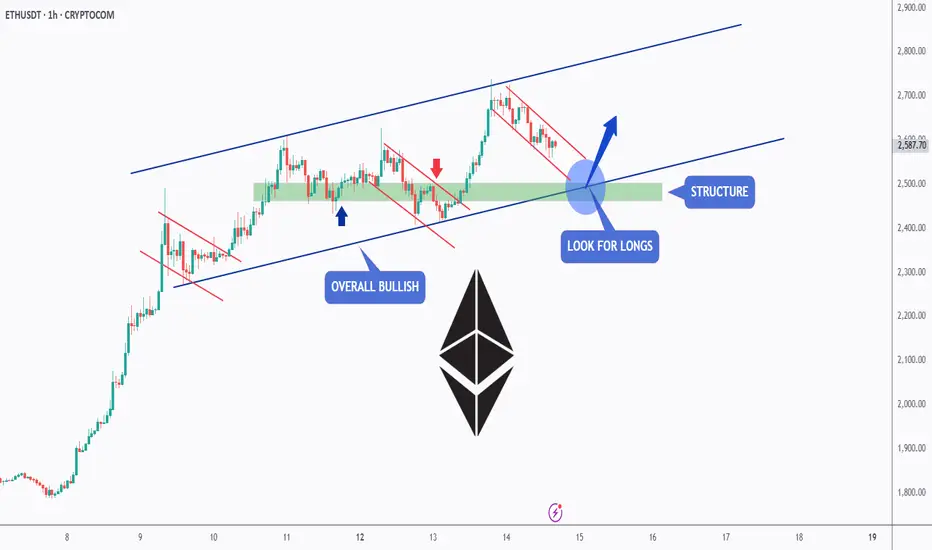
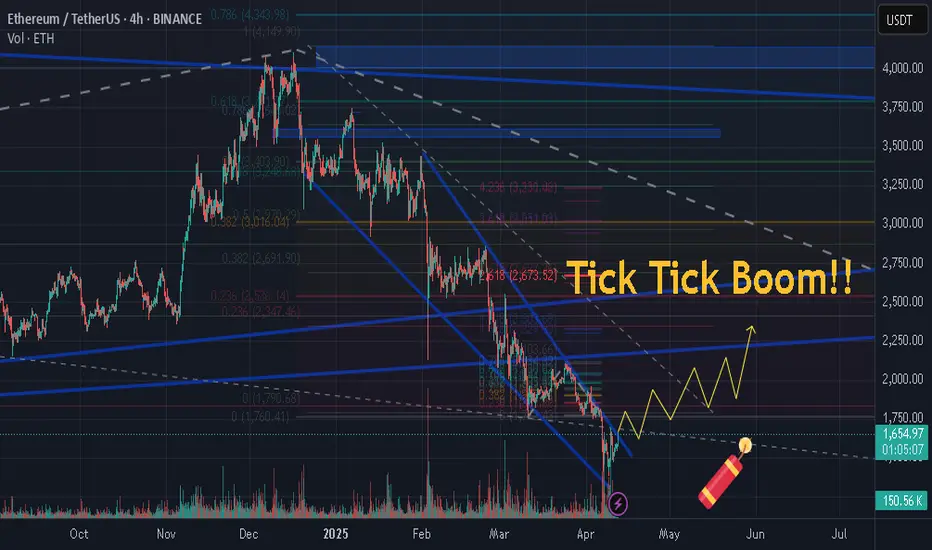
📈This week, ETH has been in a correction phase. However it is still overall bullish long-term trading within the rising channel marked in blue.
Moreover, the green zone is a strong demand and structure.
🏹 Thus, the highlighted blue circle is a strong area to look for buy setups as it is the intersection of structure and lower blue trendline acting non-horizontal support.
📚 As per my trading style:
As #ETH retests the blue circle zone, I will be looking for bullish reversal setups (like a double bottom pattern, trendline break , and so on...)
📚 Always follow your trading plan regarding entry, risk management, and trade management.
Good luck!
All Strategies Are Good; If Managed Properly!
~Rich
ETHUSDT.3S trade ideas
ETH – Short-Term Breakdown? Long-Term Levels in Play
🚨 CRYPTOCAP:ETH – Short-Term Breakdown? Long-Term Levels in Play
📉 On the 1H chart, ETH is trading inside an ascending channel but appears to be breaking down from it 🕳️ ***OR REVERSAL***
📆 Weekly structure remains intact for now:
🔹 Support zone: $2450–$2490
🔹 Resistance zone: $2850–$2880
🔄 A pullback from around $2730 remains within a healthy range, but the $2400± level is critical for holding bullish structure.
👀 Watch closely—short-term weakness may test macro support!

ETH/USDT Price Downtrend MovementThe price made a H4 strong buy movement and is starting to slowly shift to a small sell retracement...since we started to see LL's forming there is a chance of sell continuation. simple as that. be cautious and remember to always enter the safest only after fakeouts and right confirmations!
Short trade
1Hr TF overview
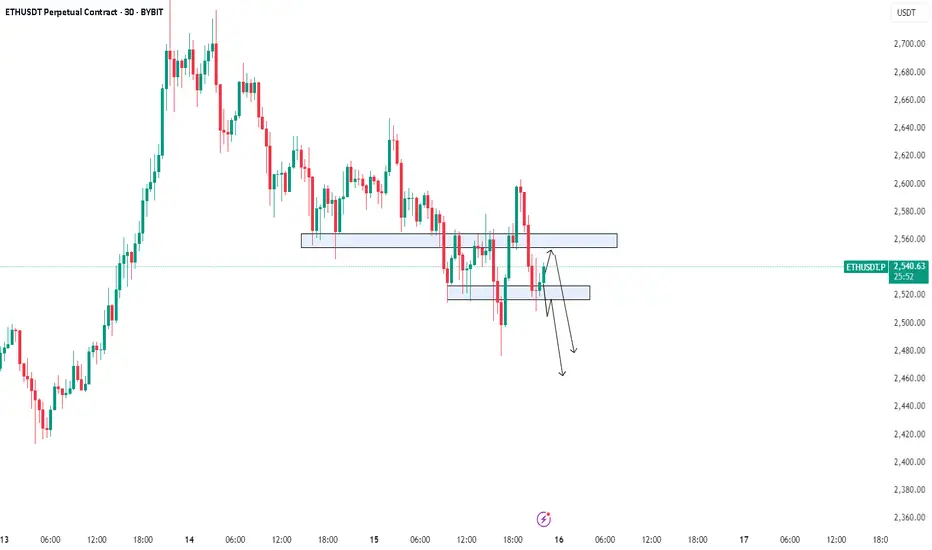
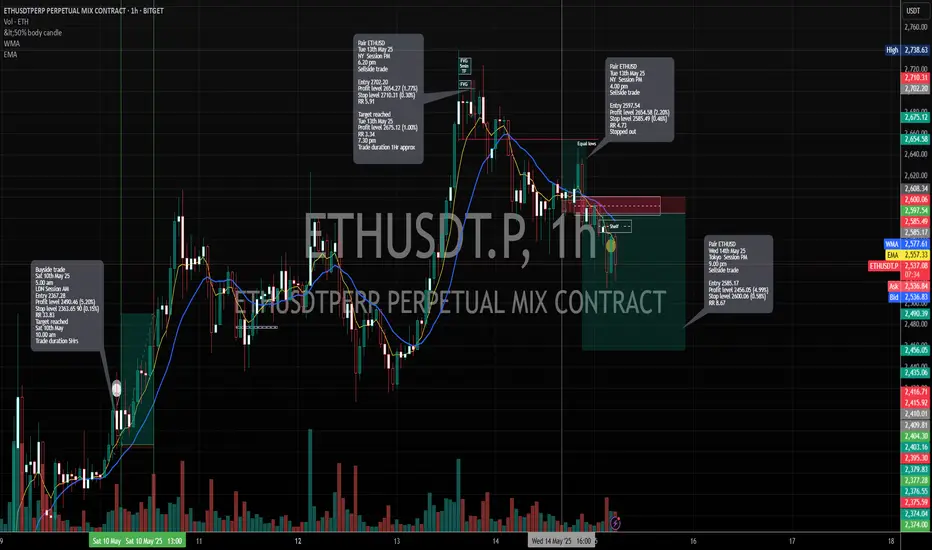
🟥 Sellside Trade Log
📉 Pair: ETH/USD
🏷️ Type: Intraday | Tokyo Session PM
🧠 Setup: Breakout (Shelf Method)
🆔 Trade ID: #ETHUSD-0514A
📅 Date: Wednesday, 14th May 2025
🕘 Time: 9:00 PM
🔹 Entry Price: 2,585.17
🔹 Profit Target: 2,456.05 (-4.99%)
🔹 Stop Loss: 2,600.06 (+0.58%)
🔹 Risk-Reward Ratio: 8.67
🔍 Reasoning:
A sellside breakout trade was initiated after the price broke decisively below a key horizontal shelf support level, confirming bearish continuation. The shelf method was used to identify price consolidation just above support, followed by a sharp breakdown, signalling a shift in directional bias. Order flow and structure supported a downside expansion, with the entry positioned to exploit clean inefficiency beneath the base.
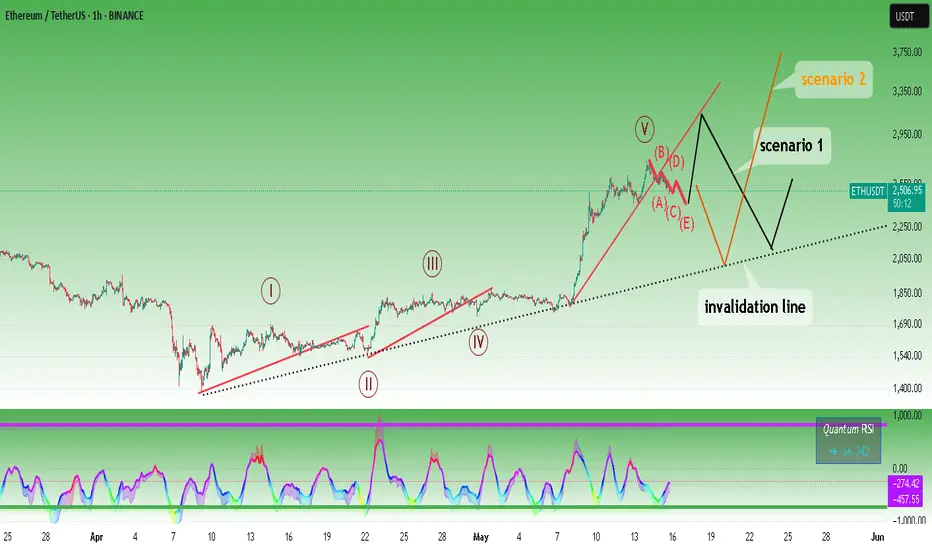
2 possible scenariosEthereum may continue to rise after correction waves. I showed 2 possible scenarios on the chart. If you zoom in a little bit more on the graph you can see the ABCDE waves more clearly. I think at least these waves will be completed.
* The purpose of my graphic drawings is purely educational.
* What i write here is not an investment advice. Please do your own research before investing in any asset.
* Never take my personal opinions as investment advice, you may lose your money.
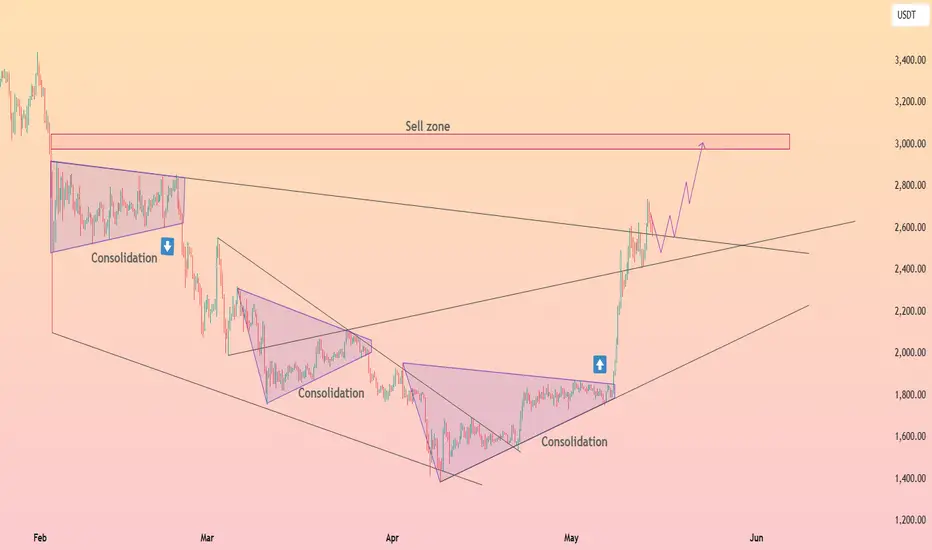
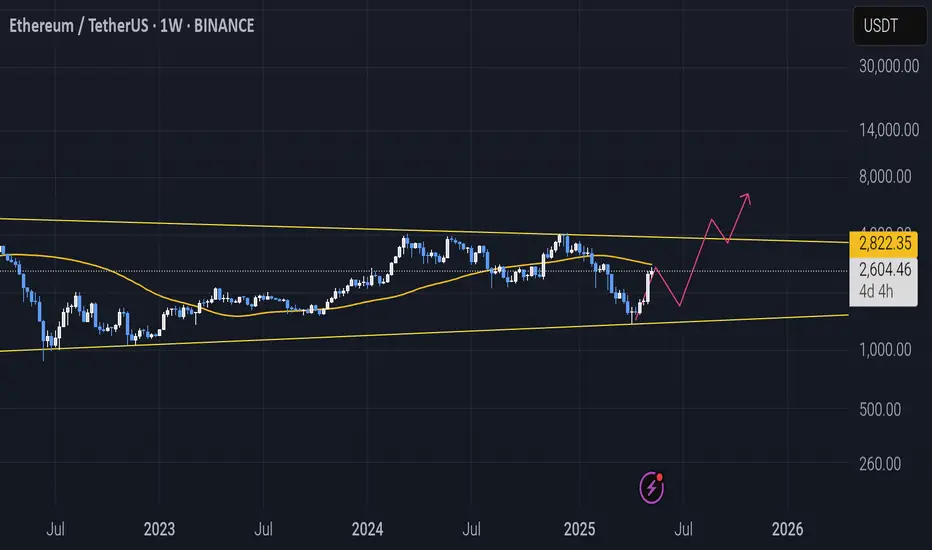
HolderStat┆ETHUSD wedge catapult toward 3kEthereum price tore out of its multi‑month falling wedge and smaller consolidation triangle, blasting through the mid‑2 k range before pausing around 2.7 k. As long as price respects the former wedge roof as trendline support, bulls retain scope to probe the highlighted 2.8‑3.1 k sell zone. A soft pullback into 2.4‑2.5 k would be viewed as a constructive retest rather than trend failure.
Ethereum (ETH): Targeting Bearish CME Gap | $2,349Ethereum is heading towards our target zone, where we will be looking for another support to form and an upward movement to start from there. We will not try to catch that movement here to downward movement but rather wait for our CME to be filled and then look for a buy entry once again.
Swallow Academy
Ethereum Has Bearish DivergenceI was looking for a local top in Ethereum and altcoins, and somehow forgot to mention this yesterday. Ethereum has bearish divergence with over bought RSI on every time frame from the daily down. This was a great topping signal, but also should indicate a bit more downside. The difference now is that I am looking to buy dips, not sell rips on altcoins.

ETHEREUM → Consolidation. Which way will the distribution go?BINANCE:ETHUSDT.P has moved into a consolidation phase after the distribution phase. Focus on the 2414-2725 range. A retest of support is possible during the current phase. Despite the bullish trend, there are risks of a reversal...
ETH has been a fairly unprofitable project over the past few years, with the price hitting one bottom after another. While Bitcoin and altcoins were flying high, ETH has only shown itself to be a bull in the last few days.
In the current phase, the focus is on the consolidation boundaries, as well as the 2550 level. If the bulls keep the market above 2550, then the coin could strengthen to 2725, which would be a positive sign for us that buyers are interested in continued growth.
If ETH continues its correction towards support at 2414, then we will need to monitor the market's reaction to this level. I remain skeptical about ETH due to its weak long-term performance despite a strong fundamental backdrop.
Resistance levels: 2550, 2725
Support levels: 2414, 2260
Further movement will determine the price's exit from consolidation: a breakdown of support means a fall, a breakout of resistance means growth. But the current scenario is trading within the range. If ETH trades near 2725 and forms a pre-breakout consolidation, then we will have a chance for growth.
The opposite scenario is if the price falls below 2550 and begins to test 2414. In this case, sticking to the support level and numerous retests will indicate that the bull market has exhausted its strength and we can expect a correction to 2260-2065.
Best regards, R. Linda!

ETH: The moment looks goodEthereum is trying to show strength. The price is surging and it's important for ETH to not loose the 2350 level. This is an important support zone, loosing it will probably lead the price to $1900-1950
ETH Mid-Term TargetETH will make this chickpea, hazelnut, walnut pattern in the medium term.
**Not investment advice

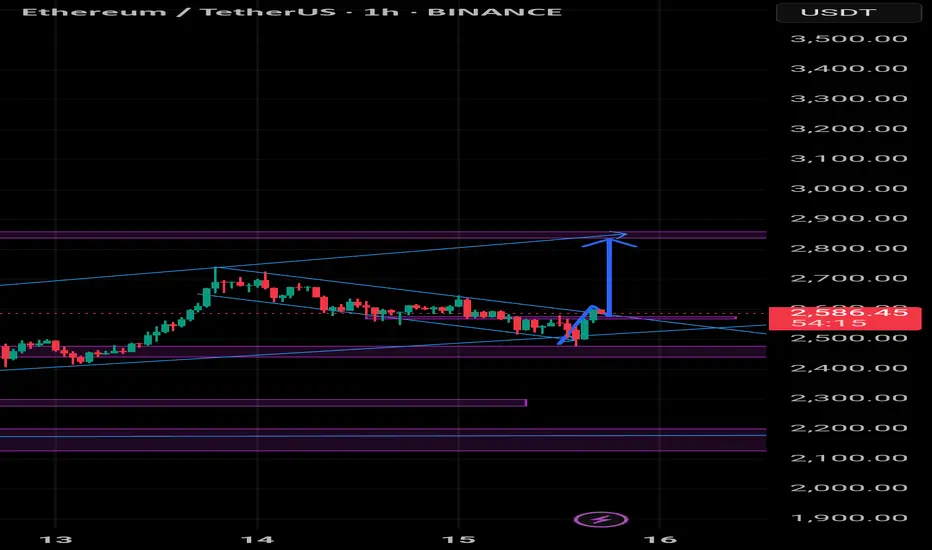
Will ETH Hit 16% Upside With $3,100 In Sight?Hello and greetings to all the crypto enthusiasts, ✌
All previous targets were nailed ✅! Now, let’s dive into a full analysis of the upcoming price potential for Ethereum 🔍📈.
Ethereum continues its bullish trajectory 🚀 following last week’s impressive rally. With strong volume backing the move, a breakout above the $3,000 psychological level appears imminent. I’m targeting a 16% upside with a primary resistance at $3,100 , supported by daily structure, Fibonacci alignment, and a long-term trendline 🔍.
🧨 Our team's main opinion is: 🧨
Ethereum is gaining momentum with a 16% upside in sight — main target at $3,100 after a clean $3,000 breakout 🚀.
Give me some energy !!
✨We invest hours crafting valuable ideas, and your support means everything—feel free to ask questions in the comments! 😊💬
Cheers, Mad Whale. 🐋

Ethereum Monthly: Bull-Bear Market & Transition Until 2029Ethereum closed five months red, something seen only once in the past in 2018 in a bear market. Needless to say, after such a strong bearish period the market produced an equally strong bull market.
Back in 2018 Ethereum went beyond five months red but this is the only time ever in its history, then now in 2025 this is the longest stretch of continued bearish action. This is good because we know that the market will produce a bull market that is many times stronger, just to balance things out.
These five red months resulted in a long-term higher low.
The bottom was hit at $1,385 in April, last month. This month we already have a full green candle going mid-way through February. All the loses incurred in April and March have been recovered.
The low last month hit levels not seen since March 2023. In March 2023 ETHUSDT was rising but produced first some bearish action; the month closed green. After more than eight months of consolidation it produced a major advance and the highest prices since the 2021 All-Time High.
This time it will be different. Ethereum will be rising steadily, month after month. Rather than sideways-neutral, up-up.
In 2024 there was a double top. March 2024 and December 2024.
In 2025 we will have one top, a blow-off top. So there will be only one chance to sell when prices are really high up.
It will grow steadily month after month as bullish momentum builds up. After several months, we will have a bull run reaching mania levels, euphoria, excitement and a very strong new All-Time High. After this phase is over, the classic bear market in 2026.
The bear market will produce a multi-year low price, then a period of consolidation, sideways-neutral, and then back again bullish, a major bull market in 2029. There will be growth in the transition years, 2027 and 2028. You can equate these with 2023 and 2024.
2022 was the last bear market.
2026 will be the next bear market.
2021 was the last bull market.
2025 is the next bull market.
2023-2024 were the transition years.
2027-2028 will be transition years.
Thank you for reading.
Namaste.
Ethereum Ethusdt Elliott wave impulse
Altseason in July
1bearishing all market
2bitcoin season
3altseason
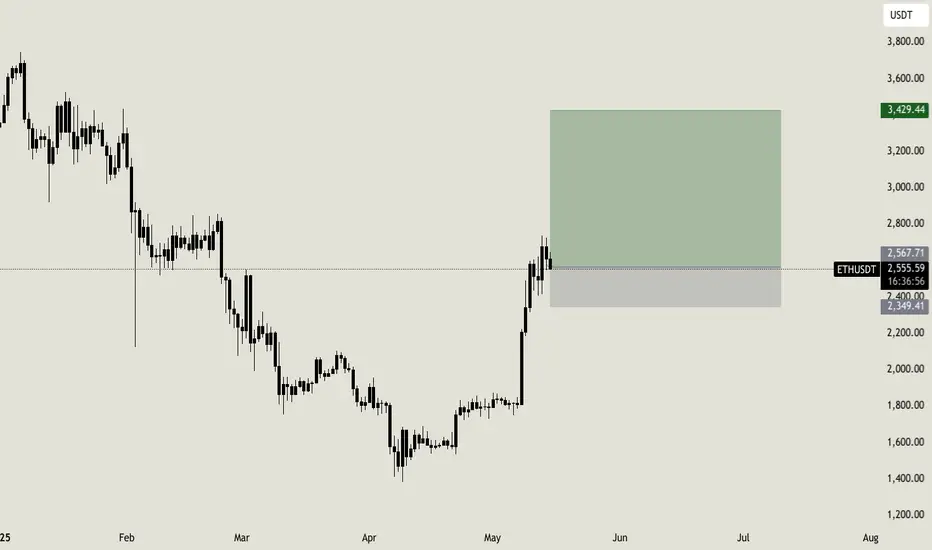
ETH - Ranges overview Let's have a look at how ETH is currently trading.
From a monthly (1 month) perspective we have deviated the sellside and have started to regain 2.5K.
IF we hold 2550 expect us to push back up towards the buyside liquidity sitting around 3.4K and 4K as second target IF the market holds.
IF we get a clean break below 2.2K expect us to retrace towards 1.8K.
BE PATIENT...WAIT FOR THE MARKET...TRADE WITH IT.
As always in crypto...keep an eye on BTC who will be the main indicator.
For those who have been trading ETH for more than 5 years you'll fully understand the importance of 2.5K.
For the rest...TRUST YOUR SYSTEM and WAIT FOR THE MARKET TO SHOW YOU ITS HAND.
Stay safe and never risk more than 1-5% of your capital per trade. The following analysis is merely a price action based analysis and does not constitute financial advice in any form.

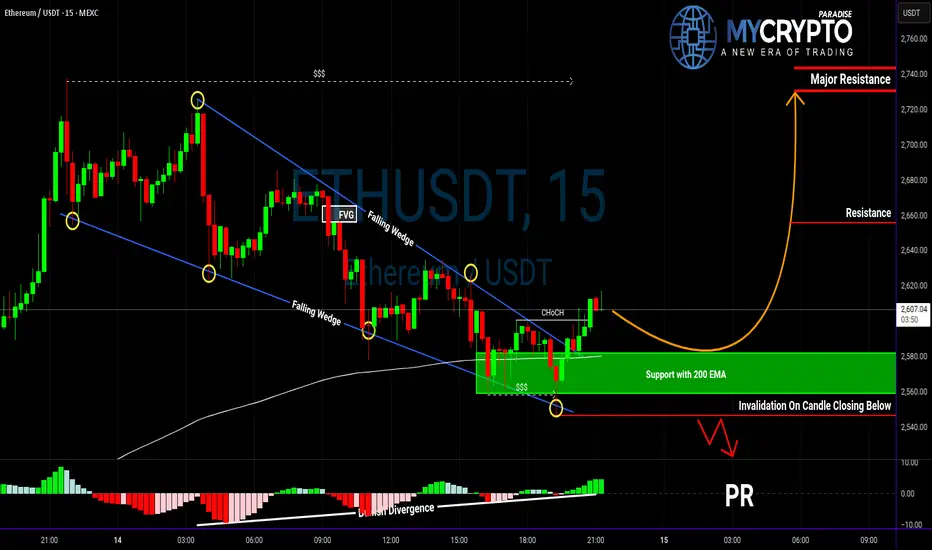
ETH Bulls on Alert: Is This the Move We've Been Waiting For?Yello Paradisers, did you catch that bullish breakout on ETH or are you still stuck waiting for confirmation?
💎Ethereum has officially broken out of its falling wedge pattern, which is a well-known bullish structure often signaling a trend reversal. What gives this breakout even more weight is that ETH has established a support zone exactly at the 200 EMA—an area that historically acts as a key level for institutional traders.
💎Adding to the bullish case, we’ve also identified a bullish divergence on the momentum indicators, which often suggests weakening selling pressure and the potential for upside. More importantly, there has been a clear bullish CHoCH (Change of Character), confirming that market structure is shifting in favor of the bulls. With all of these signals aligning, the probability of a continued bullish move is significantly higher.
💎However, the most disciplined traders understand that no setup is perfect without confirmation. A pullback to the support zone would offer a textbook opportunity for a high-risk-to-reward entry—ideal for bulls who are patiently waiting for a safer entry point rather than chasing the move. This kind of setup allows us to manage our risk properly and act only when the odds are clearly in our favor.
💎That said, if the price breaks down and closes below the support zone, the bullish idea is completely invalidated. This is the level where we draw the line and step aside. Being able to invalidate your own bias is what separates traders who survive from those who don't.
🎖We are playing it safe right now. If you want to be consistently profitable, you need to be extremely patient and always wait only for the best, highest probability trading opportunities.
MyCryptoParadise
iFeel the success🌴
Bitcoin Wave Analysis.Bitcoin (1D) Wave Analysis:
BTC/Tether Perpetual Futures on the daily chart displays a consistent wave pattern.
The first impulse saw an 11.4% rise, followed by an 8-day consolidation.
A second impulse of 9.1% preceded a 13-day consolidation.
The third impulse delivered a 9.6% gain, with a subsequent 5-day consolidation.
With an average impulse range of 10%, a fourth impulse is projected, potentially pushing #BTC to new highs.
The current price is approximately $103,000 which is about 7% below the 52-week high and all-time high of $109,967 reached on January 20, 2025.
The three prior legs were driven by a combination of macroeconomic and market factors: the US-China Tariff Agreement, strong corporate earnings, a benign inflation report, and the S&P500 crossing above its 200-day moving average.
These catalysts fueled bullish sentiment across markets, including #BTC. However, for a fourth leg to materialize, BTC may require another strong catalyst. Without such a trigger, it might struggle to muster the momentum needed for a new impulse.
Having already seen three impulses, BTC is on the horizon to challenge the 52-week high and all-time high levels.
The key question is whether buyers have enough strength to drive another impulse (leg). If this occurs, will it be sufficient to break through and establish a new all-time high ?

Don't overlook the buying opportunities that may arise.Hello friends.
The growth that Ethereum has had in the past few days can be up to the range it is currently in.
If you are left with the profit that Ethereum has made in the past few days, you can make your purchases in case of correction.
How long can this correction last?
If Ethereum corrects, you can complete your purchases below the $2,000 range for fair purchases.
Is it possible that it will correct further?
Yes, it is possible that it will correct further, so you can divide the amount of capital you want to buy into two parts, so that the second step is lower in case of correction.

I see ETH break the trend lineETH owner buy enough coin in their wallet with breaking the descend line.
ETH => Shift In Momentum Almost Done!Hello TradingView Family / Fellow Traders. This is Richard, also known as theSignalyst.
📉 Since breaking below its last major low in December 2024, Ethereum (ETH) has been stuck in a bearish trend.
But don’t lose hope, bulls! 🐂
⚠️It’s evident from the last correction phase, marked in blue, that it's larger than the previous ones — a clear sign that the bulls are stronger than ever.
A growing correction phase is often the first signal of an upcoming momentum shift.
This shift will be confirmed once ETH breaks above the last major high marked in red at $2,100.
📈A break above $2,100 would flip ETH’s trend from bearish to bullish, signaling the potential start of the Altcoin season!
Until then, patience is key. 🧘♂️
📚 Always follow your trading plan regarding entry, risk management, and trade management.
Good luck!
All Strategies Are Good; If Managed Properly!
~Rich

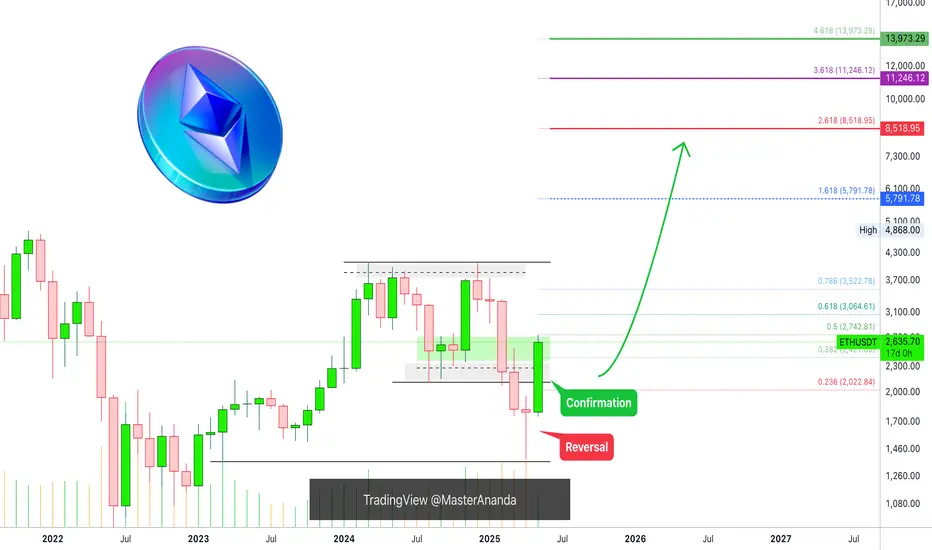
Ethereum ETH Will Go Insane Soon!Hello, Skyrexians!
It's not a top secret that Bitcoin dominance is about to finish the uptrend and it can give the second life to BINANCE:ETHUSDT . We have already seen the bounce, but now asset is struggling to break through $2600. We can really see small correction in the upcoming week, but finally uptrend has been already confirmed.
Let's take a look at the weekly chart. I marked the Elliott waves structure for you and in my opinion now price is printing the wave 3. At the bottom there was a green dot on Bullish/Bearish Reversal Bar Indicator which is huge confirmation of the bull run. The target for wave 3 is 1.61 Fibonacci at $6500. Anyway, please take into account the second scenario, when BTC dominance will reach 67% and ETH will retest the low (wave 5 in C). Now I have 50/50 probability, but anyway if you bought alts at the 65.3% dominance your deposit will not suffer significantly.
Best regards,
Ivan Skyrexio
___________________________________________________________
Please, boost this article and subscribe our page if you like analysis!

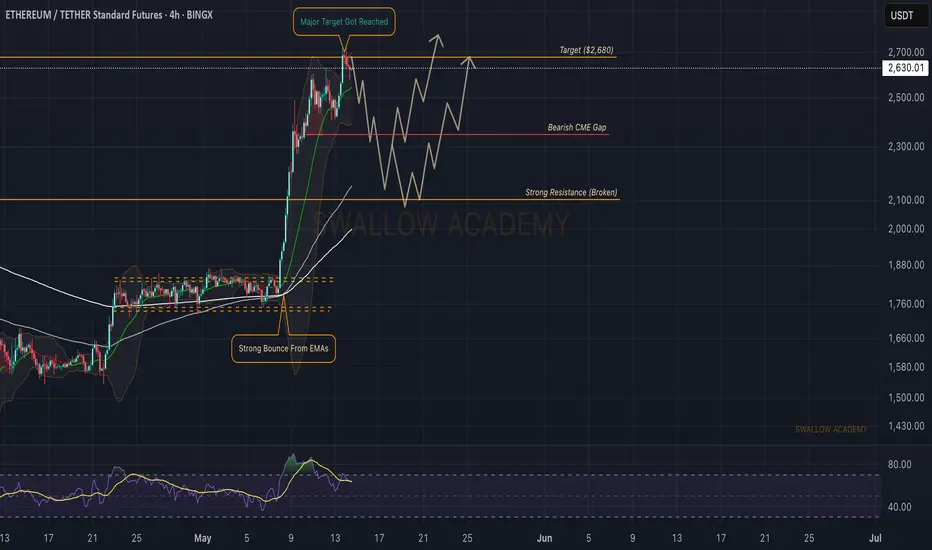
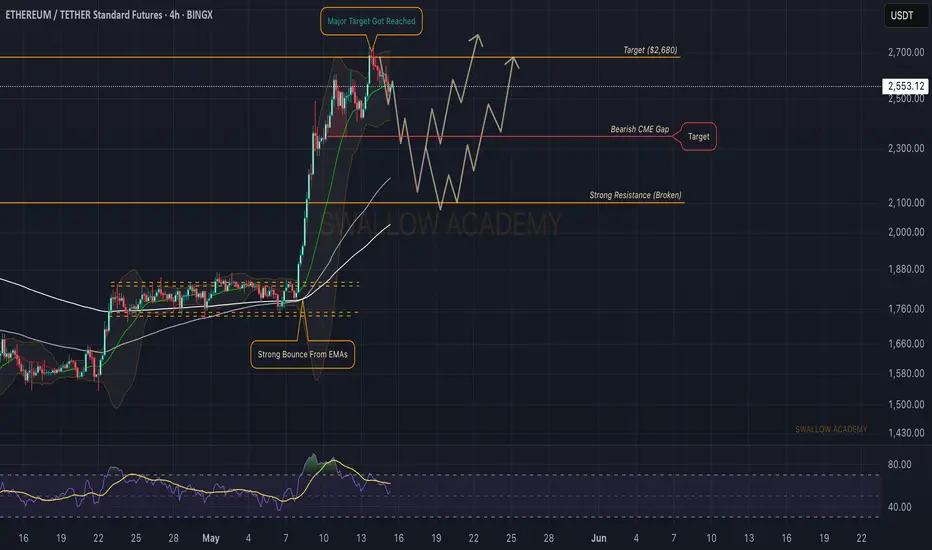
Ethereum (ETH): We Reached Our Major Target | Possible DropWe reached our major target zone where ETH touched the $2,700 area (where we caught the movement from $1,950 to $2,700). We had a good upward movement and now it is time for a smaller correctional movement before another BOS and bullish movement.
Now we also might not see the correctional movement that would fill the bearish CME gap (but it would be an ideal buy zone for us). The other scenario would be seeing a proper BOS on smaller timeframes with a successful retest.
Swallow Academy