Don't miss Ethereum todayHello friends
Given the good rise we had, you can see that the price has entered a correction and has provided us with a good opportunity to buy in steps, of course with capital and risk management.
*Trade safely with us*
ETHUSDT.3S trade ideas


It's just one lineSimplicity meets precision.
This single line captures every major support and resistance level on the ETH/USDT chart — no clutter, just clarity.
Whether you're a breakout trader or range hunter, this level tells the whole story. Watch closely how price respects it.
#ETH #Ethereum #Crypto #SupportResistance #TradingView #CryptoAnalysis #PriceAction

HOW: TradeAgent Pro Technical Analysis FrameworkWelcome to our technical analysis community! This comprehensive guide explores advanced trading concepts and systematic risk management approaches.
SYSTEM OVERVIEW
TradeAgent Pro combines multiple technical analysis tools into an educational framework for market analysis and risk management.
KEY FEATURES:
1. Advanced Market Analysis
• Multi-Timeframe Integration
- Long-term trend identification (EMA/SMA)
- Short-term momentum signals
- Market structure validation
• Visual Confirmation System
- Strong trends: Green/Red signals
- Moderate trends: Yellow/Orange indicators
- Multiple confirmation points
2. Risk Management Suite
• Dynamic Stop Loss Technology
- ATR-based volatility adaptation
- Multiple timeframe validation
- Automatic adjustment system
• Strategic Take Profit Framework
- Multiple TP levels
- Position scaling methodology
- Risk-reward optimization
• Intelligent Trailing System
- Dynamic trailing activation
- Position-based adjustments
- Momentum-driven modifications
3. Professional Tools
• Entry Management
- Systematic confirmation signals
- Risk-adjusted sizing
- Market structure analysis
• Exit Framework
- Multiple exit strategies
- Risk reduction system
- Position adjustment logic
EDUCATIONAL RESOURCES:
• Regular technical analysis updates
• Community trading discussions
• Educational content sharing
• Risk management concepts
IMPLEMENTATION GUIDE:
1. Study the framework thoroughly
2. Practice in demo environment
3. Document your observations
4. Adapt to market conditions
5. Focus on risk management first
IMPORTANT DISCLAIMERS:
• Educational content only
• Not financial advice
• Requires extensive testing
• Trading involves significant risk
• Past performance isn't indicative
JOIN OUR COMMUNITY:
1. Send private message
2. Include:
- Trading experience
- Preferred markets
- Analysis timeframes
3. Await verification
No public access requests.
Stay updated with our latest educational content and technical analysis discussions.

Short trade 🟥 Sellside Trade Log
📉 Pair: ETH/USD
🏷️ Type: Intraday | NY Session PM
🧠 Setup: Breakout (Downside)
📅 Date: Tuesday, 13th May 2025
🕕 Time: 6:20 PM
🔹 Entry Price: 2,702.20
🔹 Profit Target: 2,654.27 (-1.77%)
🔹 Stop Loss: 2,710.31 (+0.30%)
🔹 Risk-Reward Ratio: 5.91
🔍 Reasoning:
Sellside breakout trade assumes a clear momentum-driven directional bias during the NY PM session. The move was reinforced by forming a Fair Value Gap (FVG) on the lower timeframe (5min), indicating institutional selling pressure and inefficiency. Price broke below a key structural level and continued into the FVG, confirming bearish intent. Entry was taken with confluence from the gap, targeting the next liquidity pool while maintaining tight stop control above the invalidation zone.
5min TF entry

Is Now the Time for Ethereum to Be Re-evaluated?We are the SeoVereign Trading Team.
With sharp insight and precise analysis, we regularly share trading ideas on Bitcoin and other major assets—always guided by structure, sentiment, and momentum.
🔔 Follow us to never miss a market update.
🔥 As Bitcoin reclaims the 100K narrative, Ethereum is waking up.
In the wake of Bitcoin’s bullish momentum, Ethereum is flashing strong reversal signals.
After a prolonged period of undervaluation and market hesitation, it’s finally time for ETH to be re-evaluated for what it’s truly worth.
At SeoVereign, we’re positioning strategically long on Ethereum, aligning with both technical setups and market sentiment.
This isn't just a short-term bounce—it's potentially the start of a mid-term trend reversal.
🎯 Target 1: 2,566 — Breaking near-term resistance
🎯 Target 2: 2,598 — Key mid-structure objective
📊 Right now, the market is split between the hesitant and the proactive.
We're choosing to be ahead of the curve.
🚀 The SeoVereign Team is here to catch this wave—
Now is the time to ride the ETH long setup.

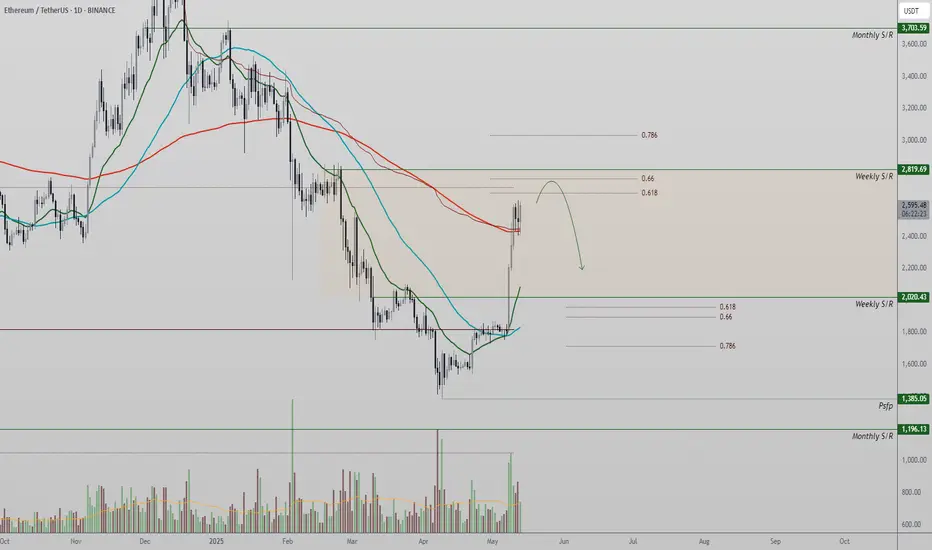
ETH/USDT – Bullish Momentum into Major ResistanceEthereum continues to show bullish strength, trading above the 200-day moving average. Price action is now approaching a high-confluence resistance zone around $2,800, which could trigger the next major move.
Key Highlights:
Support: 200-day MA continues to hold with 3 daily closes above
Resistance: $2,800 zone = 0.618 Fib + Weekly SR + Value Area High
Structure: Higher highs and higher lows intact on the daily timeframe
Technical Breakdown:
ETH is currently holding strong above the 200MA, confirming bullish structure with a series of higher lows. Immediate resistance lies at the $2,800 zone, which aligns with several key levels, making it a critical decision point. A breakout above this area with strong volume could push ETH toward new local highs.
Conversely, failure to break $2,800 could result in a rotation back toward $2,000, where the last major support and psychological level sits. This would offer a strong “buy-the-dip” opportunity, especially if the trend remains intact.
Bias:
Bullish above 200MA — watching for reaction at $2,800 to confirm continuation or retracement.
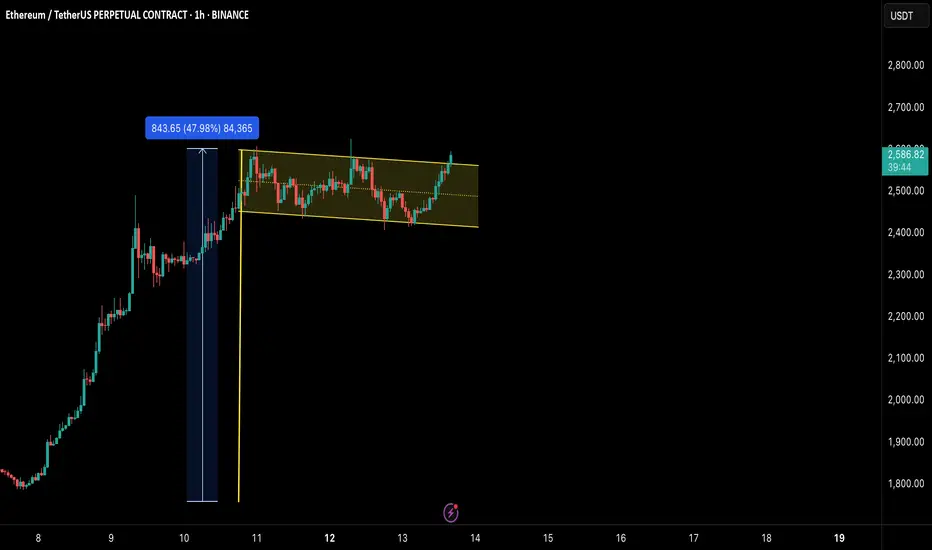
ETH/USDT: BULL FLAG BREAKOUT!!🚀 Hey Traders! 👋
If you’re finding value in this analysis, smash that 👍 and hit Follow for high-accuracy trade setups that actually deliver! 💹🔥
🔥 #ETHUSDT UPDATE – Ready for the Next Leg?
ETH surged nearly 48% recently and is now consolidating inside a clean parallel channel. After a healthy sideways move, price is starting to push the upper resistance again — a breakout from here could trigger the next rally phase! 🚀
🔸 Pattern: Bullish Flag/Parallel Channel
🔸 Current Structure: Post-pump consolidation
🔸 Watch for: Break above the upper yellow line for confirmation
🔸 Targets: $2,750 – $2,880+
🔸 Invalidation: Break below channel support and $2,430
📈 If bulls hold this zone, we could witness another explosive move! Keep it on your radar.
💬 What do you think? Is ETH gearing up for a breakout? Drop your thoughts below!
📌 Follow for more high-probability setups!
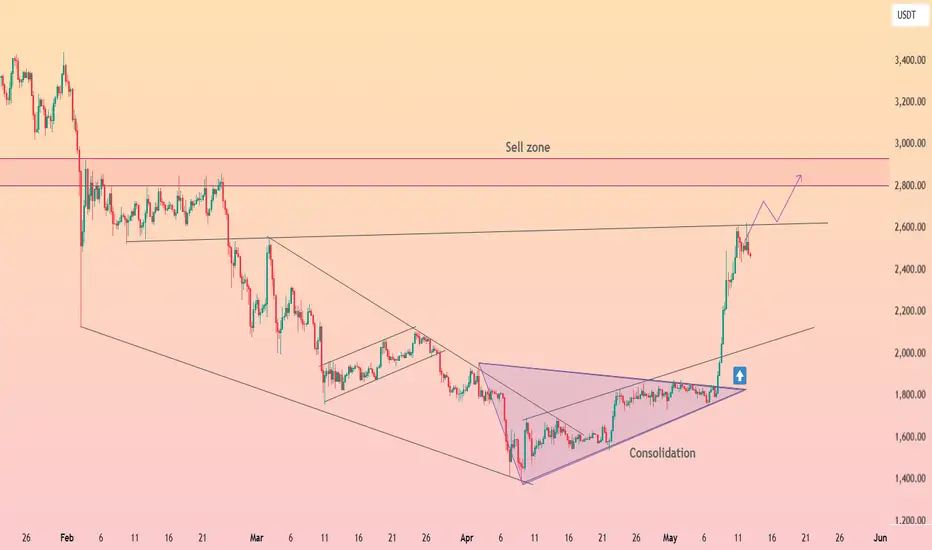
HolderStat┆ETHUSD retest $2500 After months locked inside a broad falling wedge, ETH erupted in early May, blasting through both the wedge roof and an internal consolidation triangle. The vertical thrust carried price from 1.8 k straight to 2.6 k, where a key horizontal lid now tests bulls’ resolve. Short‑term dips back toward the broken trendline or 2.2 k support would look constructive while momentum targets the well‑flagged 2.8‑3 k sell zone overhead. 🎯
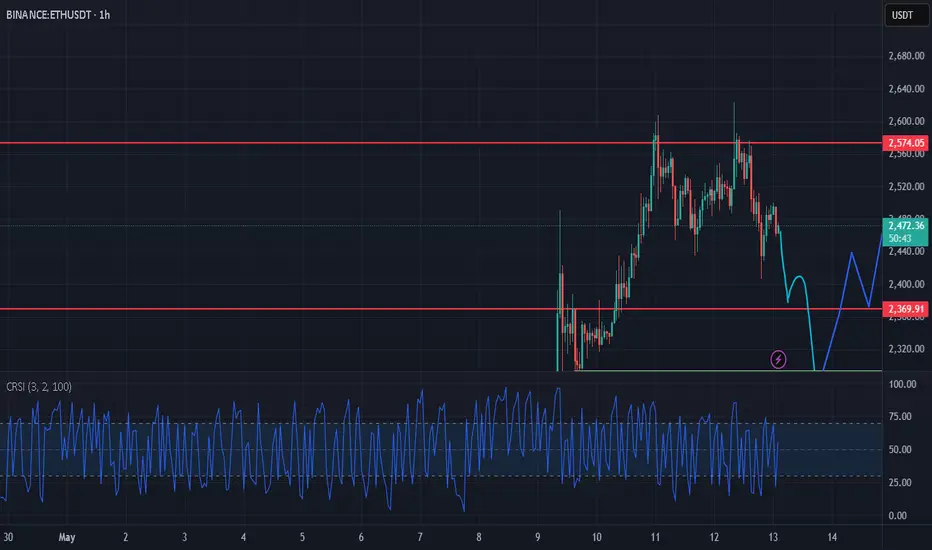
** ETH/USDT Update: Key Levels & Reversal Watch** Hello everyone, this is Dark Analysis.
### **📌 Latest Technical Outlook**
1. **Previous Analysis Hit Target**:
- Support at **$2,435.32** held as expected, and the target was achieved.
- Break above **$2,513.43** has shifted bias to **bullish**.
2. **Current Price Action**:
- **Bullish Scenario**: Price is likely to hunt liquidity in the demand zone near **$2,463.45**.
- *Entry (Long)*: Only if a **reversal pattern** (e.g., Bullish Engulfing, Hammer) forms here.
- *Stop Loss*: **$2,449.44** (below recent swing low).
- **Caution**: No long trades if price approaches the zone with **weak bullish momentum**.
3. **Bearish Invalidation**:
- Shorts are **off the table** unless:
- A new **supply zone** forms.
- Price shows **weakness after retesting highs** (e.g., lower high + RSI divergence).
---
### **🎯 Trade Plan (If Setup Triggers)**
- **Entry Zone**: **$2,463.45** (Demand Area)
- **Confirmation**: Reversal candle + volume spike.
- **Target**: Previous high (**$2,513.43**) → **$2,550** (next liquidity zone).
- **Stop Loss**: **$2,449.44** (tight risk management).
---
### **📊 Key Chart Levels**
- **Support**: $2,463.45 (Demand Zone) → $2,435.32 (Strong Base)
- **Resistance**: $2,513.43 (Breakout Confirmation) → $2,550 (Next Target)
---
### **⚠️ Critical Reminders**
- **No Longs on Strong Momentum Dips** (Wait for structured pullbacks).
- **Avoid Shorts Unless New Supply Forms** (Trend is bullish above $2,513.43).
- **Always Use Stops** (Protect capital in volatile moves).
---
**📌 Final Note**: *"Trade the structure, not the noise!"* Updates will follow if the scenario changes.
**🔍 Follow for real-time insights!**
Eth Whales Poised to Sell at $2,700: What It Means for Market?The potential for Ethereum (Shark)whales to sell at $2,700 underscores the importance of tracking large holders' behavior in the crypto market.
While such moves can create short-term volatility, they are also a natural part of market cycles. By staying informed and adopting a strategic approach, we can navigate these fluctuations effectively and make decisions aligned with their long-term goals using Candles Patterns .

Ethereum (ETH): First Signs of Weakness, We Will Drop SoonEthereum is still showing strong sentiments where, despite smaller corrections, we had buyers overtake current zones again and now are leading to another upward movement, which might possibly fill our target area of $2700.
As long as we are not near this zone, we are going to just wait or if we see another wave of sell-off with proper MSB and retest.
Swallow Academy

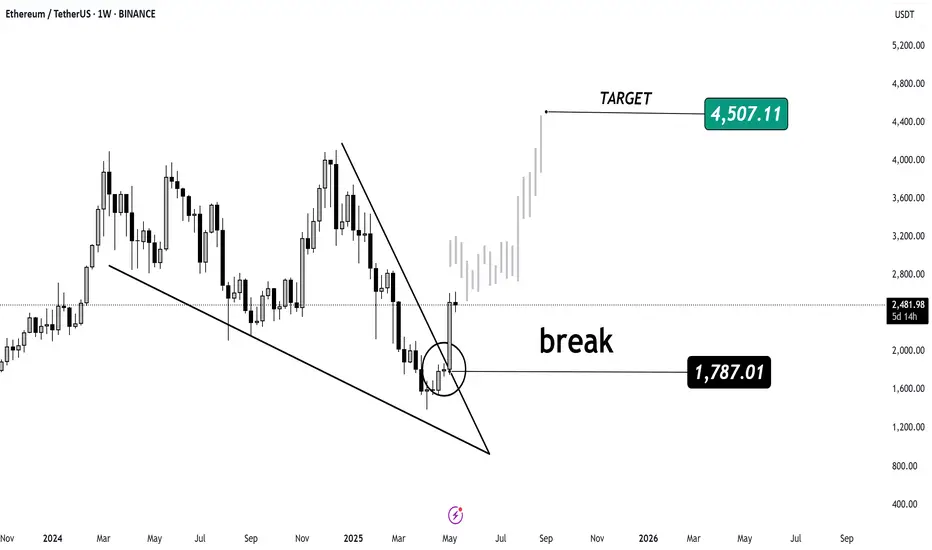
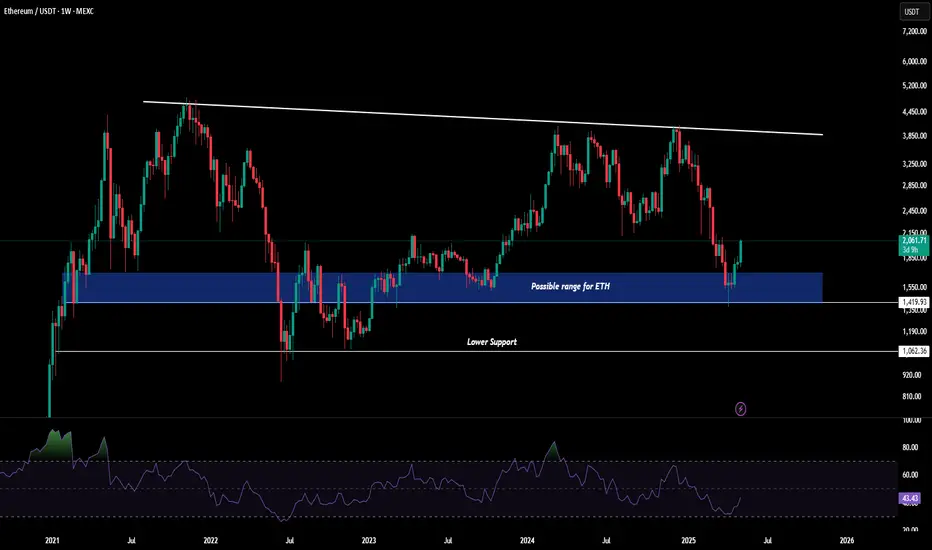
Ethereum (ETH) Weekly Technical Analysis
Ethereum has broken a significant long-term downtrend, confirming bullish momentum. With the $1,787 zone acting as new support, the path is open toward $4,500+ in the coming months if bullish sentiment sustains.
🎯 Target Projection: $4,507.11
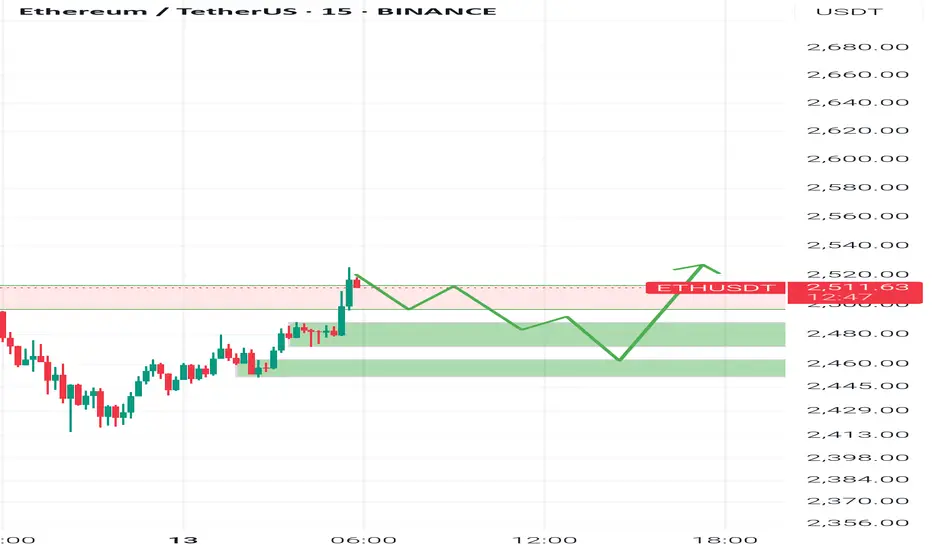
possible target estimationPrice at the moment looks more bullish.
we should consider we are moving into downtrend channel in a bigger time charts yet.
so if the price could hold the base area at my chart has big chance to break out that channel.
at this scenario the closest target is around 2100$ for short term.
if price could manage to break up the channel we could consider our main trend changed to
bull trend.
Enjoy the market
ETH | HTF POV
HTF BREAKDOWN :
- One of the key Regions that has my interest and most
likely chance to get filled over the next couple of months,
- Conflunce : Monthly inversion + Internal Range liquidity
which did act as Magnet zone to fill before continuation
to the Upside,
- Close Daily Candle above this region and we
can see price having a monetum influx towards
the upside targetting Previous Range highs Resting
@ 4871ish

ETH/usdtreclaimed area it can help you for your knowlege how to get enter in market for to make your trading for short time period and earn profit
ETH/USDT what next ? possiblity ? probabilieslets find how to enter in market where are the reclaimed area it can help to to getting in to market with shortterm and profitable entries now advises just for knowledge

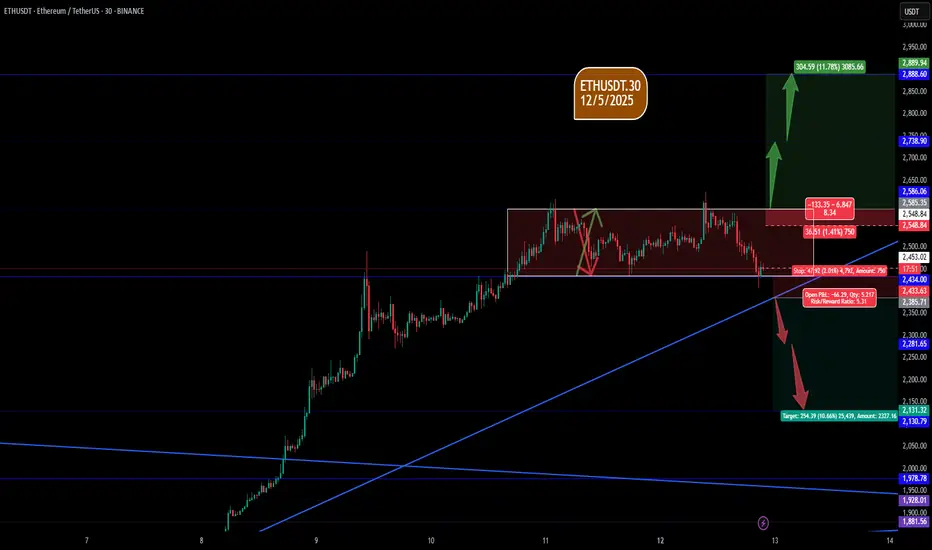
eth/usdt.30mEthereum analysis on the half-hour timeframe
The analysis relies on trend analysis and support and resistance.
We have three scenarios with conditions.
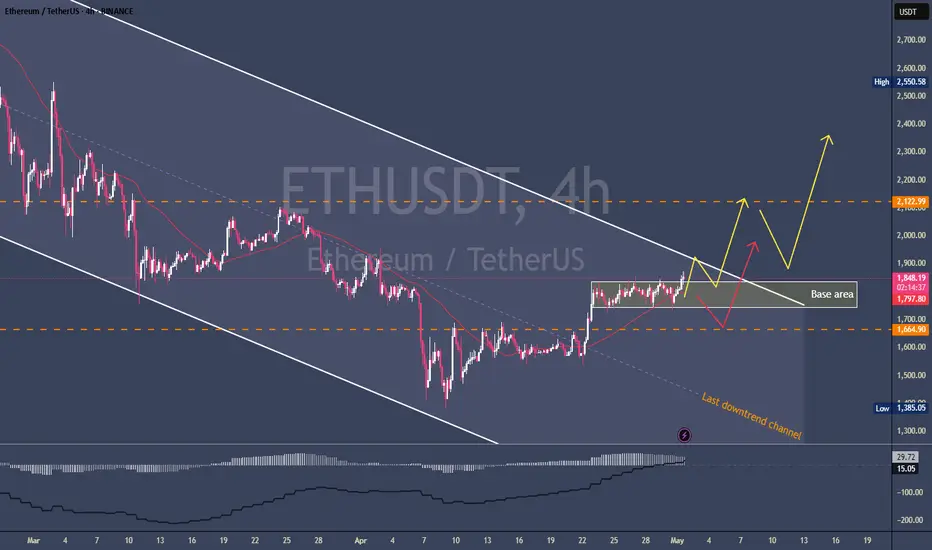
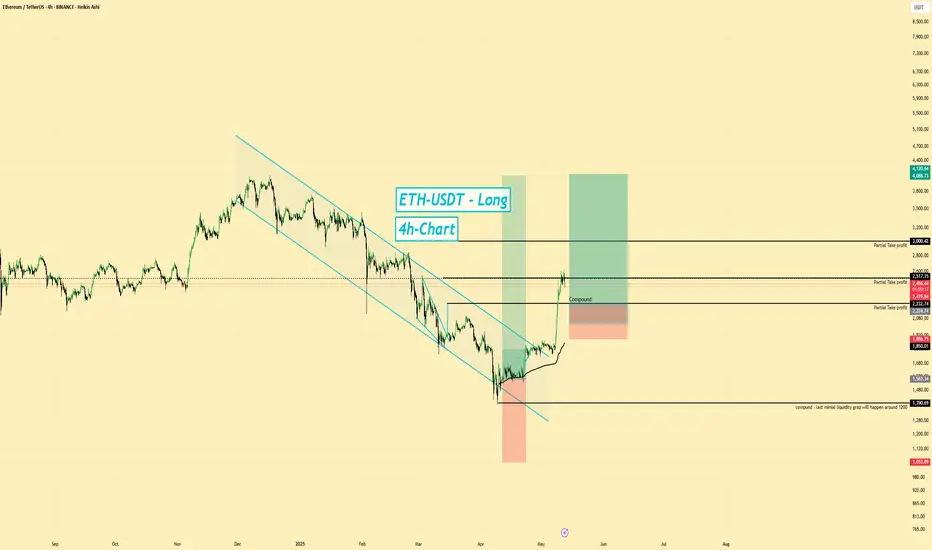
ETHUSDT | Long Bias | Reversal Building on Weekly | (May 12, 20ETHUSDT | Long Bias | Reversal Building on Weekly + 4H Confluence | (May 12, 2025)
1️⃣ Short Insight Summary:
Ethereum has been climbing out of a long downtrend, with the weekly chart showing a strong shift from downside pressure to upside momentum. We're now watching a key area for re-entry and potential compounding long positions.
2️⃣ Trade Parameters:
Bias: Long
Entry Zone: $2,232–$2,224
Stop Loss: Below $1,800 (combined risk zone)
TP1: $2,500
TP2: $3,000
Final TP (Optional): $5,000+ if momentum continues
Partial Exits: Recommended at each take-profit level, especially around round numbers and prior highs
3️⃣ Key Notes:
✅ Weekly chart structure shows a macro reversal from $1.5K toward the EUROTLX:4K region—potential for large moves.
✅ On the 4H timeframe, the $2,232 area is showing confluence as a strong re-entry zone.
✅ Already taken two partial profits from earlier longs; now looking to re-enter or compound on pullback.
✅ This area could be a "crazy long" zone if confirmed by price action—watch for bullish reactions or strong volume spikes.
❌ Be cautious and wait for confirmation—don’t blindly long into weakness.
4️⃣ Optional Follow-up Note:
Will continue monitoring this zone and provide updates if the structure strengthens or invalidates.
Please LIKE 👍, FOLLOW ✅, SHARE 🙌 and COMMENT ✍ if you enjoy this idea! Also share your ideas and charts in the comments section below! This is best way to keep it relevant, support us, keep the content here free and allow the idea to reach as many people as possible.
Disclaimer: This is not financial advice. Always conduct your own research. This content may include enhancements made using AI.
ETH: A Perfect Rebound!ETH Update:
As analyzed in our previous update, ETH has shown a promising rebound from support. It made an impressive move from $1,400 to the current market price of $2,000, marking an outstanding 45% rally.
With the RSI gradually gaining bullish momentum, ETH looks strong and could potentially rally back to the $3,000–$3,500 range.
Regards,
Dexter
Ethereum (ETH): Almost Reached Major Target | $2,700-2,900Ethereum has made an amazing move since the breakout from our buy entry zone. We are almost there, at our major target zone, which is near the upper resistance zone, where we are expecting to see some sort of smaller rejection and correction, which would reset the RSI into sideways movement.
Swallow Academy

ETHUSDT above green trendline wait for retest and then 3500$As we can see our first target hit which was 2300$ and the pump started from our daily support of 1400$ now we can expect range here for a while or short-term correction to retest the green trendline and this trendline would be once again major support and will pump price to the targets like 3000$.
Also market is bullish and more pump and rise is also possible without any range.
DISCLAIMER: ((trade based on your own decision))
<<press like👍 if you enjoy💚

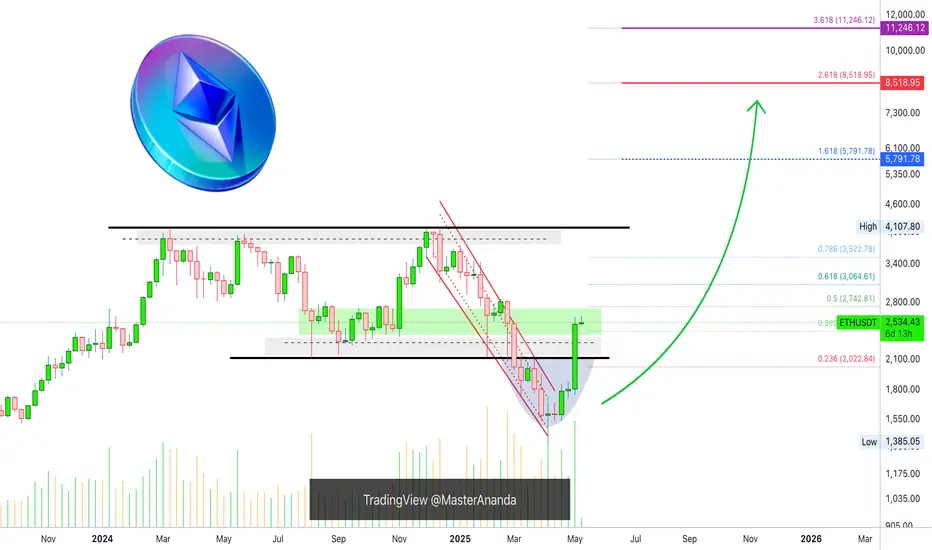
$5,792 Is The Easy Target, Ethereum At $8,519-$11,246 In 2025Ethereum's All-Time High happened November 2021 and sits around $4,868. While Bitcoin went to produce several new All-Time Highs in 2024 and 2025, Ethereum peaked with a triple-top around $4,100. Everything is about to change.
Ethereum (ETHUSDT) is now on its four consecutive green week with rising—high—volume. The next main target within the current bullish wave sits at $5,792, this is an easy target.
Ethereum did not hit a new ATH in 2024 but it is about to make a comeback with a vengeance. Ethereum will grow so strongly that many people will just not be able to understand what is actually happening, the signals are in.
Between March and May we have a classic stop-loss hunt event. It all started in February 2025 when ETHUSDT tested its August 2024 low and support. This level was tested twice and finally broke. The breakdown produced a classic rounded bottom and now the action is back in the bullish zone.
It is as if nothing really happened, a strong market shakeout. A long-term trader could have easily be on vacation while this event took place. When coming back, he would notice on 12-May the prices being in the same buy zone as in August-November 2024. Knowing that this buy zone led to a bullish impulse, which ended with a rejection and triple-top, he would know that the market was gathering strength before another challenge of resistance. This resistance around $4,100 will break easily this time on the way up.
Since ~$5,800 is an easy target, we can expect even higher prices in the coming months, specially the later part of 2025 when the bull market bull run will be in full force. $8,500 is possible and even higher with a blow-off top reaching $11,000 or $13,000 to end the bull market phase.
This is how things are looking now. We will adapt accordingly if market conditions change.
How far up Ethereum can go is anybody's guess, what cannot be doubted is the fact that it is going up; Crypto is going up; Bitcoin is going up more than 100%.
Thank you for reading.
Namaste.