Ethereum (ETH): Waiting For Dominance By Buyers At $1,900Ethereum has formed a proper foundation from where we might see a good upward movement coming pretty soon; all we need is just to secure the $1,900, which then might send the price towards our target zones.
There is nothing much to talk about rather than waiting for the resistance zone and once we see that buyers will overtake that zone we are going to look for long positions here!
Swallow Academy
ETHUSDT.3S trade ideas

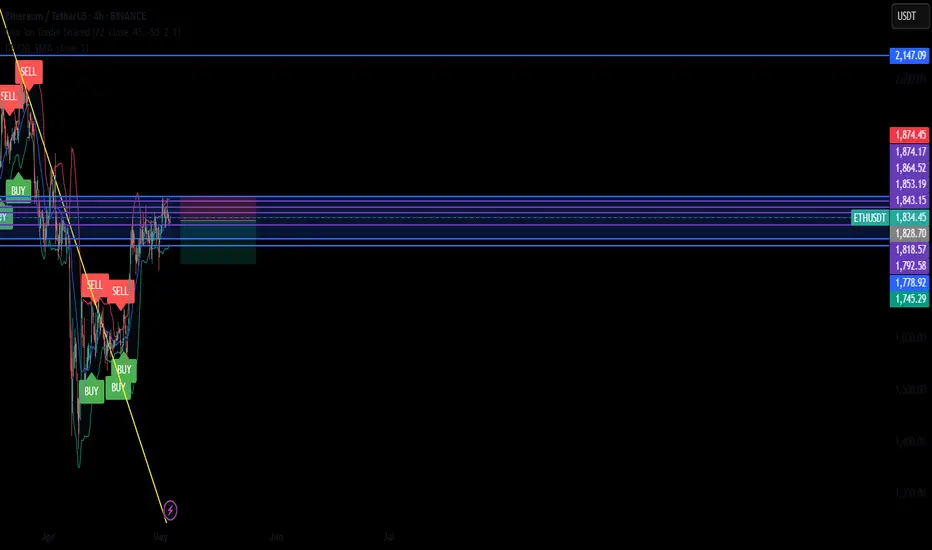
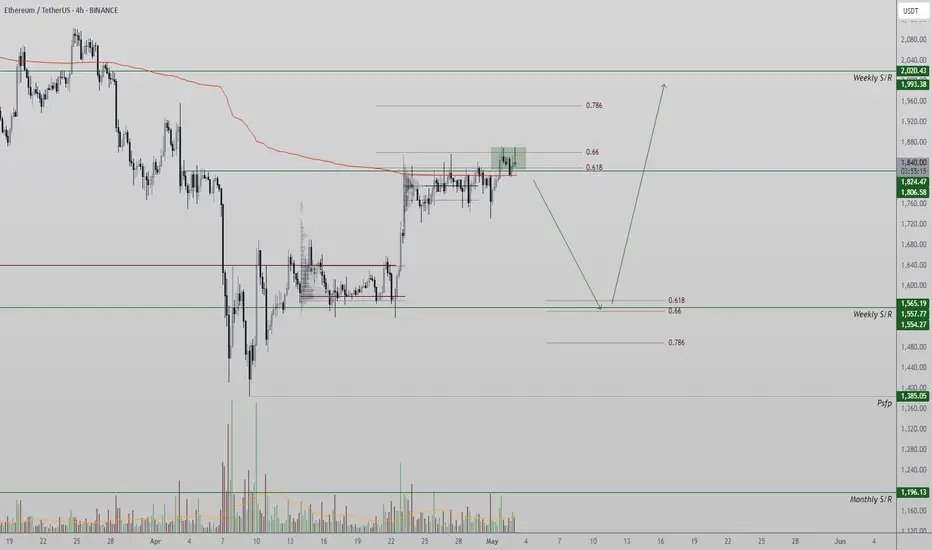
possible short entry reversal point!Levels to keep an eye on for BOS for a high possibility short entry. In order to reach the higher levels a ABC structure is vital. looking for trendline break for confirmation.

Breakout trading point: 1861.57
Hello, traders.
If you "Follow", you can always get new information quickly.
Please click "Boost" as well.
Have a nice day today.
-------------------------------------
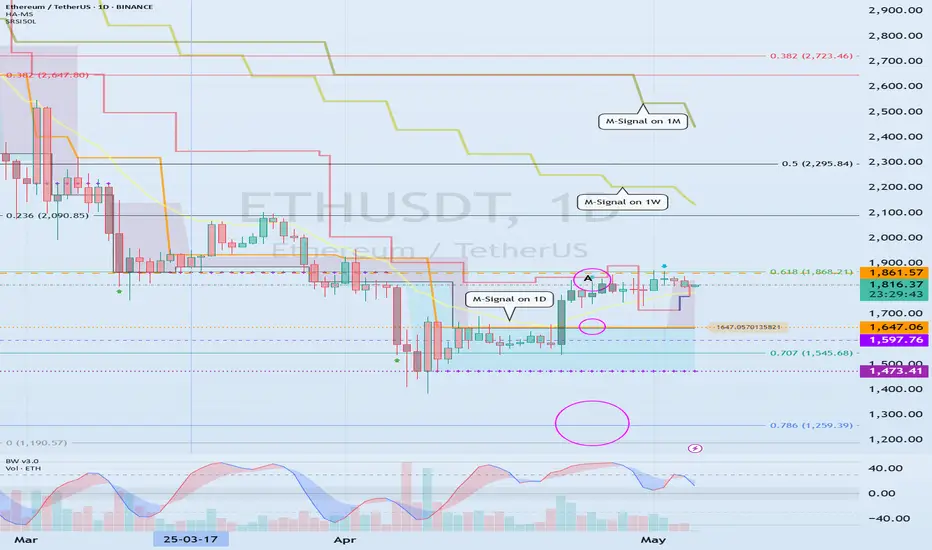
(ETHUSDT 1D chart)
The 1861.57 point is the HA-Low indicator point on the 1W chart.
The key is whether it can receive support and rise around the A section, that is, 1861.57.
Since the HA-Low indicator on the 1D chart is formed at the 1647.06 point, it is important whether it can receive support and rise in the 1647.06-1861.57 section.
If it shows support in the 1647.06-1861.57 section, it is a time to buy.
-
If it falls from 1647.06, there is a possibility that a stepwise downtrend will continue, so you should also consider a response plan for this.
In the case of a decline, the Fibonacci ratio section of 0 (1190.57) ~ 0.786 (1259.39) is expected to be an important support and resistance section.
-
Since the price is located below the M-Signal indicator on the 1M chart, it is recommended to conduct trading from a day trading or short-term trading perspective.
When it breaks through the 1861.57 point, a breakout trade is possible, but as I mentioned earlier, trading requires a short and quick response.
-
If the StochRSI indicator is above the midpoint, it is recommended to focus on finding a time to sell, and if it is below the midpoint, it is recommended to focus on finding a time to buy.
When creating a trading strategy by referring to the movement of these auxiliary indicators, you must check whether there is support at the support and resistance points drawn on the 1M, 1W, and 1D charts.
-
Thank you for reading to the end.
I hope you have a successful trade.
--------------------------------------------------
- Here is an explanation of the big picture.
I used TradingView's INDEX chart to check the entire range of BTC.
I rewrote the previous chart to update it while touching the Fibonacci ratio range of 1.902 (101875.70) ~ 2 (106275.10).
(Previous BTCUSD 12M chart)
Looking at the big picture, it seems to have been maintaining an upward trend following a pattern since 2015.
In other words, it is a pattern that maintains a 3-year bull market and faces a 1-year bear market.
Accordingly, the upward trend is expected to continue until 2025.
-
(Current BTCUSD 12M chart)
Based on the currently written Fibonacci ratio, it is displayed up to 3.618 (178910.15).
It is expected that it will not fall again below the Fibonacci ratio of 0.618 (44234.54).
(BTCUSDT 12M chart)
Based on the BTCUSDT chart, I think it is around 42283.58.
-
I will explain it again with the BTCUSD chart.
The Fibonacci ratio ranges marked in the green boxes, 1.902 (101875.70) ~ 2 (106275.10) and 3 (151166.97) ~ 3.14 (157451.83), are expected to be important support and resistance ranges.
In other words, it seems likely that they will act as volume profile ranges.
Therefore, in order to break through these ranges upward, I think the point to watch is whether they can receive support and rise near the Fibonacci ratios of 1.618 (89126.41) and 2.618 (134018.28).
Therefore, the maximum rising range in 2025 is expected to be the 3 (151166.97) ~ 3.14 (157451.83) range.
In order to do that, we need to see if it is supported and rises near 2.618 (134018.28).
If it falls after the bull market in 2025, we don't know how far it will fall, but based on the previous decline, we expect it to fall by about -60% to -70%.
Therefore, if it starts to fall near the Fibonacci ratio 3.14 (157451.83), it seems likely that it will fall to around Fibonacci 0.618 (44234.54).
I will explain more details when the bear market starts.
------------------------------------------------------
Ethereum: Sell Or Hold? Panic Buy, Panic Sell or Panic Hold?If I were you in this situation, what would you do?
What would you do if you were not you in this situation?
Ethereum hit bottom on the 9th of April and the bottom is confirmed based on the same candle. It ended full green and with really high volume.
The action moved back above support on 22-April when the 3-Feb. low resistance was conquered. Ethereum now trades within a tight price range.
This range's support has been tested four times and it holds, Ethereum now trades higher but what will happen next? What would you do if I were me?
Market conditions can change in a day. Two days green, two days red it is all sideways, nothing changes and nothing has changed.
If you are still wondering if you should panic sell or panic hold right now all you have to do is panic buy because Ethereum is going up.
Ignore the short-term nothing because this chart isn't showing even noise. It is the consolidation of the higher low before additional growth.
Ethereum's chart looks very different to Bitcoin, it is incredible. Ethereum is no longer "#2" but more like an Altcoin, Bitcoin has its own chart while Ethereum has the chart of a medium sized Cryptocurrency pair. This is good, it tells us that Ethereum is about to grow really strong and will produce a new All-Time High in 2025. This All-Time High will be higher than 2021 because while this isn't Bitcoin it is still a very strong chart. Expect lower no more, panic buy followed by panic hold while you rest easy and relaxed because there is no panic when the market grows.
The only panic right now is on the short side because the bottom is in and the bears are gone.
Rest easy, do not let go of your coins. Hold strong.
Never ever use a stop-loss. Think long-term and the market will bless you with amazing results.
Namaste.
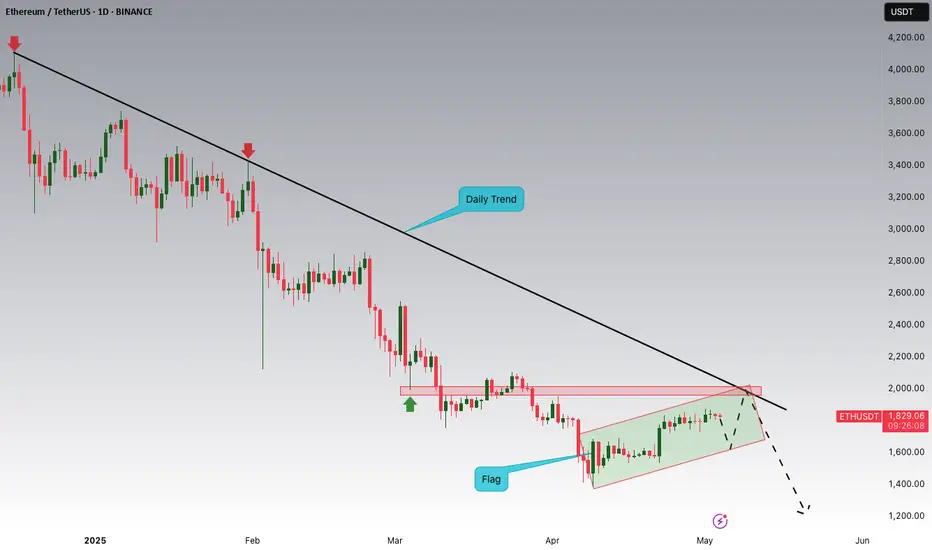
Ethereum is Nearing The Daily TrendHey Traders, in today's trading session we are monitoring ETH/USDT for a selling opportunity around 2,000 zone, Ethereum is trading a downtrend and currently is in a correction phase in which it is approaching the trend at 2,000 support and resistance area.
Trade safe, Joe.
ETH found a bottom at the 2018 All Time High IMO
#ETH RSI also hit the bottom levels🧐
As I said many times 'not accumulating CRYPTOCAP:ETH below $2k' is such a mistake❗️
#Ethereum still the bottom levels, now it's setting for the rally do not miss🚀
@VIPROSE

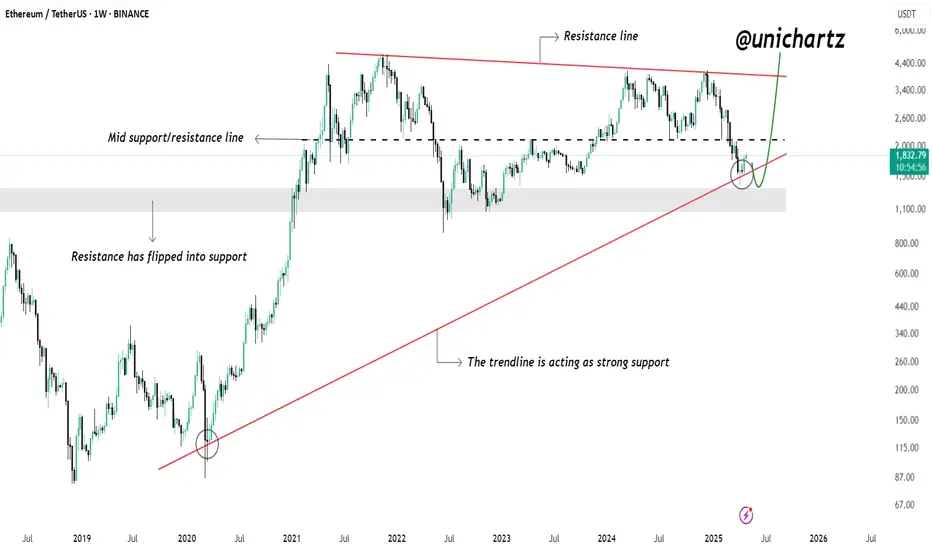
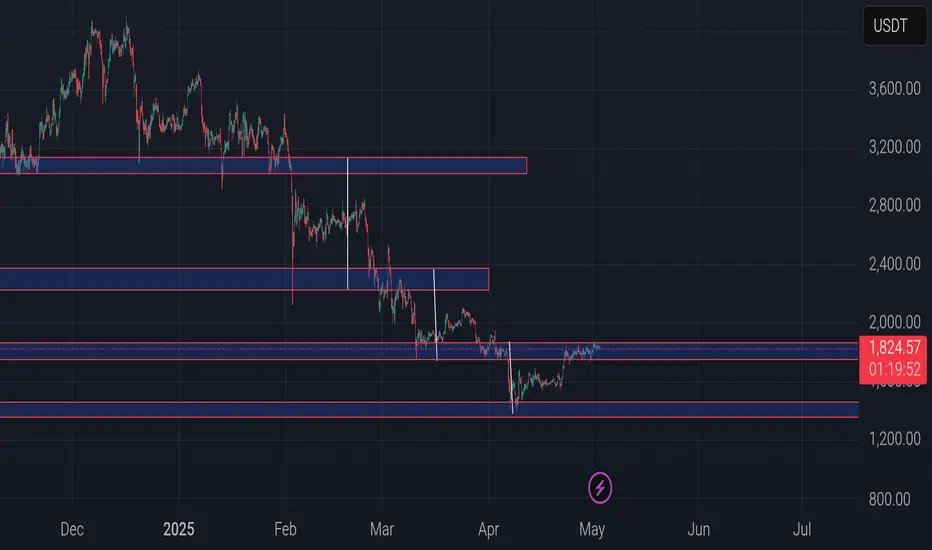
Ethereum Rebounds from Key Confluence Zone$ETH/USDT Weekly Chart Analysis
Ethereum is holding a major long-term uptrend as the price bounces off the ascending trendline support. This level also aligns with a strong historical resistance-turned-support zone, adding more confluence to the current bounce.
As long as ETH stays above this structure, it suggests a potential macro bullish continuation, with eyes on the upper resistance line near $3,200–$3,500.
A strong defense at this zone reinforces long-term bullish sentiment.
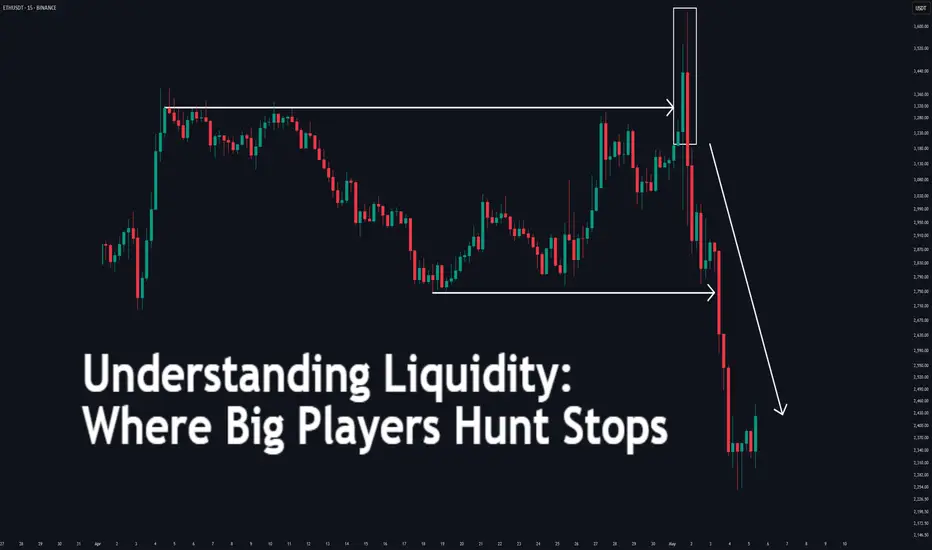
Understanding Liquidity: Where Big Players Hunt Stops
Understanding Liquidity: Where Big Players Hunt Stops
Ever wondered why price suddenly spikes through your stop-loss and reverses moments later? That’s not a coincidence—it’s liquidity at play. This article will teach you how liquidity zones work, why stop hunts happen, and how to avoid getting trapped like the crowd.
🔵 What Is Liquidity in Trading?
Liquidity refers to how easily an asset can be bought or sold without drastically affecting its price. But in practical trading, liquidity is more than just volume—it’s where traders *place* their money.
Large players—institutions, market makers, or big accounts—need liquidity to fill orders.
They target areas where many retail stop-losses or pending orders are stacked.
These areas are often just above resistance or below support—classic stop-loss zones.
To move large positions without slippage, smart money uses stop hunts to trigger retail orders and create the liquidity they need.
🔵 Where Do Liquidity Zones Form?
Liquidity often builds up in predictable areas:
Above resistance: Where shorts place stop-losses.
Below support: Where longs place stop-losses.
Swing highs/lows: Obvious turning points everyone sees.
Round numbers: e.g., 1000, 10,000, 50,000.
Breakout zones: Where breakout traders place entries or stops.
These zones act like magnets. When price approaches them, it accelerates—seeking the liquidity pool behind the level.
🔵 What Is a Stop Hunt?
A stop hunt happens when price moves just far enough to trigger stop-losses before reversing. This isn’t market noise—it’s an intentional move by big players to:
Trigger a flood of stop orders (buy or sell).
Fill their own large positions using that liquidity.
Reverse price back to fair value or the prior trend.
Example: Price breaks above resistance → stops get hit → institutions sell into that liquidity → price drops sharply.
🔵 Signs You’re in a Liquidity Grab
Look for these clues:
Fast spike beyond key levels followed by rejection.
Wick-heavy candles near highs/lows.
Price touches a level, then sharply reverses.
High volume on failed breakouts or fakeouts.
These are signs of a liquidity event—not a real breakout.
🔵 How to Trade Around Liquidity Zones
You can use liquidity traps to your advantage instead of becoming their victim.
Avoid obvious stops: Don’t place stops directly below support or above resistance. Instead, use ATR-based or structure-based stops.
Wait for confirmation: Don’t chase breakouts. Let price break, reject, then re-enter inside the range.
Watch for wick rejections: If price quickly returns after a level is breached, it's often a trap.
Use higher timeframe confluence: Liquidity grabs are more powerful when they align with HTF reversals or zones.
🔵 Real Example: Liquidity Sweep Before Reversal
In this chart, we see a textbook liquidity grab:
Price breaks below support.
Longs get stopped out.
Candle prints a long wick.
Market reverses into an uptrend.
This is where smart traders enter— after the trap is set, not during.
🔵 Final Thoughts
Liquidity is the invisible hand of the market. Stop hunts aren’t personal—they’re structural. Big players simply go where the orders are. As retail traders, the best thing we can do is:
Understand where traps are set.
Avoid being part of the crowd.
Trade the reaction, not the initial breakout.
By thinking like the smart money, you can stop getting hunted—and start hunting for better trades.
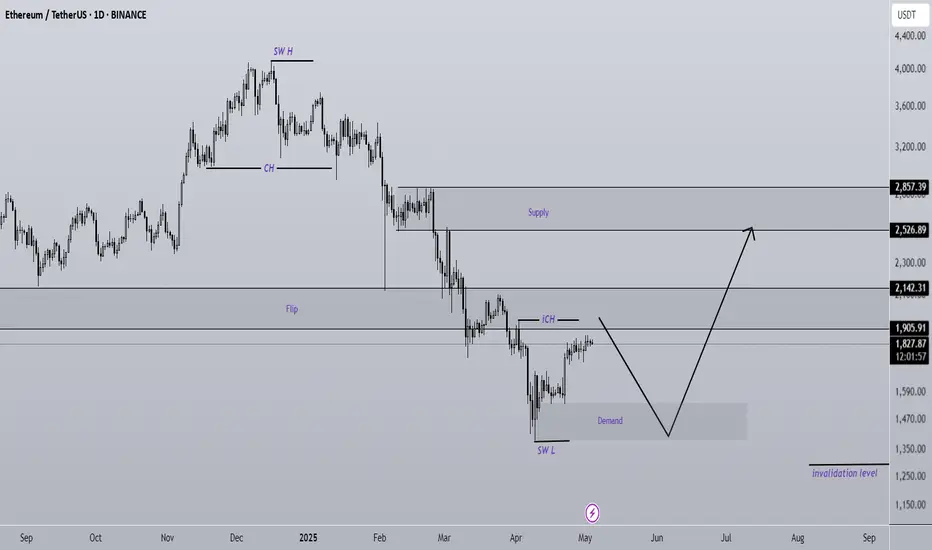
ETHEREUM New Update (1D)Price has approached a supply (flip) zone. It is not expected to break this zone on the first attempt, and bears are likely to regain control for now.
If Ethereum returns once again to the lower zones marked on the chart, it could present a low-risk opportunity for buy/long positions.
The main target can be the upper supply zone.
A daily candle closing below the invalidation level would invalidate this analysis.
Do not enter the position without capital management and stop setting
Comment if you have any questions
thank you
#ETH/USDT#ETH
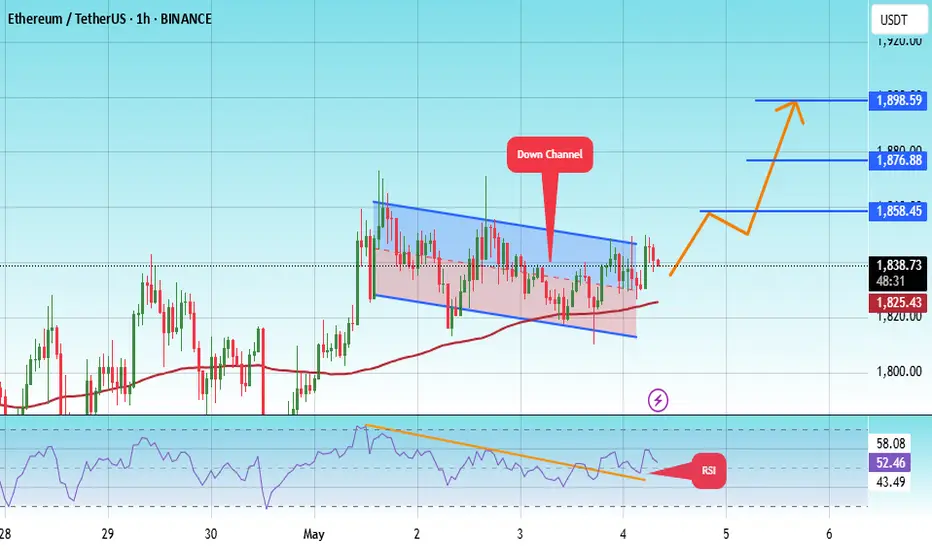
The price is moving within a descending channel on the 1-hour frame, adhering well to it, and is heading for a strong breakout and retest.
We are seeing a rebound from the lower boundary of the descending channel, which is support at 1815.
We have a downtrend on the RSI indicator that is about to be broken and retested, supporting the upward trend.
We are looking for stability above the 100 Moving Average.
Entry price: 1840
First target: 1860
Second target: 1876
Third target: 1890
ETH - Consolidating before a major breakout!About a week ago, Ethereum (ETH) saw a strong upward move, pushing the price up with notable momentum. Since then, it has entered a period of consolidation, trading within a tight range as the market awaits the next decisive move.
-------------------------------
Which Direction Will ETH Break?
After such a strong rally, this kind of consolidation is normal. It could signal a continuation to the upside, especially if this is part of a broader relief rally. However, it's important to note that during the rapid move up, ETH left behind a 4h Fair Value Gap (FVG), which may attract price back down for a potential fill in the event of a breakdown.
-------------------------------
Stochastic RSI insight
On the daily chart, the Stochastic RSI remains in the overbought zone. Historically, when this indicator lingers in such territory, ETH has seen notable pullbacks. This could be an early sign that a downward move is more likely unless momentum changes soon.
-------------------------------
ETH vs. the 50-Day Moving Average
ETH is currently struggling with the 50-day Moving Average (MA), trading just below this key resistance level. As long as ETH remains under the 50-day MA, bearish pressure could continue. However, a reclaim and sustained hold above this level would likely indicate a shift toward bullish momentum.
-------------------------------
My Outlook
This range is tricky to trade, and a breakout in either direction is possible. Personally, I think there's a chance ETH could sweep the recent highs before a larger move down. The overbought Stochastic RSI and resistance at the 50-day MA both suggest that the rally might be losing steam in the short term.
-------------------------------
Thanks for your support.
- Make sure to follow me so you don't miss out on the next analysis!
- Drop a like and leave a comment!

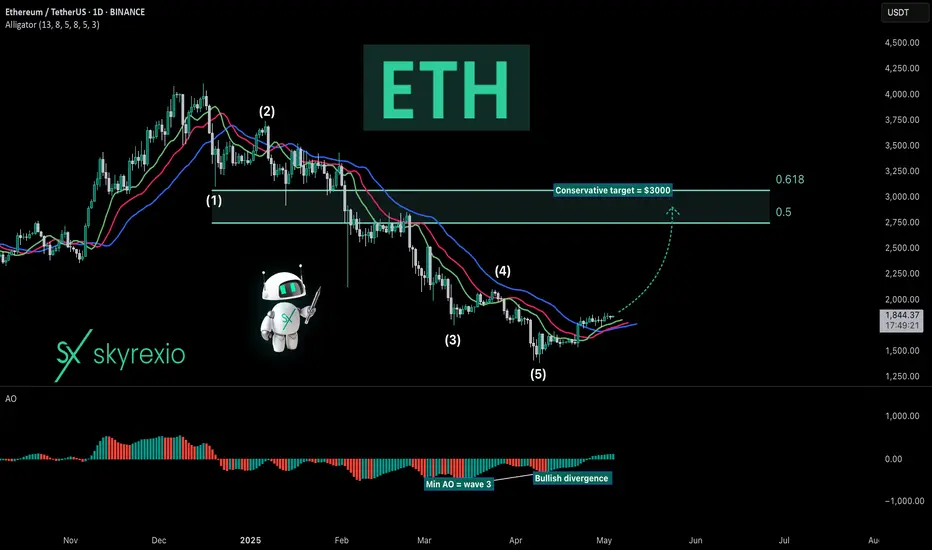
Ethereum ETH Is Gaining Strength Agains BitcoinHello, Skyrexians!
BINANCE:ETHUSDT was a huge underdog last 4 month on the bearish phase, but recently it started to gain power, on the recent dump it has not showed correction.
On the daily chart we can see that price has printed 5 waves Elliott cycle. Wave 3 corresponds to the minimum Awesome oscillator. After that wave 5 has finished this cycle with divergence. The conservative bounce target is $3000 at 0.61 Fibonacci level, but we have one problem here. AO did not crossed zero line at wave 4, so we can be in wave 4 only now, in this case another one lower low will happen. We need to count sub waves every day. Wait for our updates.
Best regards,
Ivan Skyrexio
___________________________________________________________
Please, boost this article and subscribe our page if you like analysis!
[LONG] ETHUSDT | ETG Going Up Follow BTC?Welcome,
- Status: 📈 Long
- TP & SL On Chart
Keep wait..
Lets see..
ETHUSD | Bullish breakoutprice has been trading in a bullish flag near resistance at 1,875 which has failed to take price lower on the bearish daily trend. If price breaks out of the flag, we may be looking for targets to 1950 and 2000.
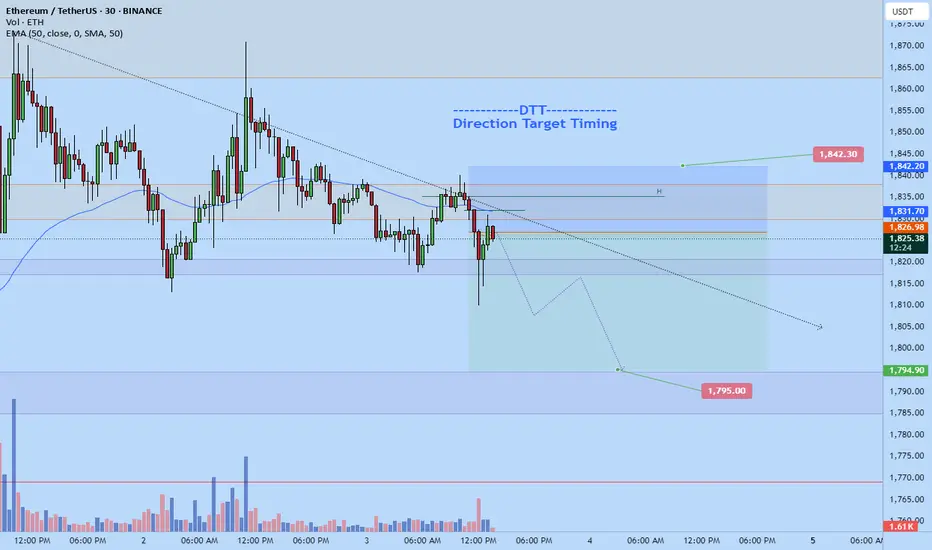
Eth to dump back down to 1795Eth short . target $1795 . Not the best setup but still seems quite probable.
Stop: $1842.2
Target: $1795.00 full exit
Long trade
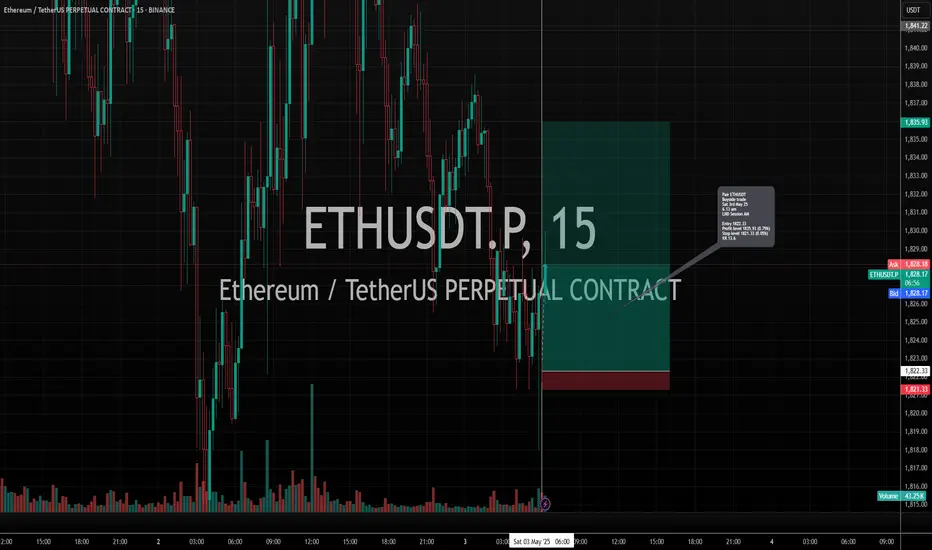
1hr TF overview
🗓 Date: Saturday, 3rd May 2025
⏰ Time: 9:00 AM
📍 Session: London to New York Overlap (AM)
🪙 Pair: ETH/USDT
📈 Direction: Long (Buy Side)
🔹 Entry Details:
Entry Price: 1830.68
Take Profit: 1838.70 (+0.44%)
Stop Loss: 1830.28 (−0.02%)
Risk-Reward Ratio: 20.05
🔹 Trade Context:
Entered during the London–New York session crossover, a time known for high volatility and volume.

Long trade
1min TF entry
🗓 Date: Saturday, 3rd May 2025
⏰ Time: 6:13 AM
📍 Session: London AM
🪙 Pair: ETH/USDT
📈 Direction: Long (Buy Side)
🔹 Entry Details:
Entry Price: 1822.33
Take Profit: 1835.93 (+0.75%)
Stop Loss: 1821.33 (−0.05%)
Risk-Reward Ratio: 13.6
Trade Context:
Executed on the London session open, and I assume a high-probability window for momentum.
Price surged following a liquidity sweep and volume spike.
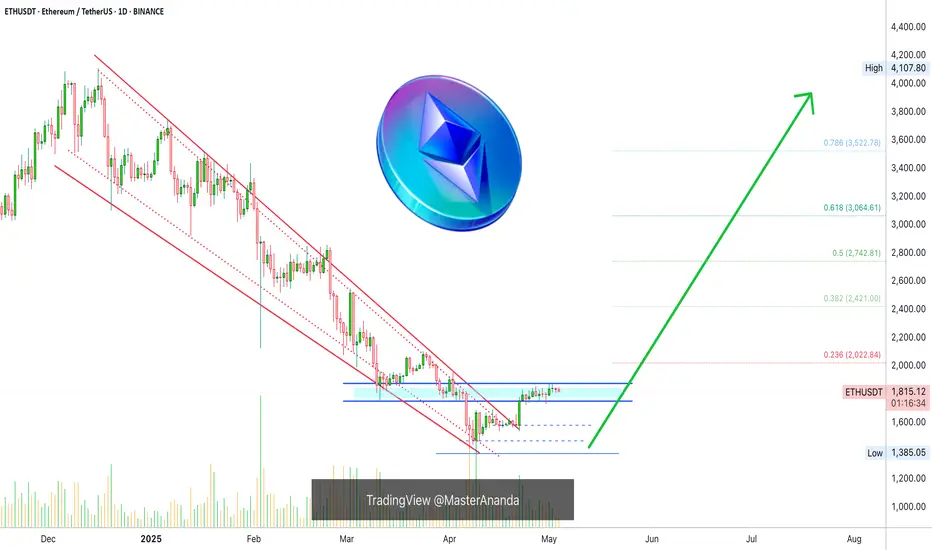
Did you succeed in climbing Ethereum?Ethereum announced its 3200 decline and went until 1350! lol to lol
Now it's time back
1850/1900 is the resistance that can be rejected and maintained, it is easy to cross and maintain its 2200 and 3000 targets for the next 3 months.
Unless the downward trend is so that we don't get better, it's still early.
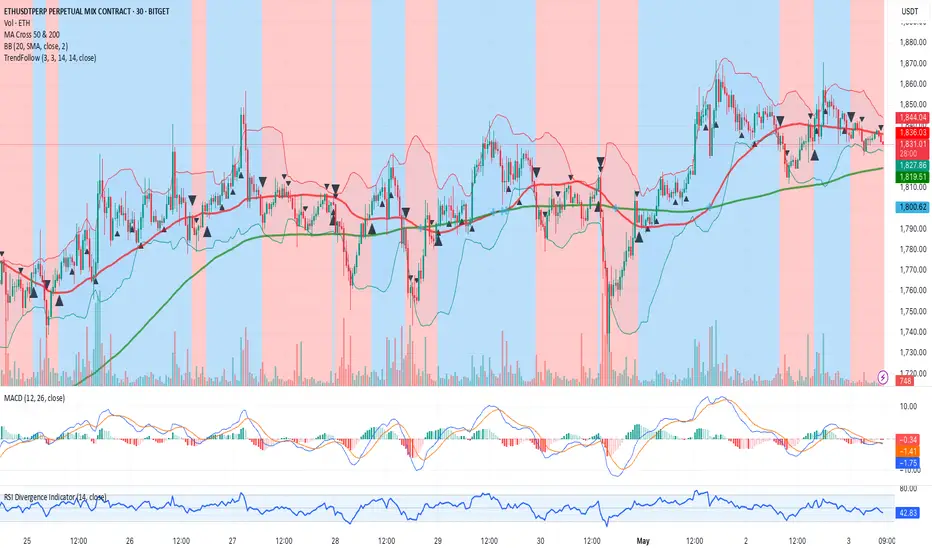
Ethereum (ETH/USDT) Trading Analysis: Bullish Momentum AheadEthereum (ETH/USDT) Trading Analysis: Bullish Momentum Ahead
1. Trend Overview
ETH/USDT is displaying a strong bullish trend, with recent upward price action marked by consecutive green candlesticks. The current price of 1,833.02 USDT reinforces bullish momentum, suggesting sustained buying pressure.
2. Key Levels
Support: The 200-period moving average (green line) acts as dynamic support, offering a potential entry point on pullbacks.
Resistance: Immediate resistance lies near recent highs. A breakout above this zone could trigger further upside. Bollinger Bands highlight volatility, with the upper band signaling potential resistance.
3. Technical Indicators
MACD: Bullish momentum is confirmed, with the MACD histogram in positive territory.
RSI: At 45, the RSI indicates neutral conditions—no overbought or oversold signals—leaving room for upward movement.
4. Trade Setup
Entry: Enter long at 1,840 USDT (above current price) to confirm trend continuation.
Stop-Loss: Set at 1,800 USDT (below the 200 MA) to limit downside risk.
Take-Profit: Target 1,900 USDT (short-term) and 2,000 USDT (mid-term)**—a 3-9% return potential.
Final Summary
Asset: ETH/USDT
Bias: Strong Buy
Entry: 1,840 USDT
Stop-Loss: 1,800 USDT
Take-Profit: 1,900 / 2,000 USDT
Confidence: High
Pro Tips:
Monitor Bollinger Band width for volatility shifts.
Watch for reversal patterns (e.g., bearish engulfing candles) near resistance.
Why This Matters: Ethereum’s bullish structure, backed by technical confirmation, offers a high-probability trade. With clear risk-reward parameters and untapped upside, this setup is ideal for trend followers.
Ready to capitalize? Let me know if you need real-time updates or adjustments! 🚀
Ethereum at Risk of Breakdown Below Key Fibonacci Support
Ethereum’s price action is showing notable weakness as it tests a crucial Fibonacci level. Currently sitting on the 0.618 retracement, ETH is at a make-or-break point.
A confirmed close below $1,825, the current 0.618 Fibonacci level, would likely signal a deviation and a potential breakdown in structure. This would increase the chances of price rotating down toward the next major support at $1,055, which also aligns with a deeper 0.618 retracement from a higher timeframe — a level of historical significance and potential buying interest.
However, this downside move has not yet been confirmed. As long as Ethereum holds the current support, the structure remains intact. But if acceptance below this range occurs, especially with volume and momentum, it would likely initiate a broader corrective move.
Traders should remain patient and let the setup develop. A breakdown could present a high-probability buy-the-dip opportunity at lower support. Until then, caution is advised as price remains range-bound and vulnerable.
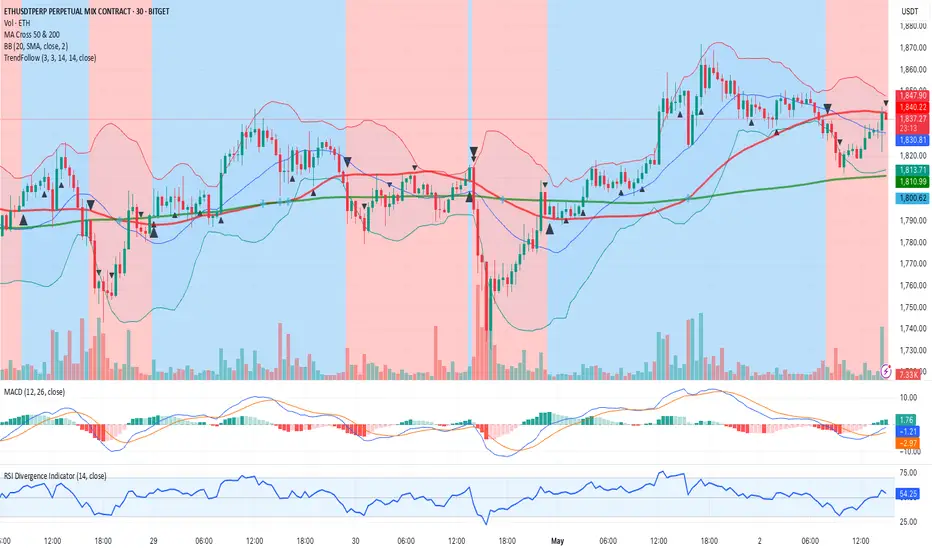
Complete Analysis and Unified Trading Signal for ETH/USDT Across
1. Main Trend:
30-Minute Chart: Shows a bullish trend with recent upward movements, indicating strong buying pressure.
1-Hour Chart: This timeframe also indicates a bullish trend, although it shows some signs of consolidation as the price oscillates near resistance levels.
4-Hour Chart: The longer timeframe reflects a slightly bullish trend but suggests potential exhaustion as price approaches key resistance.
2. Key Levels:
Support Levels:
1,800.00 USDT (strong historical support across all timeframes).
Resistance Levels:
1,841.31 USDT (near-term resistance visible in the 1-hour and 4-hour charts).
1,850.00 USDT (major resistance level to watch for breakout potential).
3. Technical Indicators:
MACD:
Positive divergence across timeframes suggesting bullish momentum, particularly strong on the 30-minute and 1-hour charts.
RSI:
30-Minute: Around 62 (indicating bullish momentum but nearing overbought).
1-Hour: Approximately 55, suggesting neutral to slight bullish sentiment.
4-Hour: Around 55.41, confirming that the market is not overbought yet.
Bollinger Bands:
Currently, price is near the upper band on the 30-minute chart, indicating potential overbought conditions but with room for further moves.
4. Risk/Opportunity:
Asset: ETH/USDT
Direction: Long
Entry: 1,835.00 USDT (entering at the current price level with bullish indicators).
Stop-loss: 1,800.00 USDT (setting the stop-loss just below the strong support to manage risk effectively).
Take-profit:
1,841.31 USDT (first target at resistance level).
1,850.00 USDT (second target if momentum continues upward).
Confidence: Medium (the bullish signals across multiple timeframes provide a reasonable basis for entering a long position, but caution is advised due to proximity to resistance levels).
5. Additional Notes:
Market Volatility: The analysis indicates that the ETH market is experiencing fluctuations, with notable spikes and retracements, suggesting traders should monitor for any rapid changes.
Conclusion: A careful approach is warranted, as the bullish sentiment may face challenges at key resistance levels. Traders should consider these dynamics when planning their trades.
This comprehensive evaluation synthesizes insights from multiple timeframes to provide a unified trading signal for ETH/USDT, assisting traders in making informed decisions based on current market conditions.

Analysis of the Financial Chart for ETH/USDT
1. Main Trend:
The primary trend of the chart indicates a bullish trend. The predominance of green candlesticks suggests that recent price movements have favored buyers. This is supported by the current price of 1,838.46 USDT, which is above the moving averages.
2. Key Levels:
Support: A significant support level is at 1,820.00 USDT, which could act as a barrier if the price were to decline.
Resistance: Resistance is observed at 1,850.00 USDT, and a breakout above this level could signal a continuation of the bullish trend.
Breakout/Breakdown: The highlighted areas in blue and red on the chart indicate periods of consolidation and volatility, suggesting potential trading opportunities at breakout points.
3. Technical Indicators:
MACD: The MACD bars indicate positive momentum, suggesting that the market currently has an upward push.
RSI: With a value of 60, the RSI shows that the market is near overbought territory but has not yet reached it, indicating there may still be room for further gains.
Moving Averages: The short-term moving average (blue line) is above the long-term moving average (green line), confirming the bullish trend.
4. Risk/Opportunity:
Asset: ETH/USDT
Direction: Long
Entry: 1,840.00 USDT (suggested as an entry point, ideally above the resistance level).
Stop-loss: 1,820.00 USDT (below support to protect against unfavorable movements).
Take-profit: 1,860.00 USDT (first profit target, aligned with the next resistance).
Confidence: Medium (given the current strength of the bullish trend and favorable technical indicators).
Additional Notes: Recent price movements show some volatility, so it is important to monitor trading signals closely. Any macroeconomic news or developments in the cryptocurrency market could further influence sentiment.
This analysis provides a clear view of the current situation for ETH/USDT, helping traders make informed decisions based on technical indicators and key price levels.