Ethereum (ETH): Time To See Proper Breakout | $3000 IncomingEthereum is still in a sideways channel on smaller timeframes, where we are looking for the price to reach the $2,834 area. Once there, we will be monitoring closely to see either the breakout from there or another rejection and smaller ride to lower zones.
Overall we are bullish on ETH; liquidity needs to flow here now.
Swallow Academy
ETHUSDT.3S trade ideas
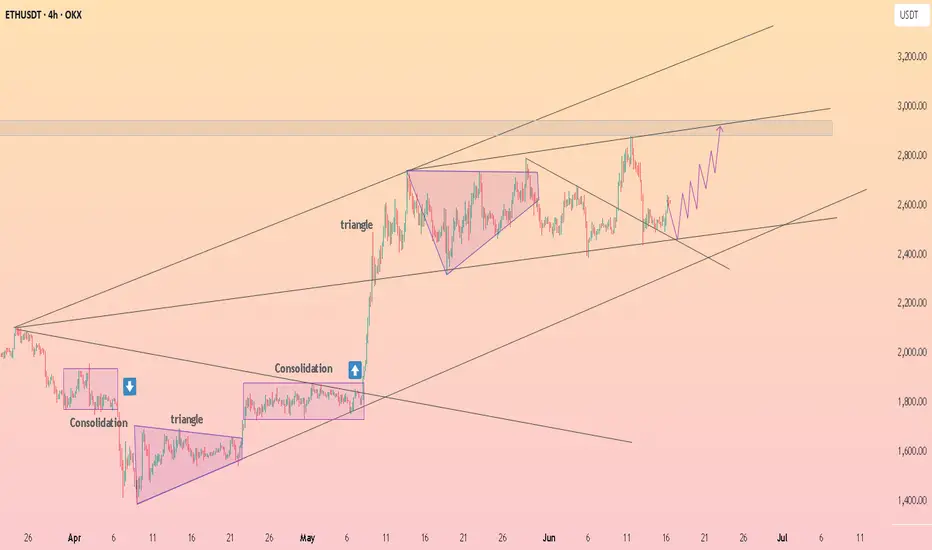
HolderStat┆ETHUSD continues to accumulateOKX:ETHUSDT is catching bids at the 2.50 k rail after triangle retest, converting shakeout into upside continuation. Staying above 2.40 k keeps bias north; clearing 2.75 k releases the 3 k target rocket 🚀
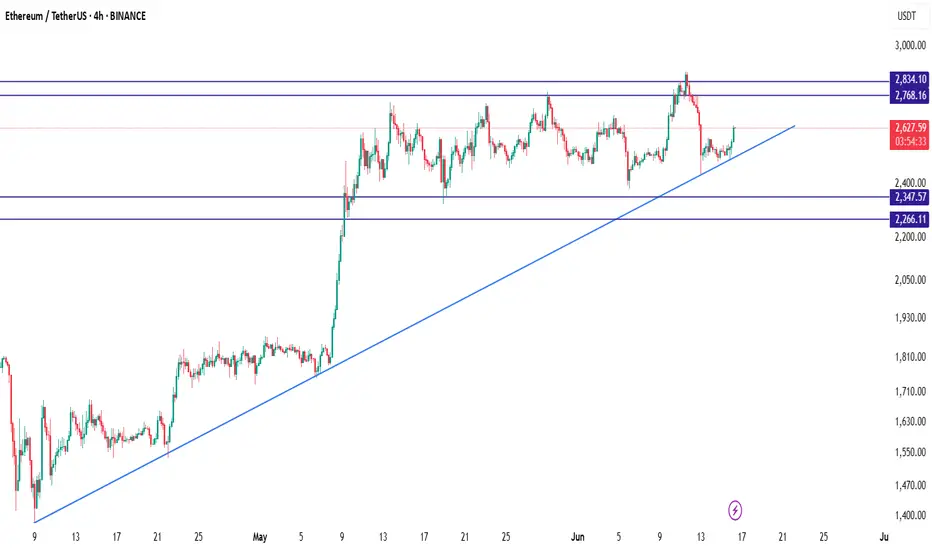
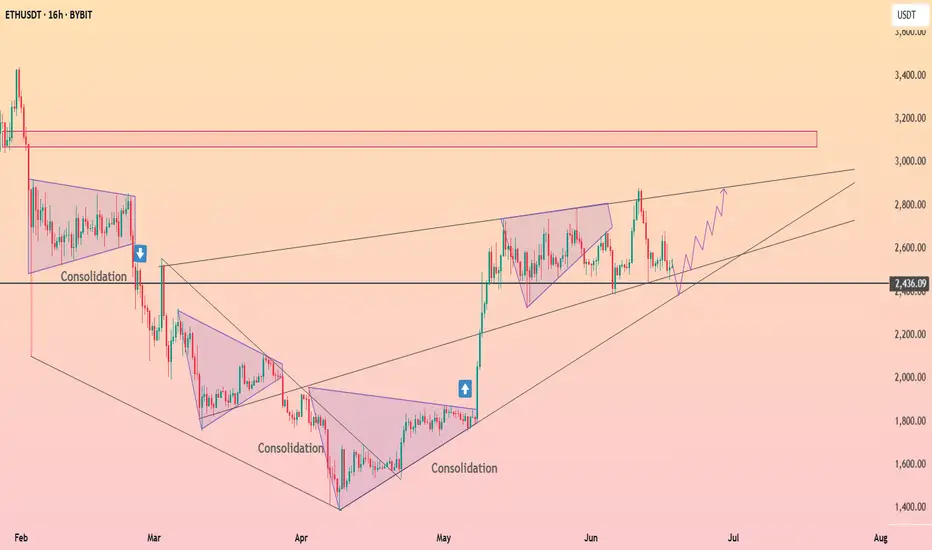
ETH/USDTEthereum (ETH/USDT) is currently maintaining its bullish momentum above a well-respected ascending trendline that has been active since early April. After a strong breakout above the 2347 level, the price entered a consolidation phase between 2600 and 2800, suggesting that the market is preparing for its next significant move. As of now, ETH is trading near 2627 and forming higher lows, which is a positive sign of buyer strength.
The key support zones are located at 2347 and 2266, while resistance levels to watch are 2768 and 2834. As long as the price holds above the ascending trendline, the bullish structure remains intact. A bounce from the current region, especially near the trendline, may present a favorable long opportunity. In such a scenario, a breakout above 2768 could open the path toward 2834 and potentially higher levels in the medium term.
A suitable long setup would involve entering around the 2620–2640 zone with a stop loss below 2347 to protect against trend invalidation. The first profit target can be set at 2768, and the second at 2834. However, traders should remain cautious: if ETH breaks below the trendline with strong bearish volume, the bullish outlook would weaken, and the price may revisit lower supports. Until then, the market structure favors buying the dips in alignment with the prevailing uptrend.
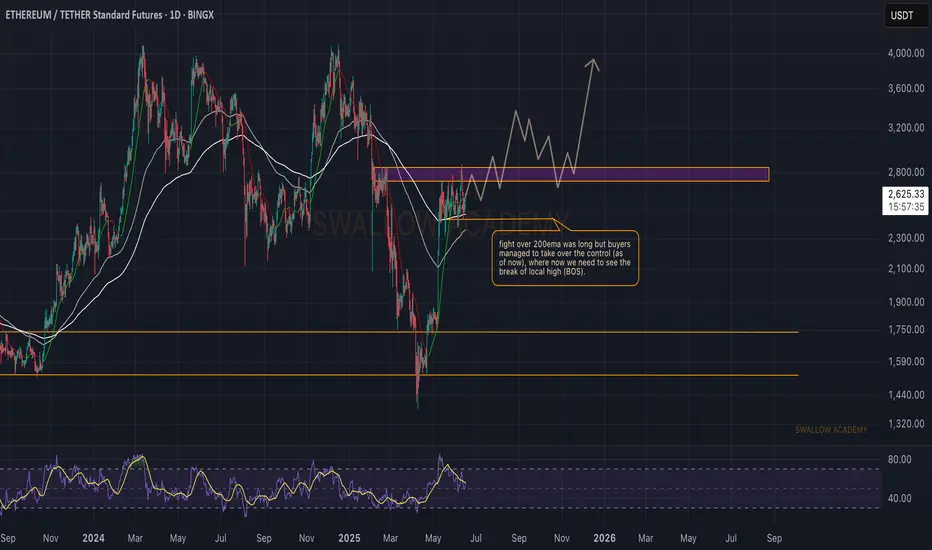
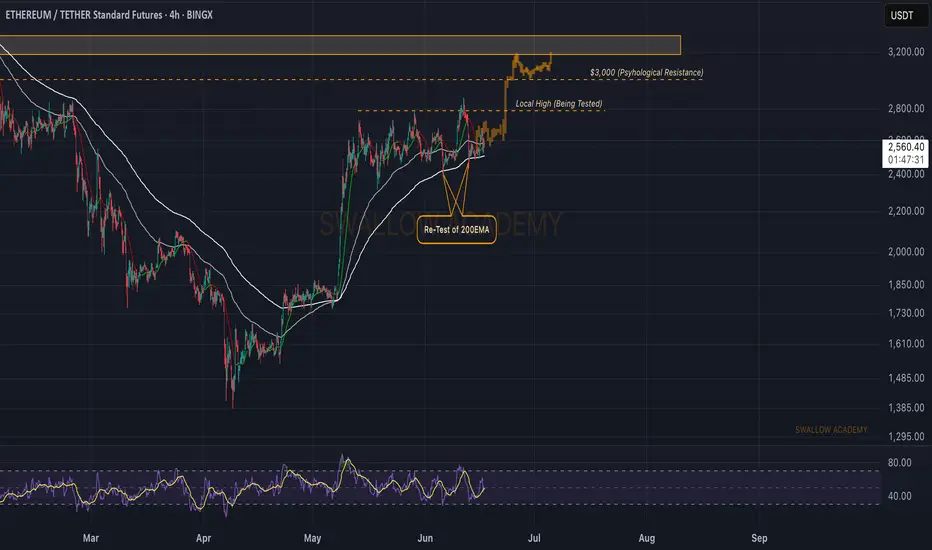
Ethereum (ETH): Stonger Than Bitcoin For SureEthereum is doing much better compared to Bitcoin, that's for sure, but it does not mean that ETH is not struggling.
We see the pressure that sellers are putting on, trying to regain the control over the 200EMA, which is a crucial area for us right now.
So while we keep our target at $3000 (first target), we also keep close attention to that moving average, where if we lose dominance, we might be heading to lows here...
Swallow Academy
Update on ETHTP hit quicker than expected.
LTF intraday is currently short. Targetting the area where the HTF is more likely than not kicking in for the next leg towards the upside!
Not financial advice.
Onwards!
CRYPTO:ETHUSD
CRYPTO:BTCUSD

ETH NEXT BUYZONE.ETH has created a wick and below that is a huge liquidity cluster. I want price to fill that liquidity cluster and then upside.
Weekly trading plan for ETH In this idea I marked the important levels for this week and considered a few scenarios of price performance
Write a comment with your coins & hit the like button and I will make an analysis for you
The author's opinion may differ from yours,
Consider your risks.
Wish you successful trades ! mura

ETHEREUM ETHUSDT is on a demand floor ,awaiting buy liquidity ,it could seek liquidity before going long.
if buyers fail to hold strong on demand floor ,it will retest the descending trendline at 1300$ level.

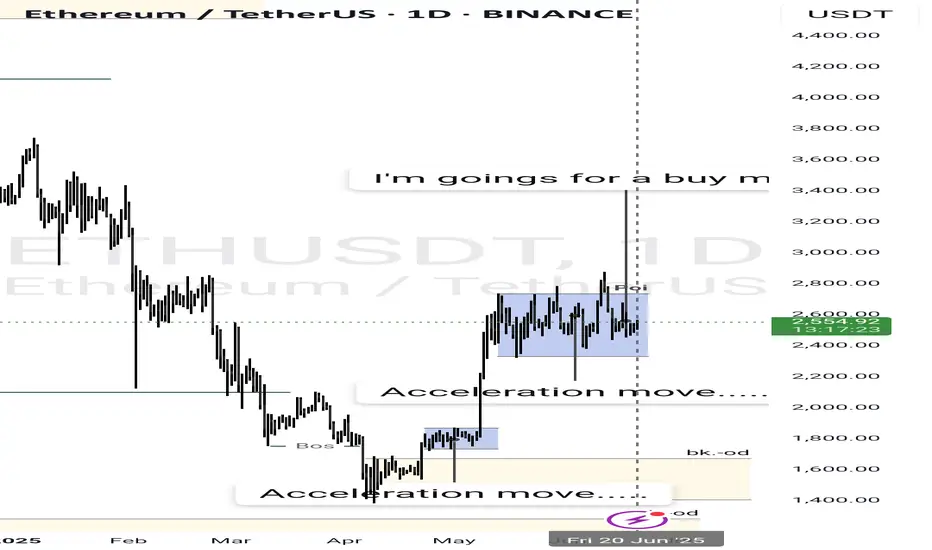
Waiting for a buy move in the btc Seeing all the acceleration move that is happening in the market
I believe is a buy
What do you think is the market movement......
ETH READY TO 3000$ ??? YES eth just about his support level eth can test from here 2450 than possible we can go 3k if iran or isreal war stop and at 18 june also here fomc meating where news about rate cut if not rate cut than possible market dump from here and btc or eth badly if rate cut done than also possible dump to liqudite longer for more deatile check bio
thanks for watching
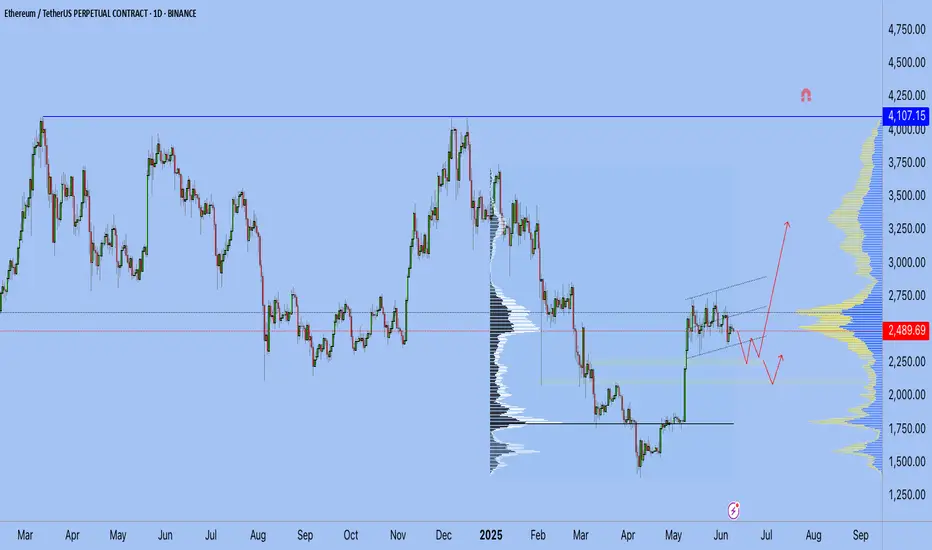
ETH update 9.06.2025Hello everyone, many of you asked me to publish my vision for ETH.
Here you go!
I believe that the previous impulse movement was only the first upward movement, and now we are in a sideways correction movement — call it what you will, but the fact is that the exit from this flat will be upward.
1. End of the year
2. ETH is accumulating on the Onchain
3. Liquidity overflow from BTC can be seen on the ETHBTC chart, and the overflow began at the very bottom
4. What else can large conservative players accumulate?
5. We are going after liquidity from above and should break 4100 by September
Best Regards EXCAVO
ETH Bullish Setup: Pullback to 200_SMA(D) May Launch Next Rally Ethereum ( BINANCE:ETHUSDT ) seems to have finally managed to break the Resistance lines and the 200_SMA(Daily) in the fifth attack . However, the number of Resistance lines inside the Heavy Resistance zone($2,929_$2,652) is high, and Ethereum will find it difficult to break through them.
In terms of Elliott Wave theory , it seems that Ethereum is completing microwave 4 , and we should wait for this wave to complete. Microwave 4 could act as a pullback to the resistance lines and 200_SMA(Daily) .
I expect Ethereum to start rising from the Support zone($2,745_$2,650) again and rise to at least the Potential Reversal Zone(PRZ) .
Note: If Ethereum touches $2,537 , we can expect further declines.
Please respect each other's ideas and express them politely if you agree or disagree.
Ethereum Analyze (ETHUSDT), 1-hour time frame.
Be sure to follow the updated ideas.
Do not forget to put a Stop loss for your positions (For every position you want to open).
Please follow your strategy and updates; this is just my Idea, and I will gladly see your ideas in this post.
Please do not forget the ✅' like '✅ button 🙏😊 & Share it with your friends; thanks, and Trade safe.

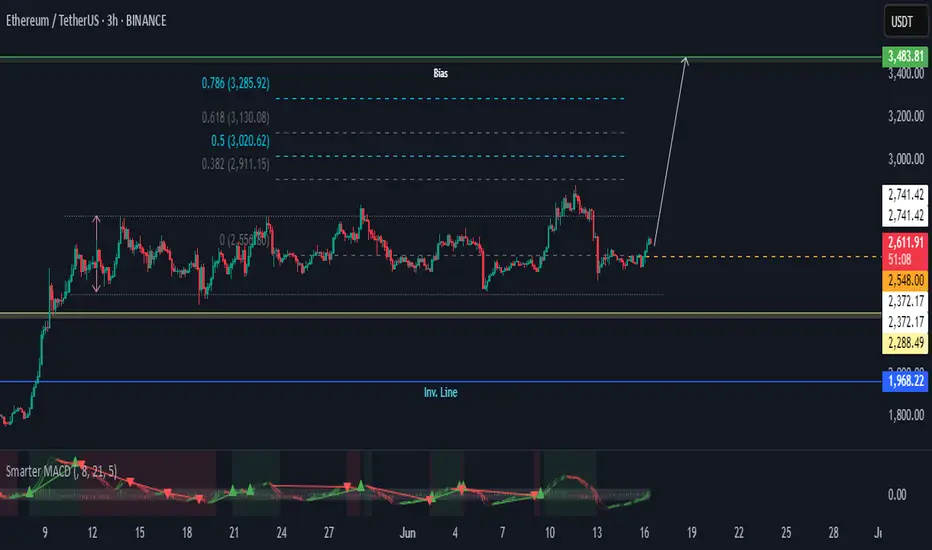
Ethereum TA: Bullish Momentum Signals Potential RallyHi there,
Ethereum shows bullish momentum with a positive MACD crossover while consolidating above key support levels, suggesting potential upward movement.
Ethereum’s price structure is strengthening, and if it clears the 2741.42 resistance, it could trigger a rally toward 3020.62–3285.92.
Happy trading
K.
Not trading advice.
ETHUSDT Daily: Navigating the "Deciding Area" Chart Overview:
The ETHUSDT Daily chart presents a compelling narrative of a significant uptrend, followed by a sharp correction, and now shows price approaching a critical inflection point. Key support and resistance zones, along with a crucial trendline, define the current market structure. The chart is labeled "Bullish," suggesting the analyst's long-term bias or expectation of a continuation of the prior uptrend.
1. The Prior Bullish Trend (Late 2023 - Early 2025):
Long-Term Uptrend Line (Green): From around September 2023 into early 2025, ETHUSDT exhibited a strong bullish trend, respecting a clear upward-sloping trendline (highlighted in green). Price consistently found support on this trendline, indicating robust buying pressure and a controlled ascent.
Key Resistance ($3900 to $4000): During this period, ETH encountered significant resistance around the $3900 to $4000 zone. This area represents a supply zone where sellers stepped in, preventing further upward movement on multiple attempts.
2. The Major Correction & Trendline Breakdown (Early 2025):
Sharp Downturn: In early 2025, ETHUSDT experienced a steep and aggressive correction. This bearish impulse led to a decisive breakdown below the long-term green uptrend line.
Shift in Momentum: The breach of this established trendline was a critical event, signaling a significant shift in short-to-medium term momentum from bullish to bearish.
3. Finding Support & Bounce Back:
Weekly Support ($2000 to $2200): After the breakdown, price found initial strong support in the $2000 to $2200 zone. This area had acted as a crucial pivot in previous price history, demonstrating its significance as a demand zone.
Strong Support ($1400 to $1500): Below the weekly support, the $1400 to $1500 zone is identified as "Strong support." This would be the next major demand area if the 2000−2200 level were to fail. The chart shows price briefly dipping below the 2000−2200 zone before finding a base and initiating a strong rebound.
Recent Bounce: The current price action shows a strong bounce from the lows reached after the trendline breakdown, indicating renewed buying interest and an attempt to recover.
4. The "Deciding Area" ($2900 to $3000 & Red Trendline):
Confluence of Resistance: The most critical area on the chart is the "Deciding Area," which represents a confluence of significant resistance levels:
The Former Green Trendline (now acting as resistance): What was once a strong support trendline has now likely flipped to become a resistance trendline (implied by the red line, which is parallel or an extension of the green line). Price often retests broken trendlines before continuing in the new direction.
Horizontal Resistance Zone ($2900 to $3000): This grey box aligns with previous support/resistance levels and now acts as a key overhead supply zone.
Current Price Engagement: Price is currently approaching the lower boundary of this "Deciding Area." This zone will determine the immediate future direction of ETH.
Potential Scenarios:
Bullish Continuation (Breakout): If ETHUSDT can successfully break above the "Deciding Area" ($2900 to $3000 zone and the red trendline) with strong volume, it would signal a significant shift in buying conviction. The next logical target would be the "Key Resistance $3900 to $4000" area, and potentially a retest of its all-time highs. The current bullish arrow on the chart suggests this is the anticipated move if the "Deciding Area" is breached.
Bearish Rejection (Reversal): A strong rejection from the "Deciding Area" could see ETHUSDT consolidate or retrace back towards the "Weekly Support $2000 to $2200" zone. A failure to hold this support could then lead to a test of the "Strong Support $1400 to $1500."
Conclusion:
ETHUSDT is at a pivotal point, engaging with a highly significant "Deciding Area" that combines both horizontal and trendline resistance. The ability of the bulls to push through this zone will be crucial for determining whether the rally from the recent lows can continue towards prior highs or if ETH will face another period of consolidation or deeper correction. Traders should closely monitor price action and volume at these critical levels for confirmation of the next directional move.
Disclaimer:
The information provided in this chart is for educational and informational purposes only and should not be considered as investment advice. Trading and investing involve substantial risk and are not suitable for every investor. You should carefully consider your financial situation and consult with a financial advisor before making any investment decisions. The creator of this chart does not guarantee any specific outcome or profit and is not responsible for any losses incurred as a result of using this information. Past performance is not indicative of future results. Use this information at your own risk. This chart has been created for my own improvement in Trading and Investment Analysis. Please do your own analysis before any investments.

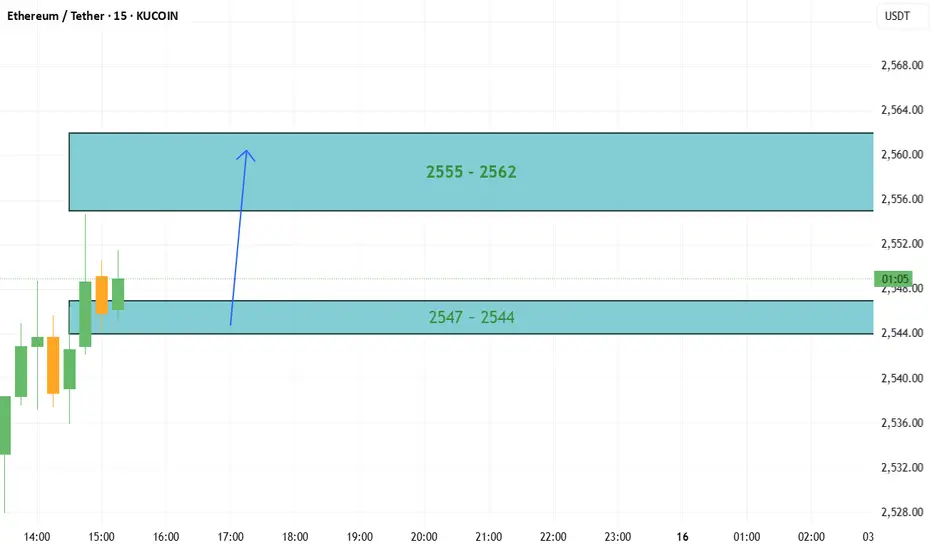
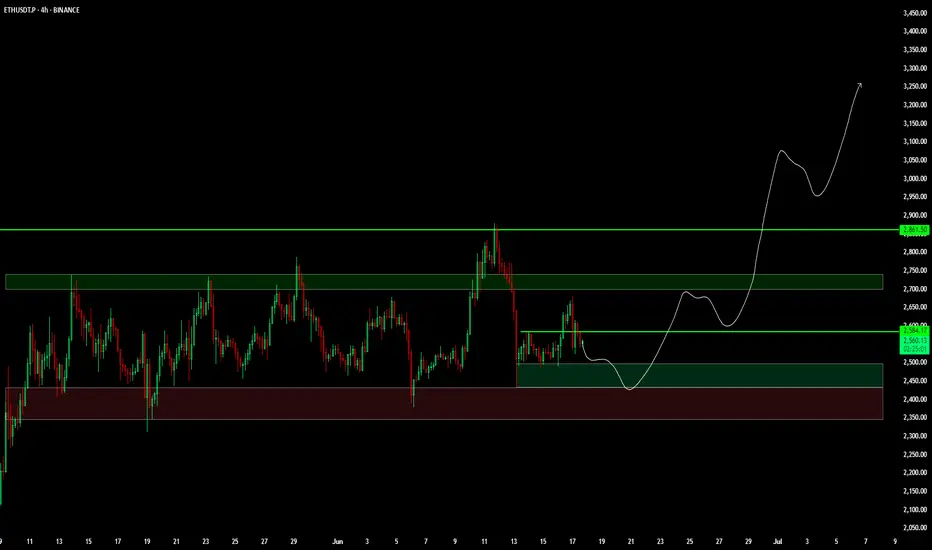
Ethereum Futures Update (Trade Idea)After identifying clear supply and demand zones for ethereum, you can look at the chart and now identify where and when to place trades. Based on my analysis, it is best if we cross map this to the coinglass liquidation heat map to have a more clear idea on the direction that the price action moves.
Furthermore, I think we see maybe a jump back up to 2540s and the make the next move down.
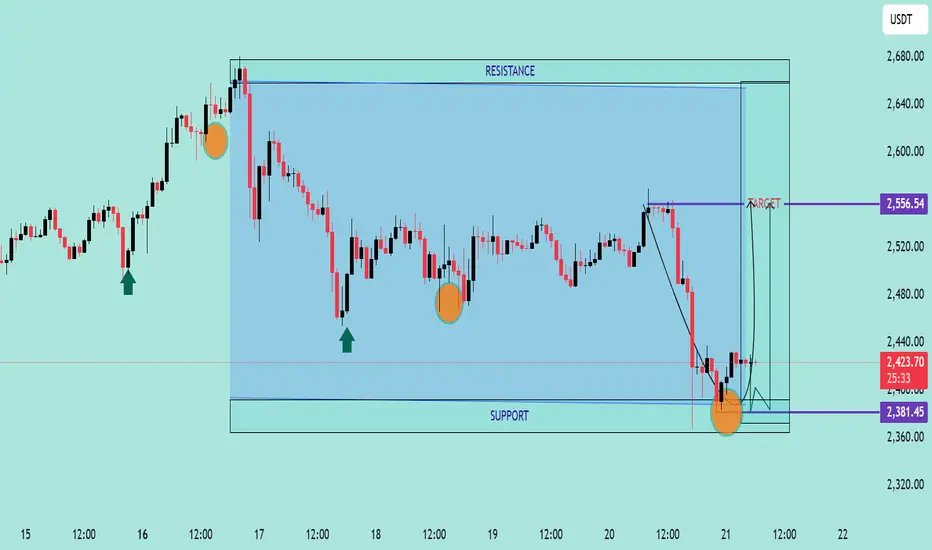
ETH/USDT Bullish Reversal from Support Zone Chart Analysis:
The chart illustrates a range-bound consolidation with clear support around $2,381.45 and resistance near $2,556.54.
🔍 Key Observations:
✅ Multiple Support Tests: Price has tested the support zone several times (highlighted by orange circles) and respected it, indicating strong buying interest at the lower boundary.
📉 Fakeout and Recovery: A false breakout below support occurred, but the candle quickly reversed, signaling a bear trap and potential for bullish momentum.
🔼 Rejection Wick & Consolidation: A strong rejection wick on the most recent candlestick shows buyers defending the zone aggressively. The current price action shows consolidation — a bullish accumulation pattern.
🎯 Upside Target: Based on the range breakout projection, the price could potentially revisit the resistance zone at $2,556.54, marked as the TARGET on the chart.
📌 Technical Outlook:
🟢 Bias: Bullish as long as the price holds above $2,381.45.
💹 Entry Idea: Aggressive buyers may enter near current levels with a stop below the wick low.
🛑 Risk Level: Tight stop-loss needed as the structure relies heavily on support holding.
📈 Conclusion:
A classic range rebound setup is forming with potential for upside movement back toward resistance. A breakout above $2,556.54 could initiate a trend continuation rally
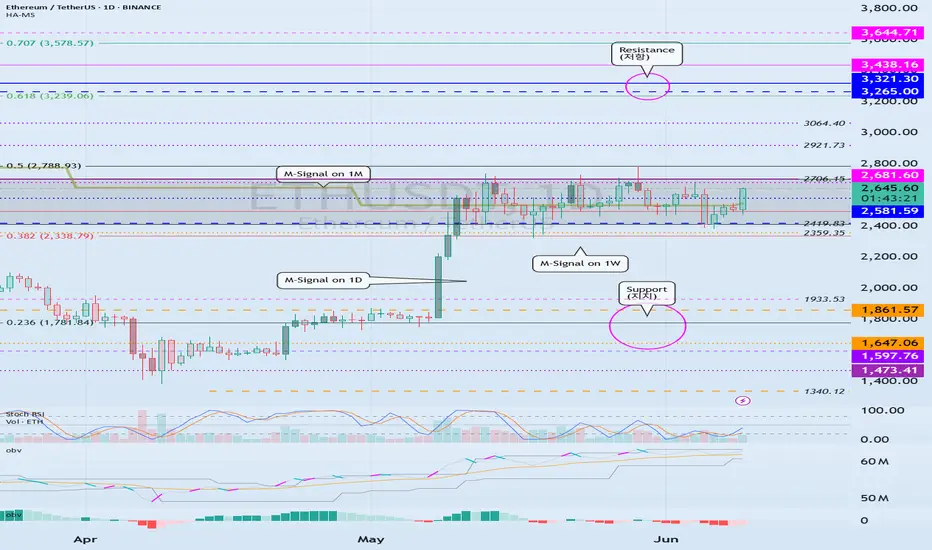
Breakout point: 2706.15
Hello, traders.
If you "follow", you can always get the latest information quickly.
Have a nice day today.
-------------------------------------
(ETHUSDT 1D chart)
The key is whether the price can rise above the important support and resistance area of 2419.83-2706.15 and maintain it.
Therefore, when the 2706.15 point is broken upward, it can be said that a breakout trade is possible.
The conditions for a breakout trade are:
- OBV must rise above the High Line and be maintained,
- OBV oscillator must show an upward trend,
- StochRSI indicator must show an upward trend.
However, it is better if StochRSI indicator has not entered the overbought zone.
When the rise begins, the resistance zone is expected to be around 3265.0-3321.30.
-
Although funds are continuously flowing into the coin market, it may feel like the trading volume has decreased.
The reason for this is thought to be that BTC dominance is generally showing an upward trend.
The meaning of BTC dominance rising means that funds in the coin market are concentrated toward BTC.
Therefore, I think that the overall trading volume has decreased because more funds are needed for the price to rise.
When the altcoin bull market begins, more transactions will occur, which will make you think that liquidity has increased in the coin market.
Therefore, for the altcoin bull market to begin, the BTC dominance must fall below 55.01 and remain there or continue to fall.
If the USDT dominance remains below 4.97 or continues to fall, the coin market is likely to rise.
At this time, depending on the BTC dominance mentioned earlier, you can distinguish whether the rise is focused on BTC or whether the altcoin is also rising.
If the BTC dominance continues to rise, most altcoins are likely to gradually move sideways or fall.
Therefore, if you are trading altcoins in this situation, I think it would be useful to increase the number of coins (tokens) corresponding to profit while responding quickly and briefly.
In other words, it means selling the purchase amount (+including transaction fees) when the price rises by purchase price, leaving the number of coins (tokens) corresponding to profit.
The coins (tokens) increased in this way are coins (tokens) with an average purchase price of 0, which will reduce the psychological burden when the altcoin bull market begins, allowing you to obtain a good average purchase price.
-
Thank you for reading to the end.
I hope you have a successful transaction.
--------------------------------------------------
- This is an explanation of the big picture.
(3-year bull market, 1-year bear market pattern)
I will explain more details when the bear market starts.
------------------------------------------------------
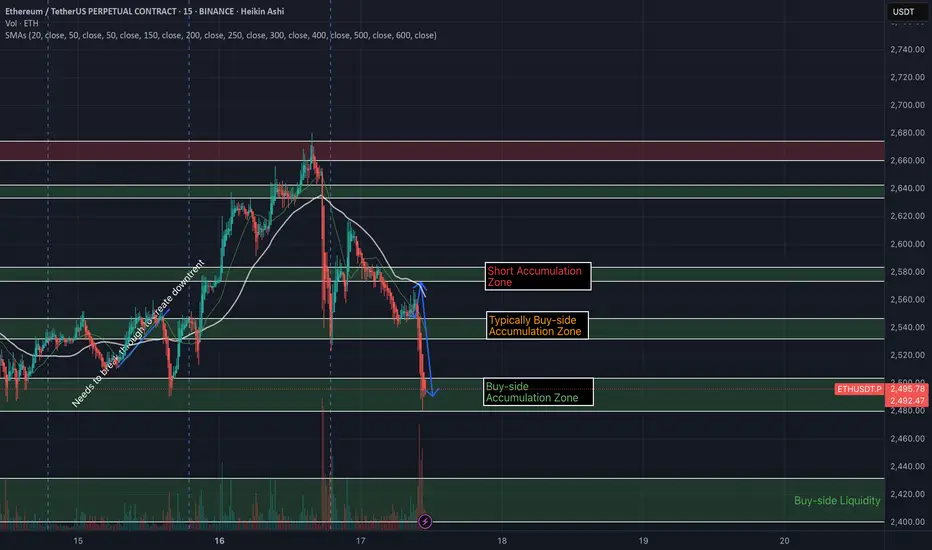
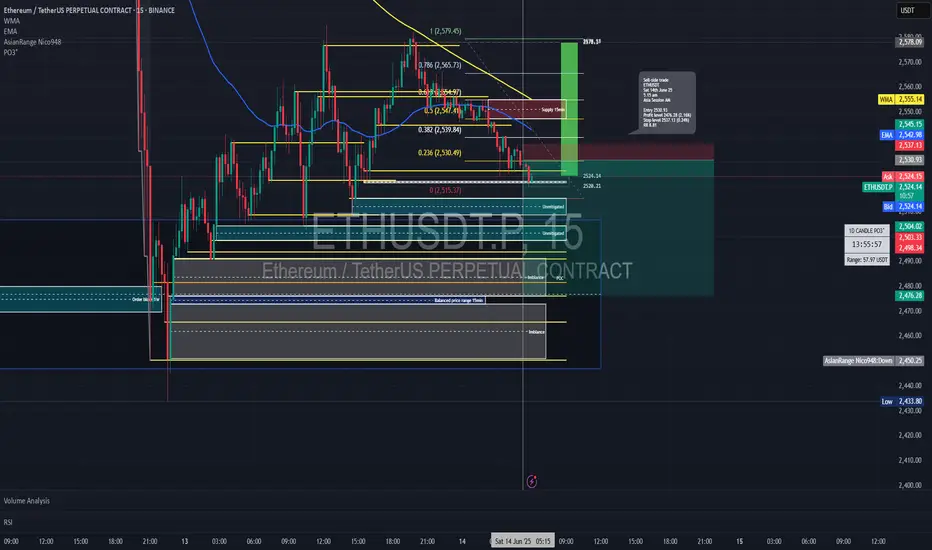
Short trade Sell-side trade
ETHUSDT
Sat 14th June 25
5.15 am
Asia Session AM
Entry 15min TF
Entry 2530.93
Profit level 2476.28 (2.16%)
Stop level 2537.13 (0.24%)
RR 8.81
Sell-side trade idea narrative based on the ICT seek and destroy indicator, taking session liquidity into account for directional bias, along with unmitigated price zones and imbalanced price ranges for confluence.
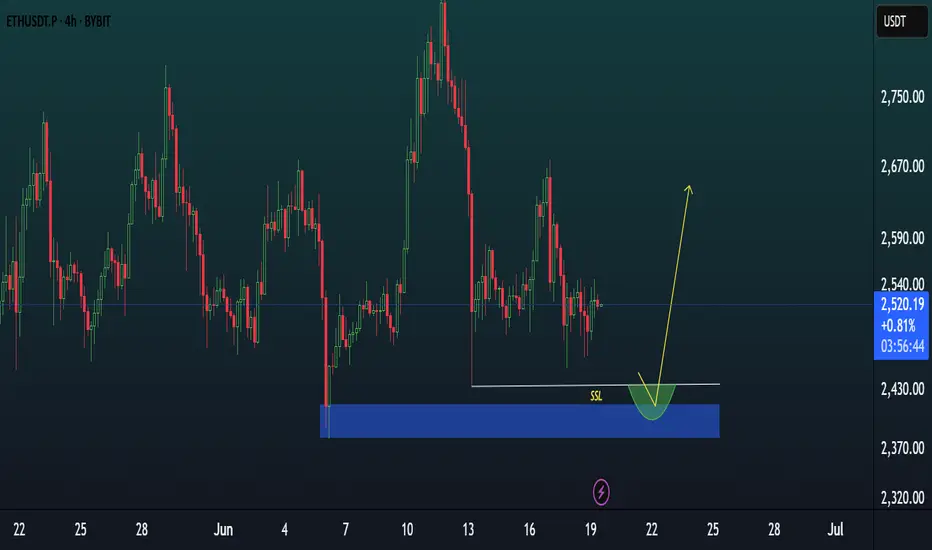
ETHUSDT – Trade Recap & Daily Bias for June 21Trade Recap (June 20):
I. First thing I did was mark out a DOL on the daily — price was hovering near a swing low, and I started noticing trend-side liquidity building up on the lower timeframes.
So my directional bias for today was short.
II. I marked the daily open.
III. With a short bias in mind, I waited for a Turtle Soup setup right above the daily open.
IV. The equal highs above were clean and obvious — textbook liquidity.
V. Once that liquidity was swept, I dropped to the M15 to watch how price reacted — waited for a clean displacement away from that zone before getting involved.
Daily Bias (June 21):
Still leaning short. We’re pretty close to a weekly FVG, which might act as a magnet.
If price forms liquidity during the day and takes it out in-session, I’ll look to short again.
Bread and Butter & Turtle Soup

HolderStat┆ETHUSD accumulationBYBIT:ETHUSDT is compressing in an ascending triangle, pivoting around 2 500. A decisive break above 2 520 tees up 2 800–2 900 continuation, while closing back under 2 430 would negate the immediate setup but leave macro structure bullish.
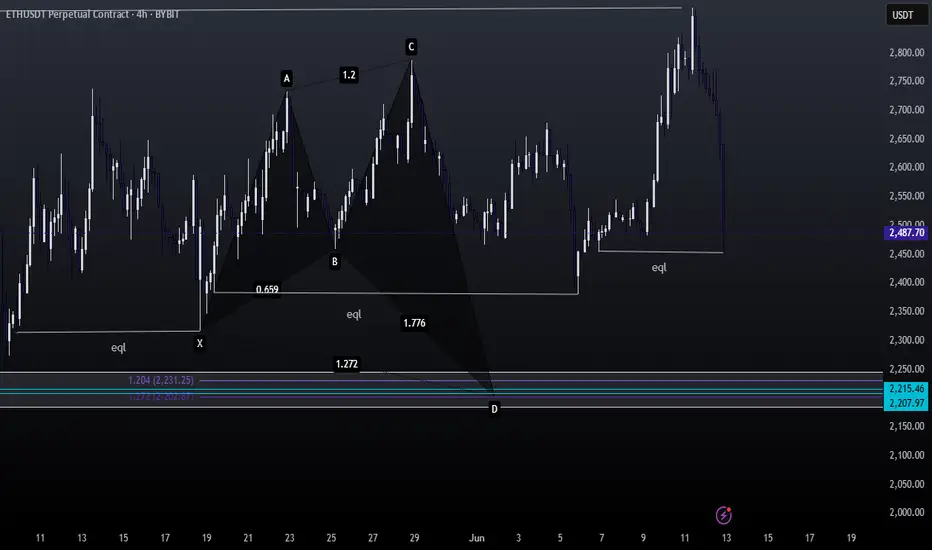
ETH – Rounded Distribution Before the Punch Higher?What we’re seeing here is a potential fakeout setup within a value zone.
Notice the rounded top formation — looks bearish — but price refuses to break the low. This often sets the stage for a sharp reversal.
Structure Breakdown:
Volume profile shows acceptance in current range
Rounded top shape implies weakness — but no breakdown = trap potential
Price holds a higher low inside the range = absorption
Green box marks ideal long entry area — well-defined invalidation below
Bullish case:
We’re watching for that reclaim of the mid-level → quick push into the upper range
Target zone = 2,618 (clean inefficiency fill + local top)
Bearish trap scenario invalidated if price closes below red box (stop hunt level)
Strategy bias:
This is a compression-reversal trap — fake weakness to trap shorts, then launch.
Patience pays here — if it reclaims and consolidates at the mid, it’s time to ride.
📊 More setups like this, early in structure, are shared inside the account description. Tap in for the breakdowns.
