Long trade
ETHUSDT Buyside Trade – Full Journal
Date/Time: Saturday, 25th April 2025, 7:55 AM NY Time
Pair: ETHUSDT
Session: London AM
Entry TF: 5min
🔹 Entry: 1789.52
🔹 Take Profit: 1826.93 (+2.88%)
🔹 Stop Loss: 1775.30 (–0.42%)
🔹 Risk-Reward Ratio: 5.40
Trade Reasoning
Price showed bullish structure with higher lows forming leading into the London open.
ETHUSDT.3S trade ideas

ETH SHORT SETUP ALL trading ideas have entry point + stop loss + take profit + Risk level.
hello Traders, here is the full analysis for this pair, let me know in the comment section below if you have any questions, the entry will be taken only if all rules of the strategies will be satisfied. I suggest you keep this pair on your watchlist and see if the rules of your strategy are satisfied. Please also refer to the Important Risk Notice linked below.
Disclaimer
ETH SHORT TRADE SETUP
ENTRY : 1949.24
PROFIT : 1725.06
STOP : 2020.31

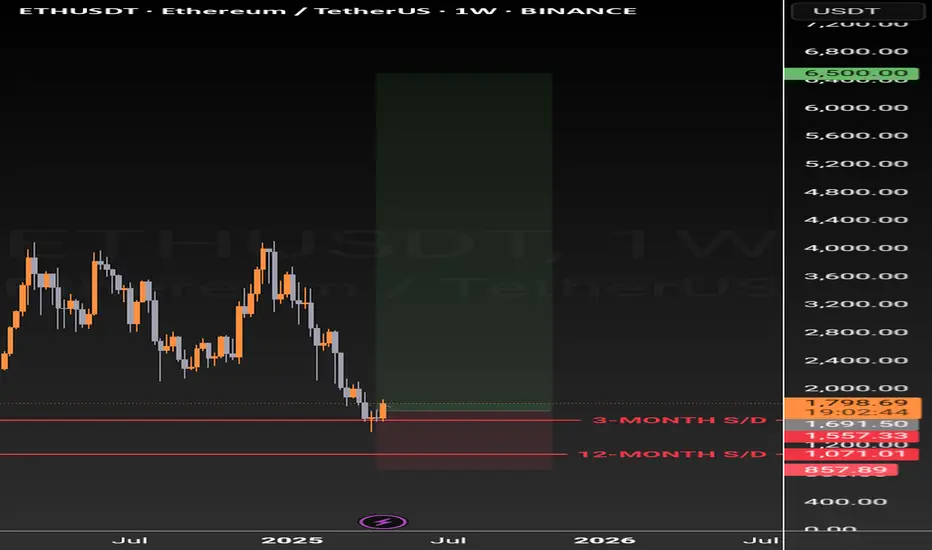
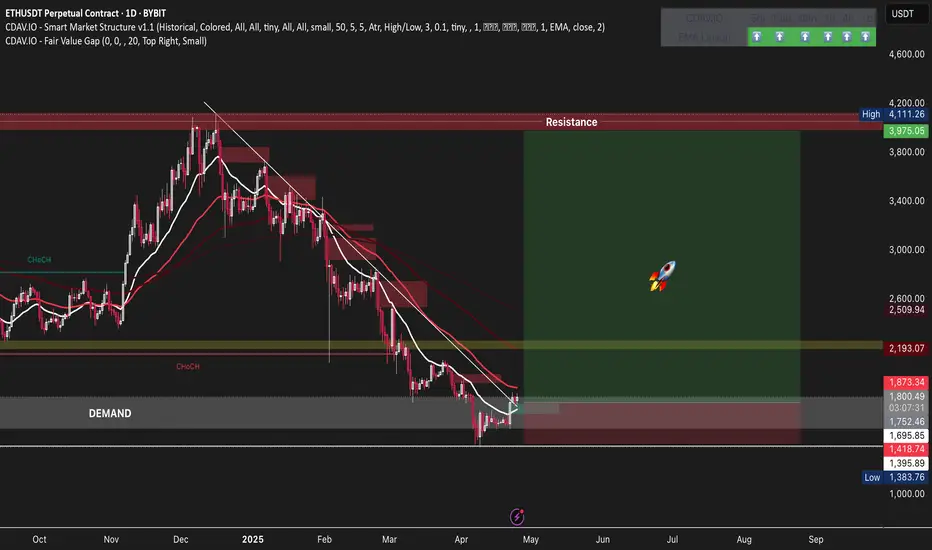
ETH TO THE MOON TRADEETHUSDT Weekly Analysis | 3M & 12M Supply/Demand Zones
Currently, Ethereum (ETHUSDT) is trading around $1803, sitting close to major higher timeframe zones:
3-Month Supply/Demand Zone: ~$1691
12-Month Supply/Demand Zone: ~$1557
Price has reacted strongly near the 3M S/D zone after a multi-month decline. Holding above this zone could indicate a potential bottom formation.
Reminder:
This is not financial advice. Always do your own research and trade with proper risk management.
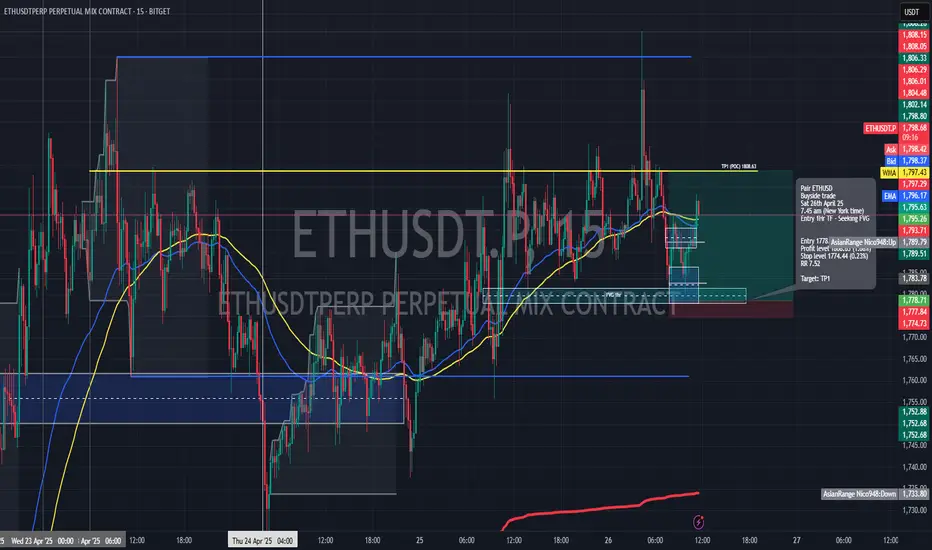
Long trade
Trade Overview: ETHUSD – Long Position
Entry Price: 1778.55
Take Profit (TP1): 1808.63 (+1.68%)
Stop Loss: 1774.44 (–0.23%)
Risk-Reward Ratio (RR): 7.52
🕖 Entry Time: 7:45 AM (New York Time)
📅 Date: Saturday, 26th April 2025
🌍 Session: NY AM
🧭 Entry Timeframe: 1-Hour TF (focused on FVG)
Reasoning Narrative
ETHUSD showed clear bullish intent on the 1-hour timeframe, with price forming a series of higher highs and lows. Leading into the entry, the market had recently filled a fair value gap (FVG) left behind from the prior bullish expansion, signalling a potential continuation setup.
5min TF Overview
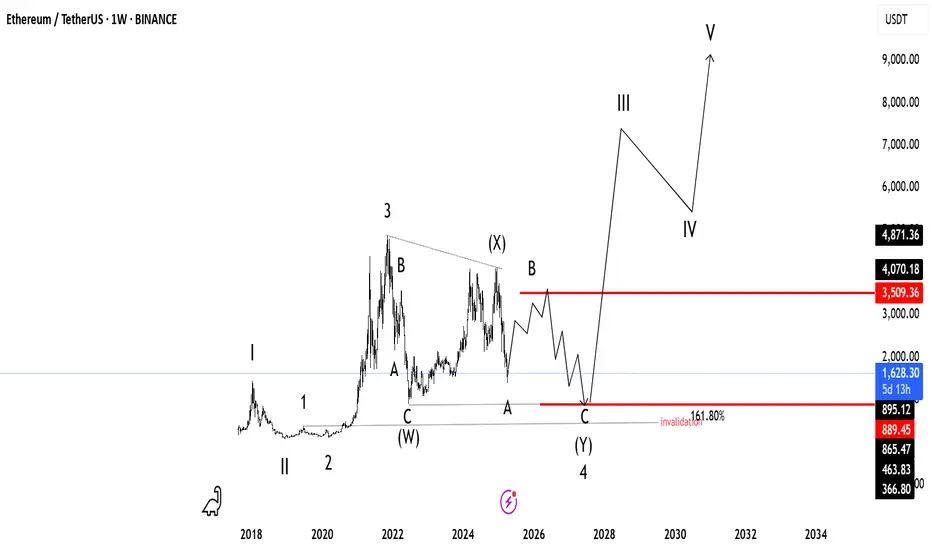
Ethereum (ETH/USDT) – Elliott Wave Long-Term AnalysisBINANCE:ETHUSDT
📈 Ethereum (ETH/USDT) – Elliott Wave Long-Term Analysis
🕒 1W Chart – Macro Projection
According to my Elliott Wave count, Ethereum is currently completing a complex WXY correction in wave 4. The final leg, wave C of (Y), could drive the price down into the key support zone between $895 – $865, aligning with the 161.8% Fibonacci extension.
✅ Buy zone: $895 – $865
❌ Invalidation: sustained break below $865
🔴 Major resistance: $3,509
🚀 If the structure plays out, a powerful wave III-IV-V rally could follow, with long-term targets potentially above $9,000 by 2034.
This scenario remains valid as long as the corrective wave stays above the invalidation level. A bullish macro structure is still intact.
💬 Drop your thoughts or alternate counts in the comments!
🔁 Like & share for more ETH updates 🔥
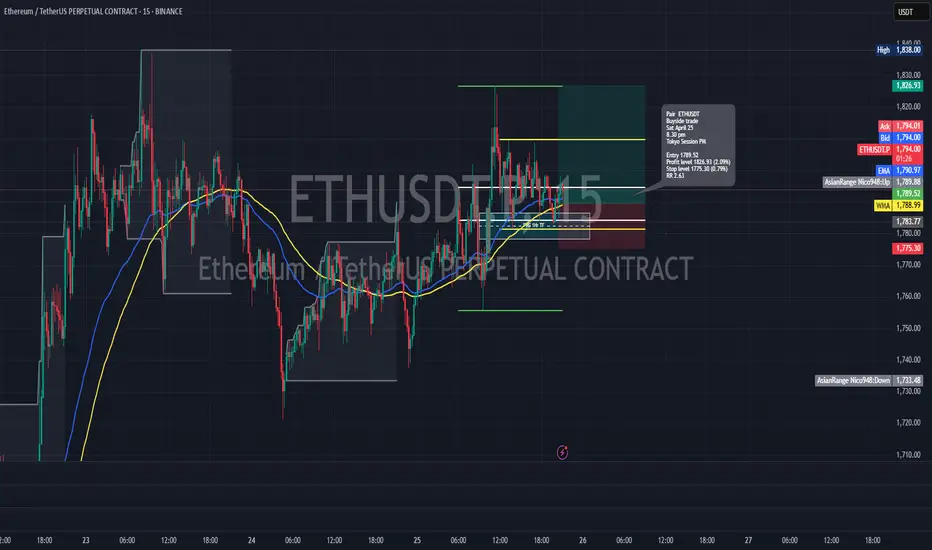
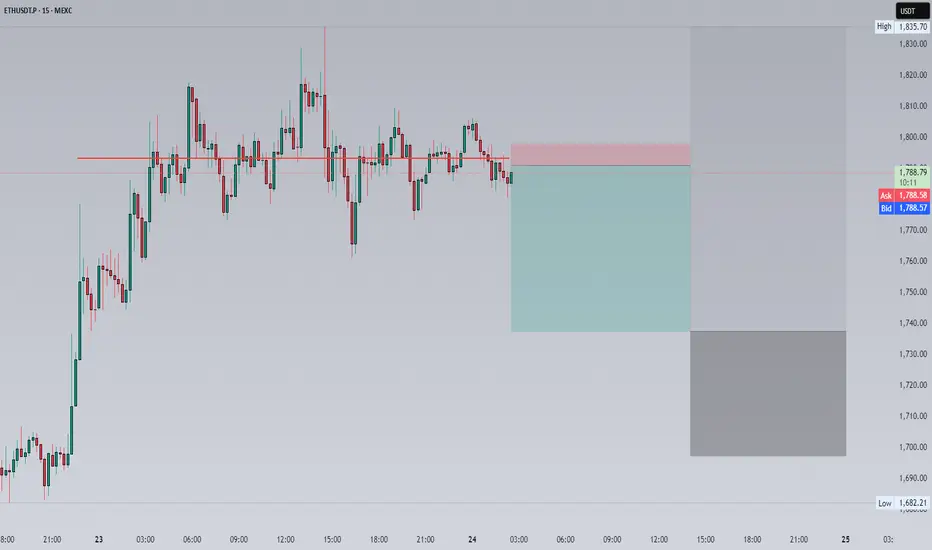
Long trade
Trade Overview: ETHUSDT – Long Position
Entry Price: 1789.52
Take Profit: 1826.93 (+2.09%)
Stop Loss: 1775.30 (–0.79%)
Risk-Reward Ratio (RR): 2.63
🕣 Entry Time: 8:30 PM (NY Time)
📅 Date: Saturday, 25th April 2025
🌍 Session: Tokyo PM
🧭 Bias: Buy-Side
The entry at 1789.52 came after a liquidity sweep below a short-term low, followed by a strong bullish engulfing candle on the 5-minute chart. This action indicated a classic smart money entry pattern, where sellers were trapped below the structure before a reversal.
5min TF
Ethereum Eyes Bullish Momentum After Resistance BreakoutUpon a confirmed breakout above the resistance line, Ethereum will be well-positioned for a potential bullish move.
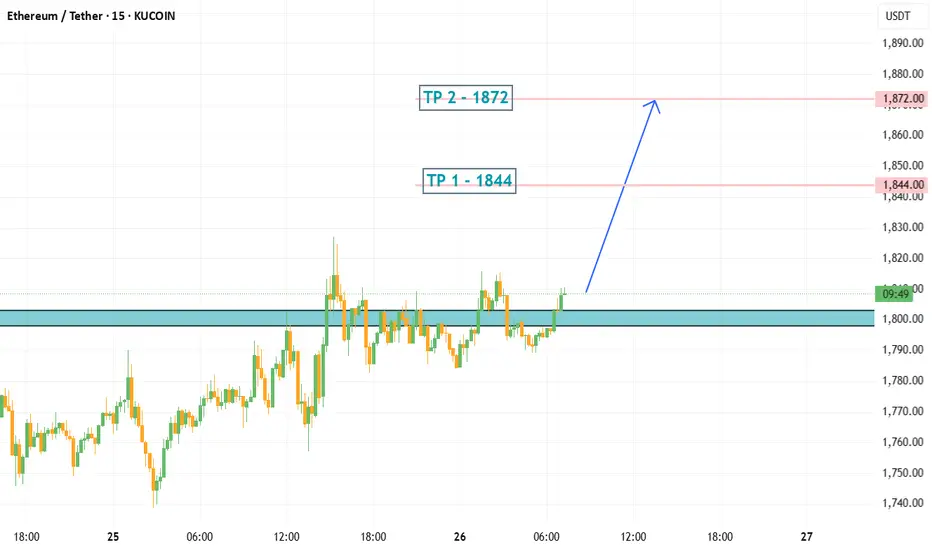
ETH/USDT LONG IDEAPosition opening range 1798~1803 USDT in batches
Total Position Recommendation Within 5% of total funds (or 1~2% of total account loss)
Stop Loss 1784 USDT, liquidate the position when triggered.
Take Profit First Target 1844, Second Target 1872
Cooling-off rule: 24 hours cooling-off after stop loss
Prohibition Prohibition of chasing high, prohibit the increase of positions, prohibit continuous trading
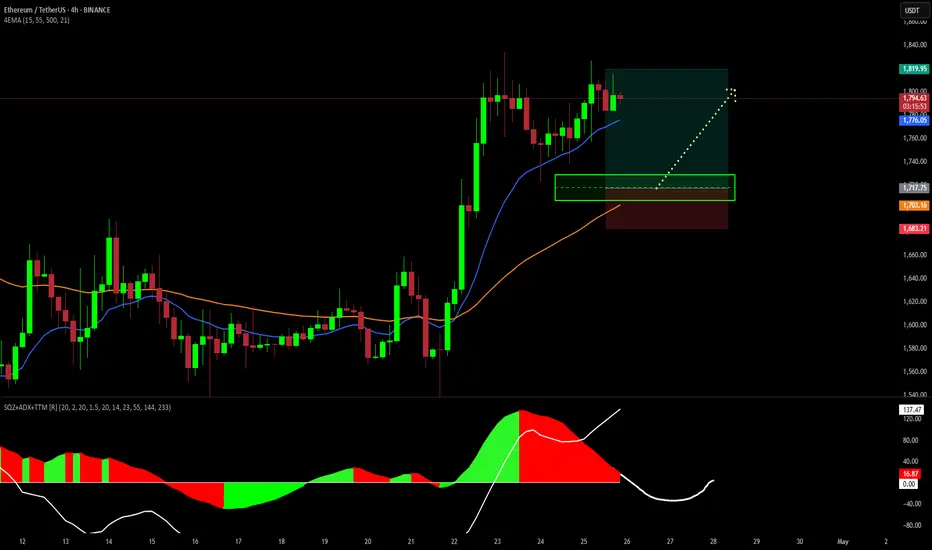
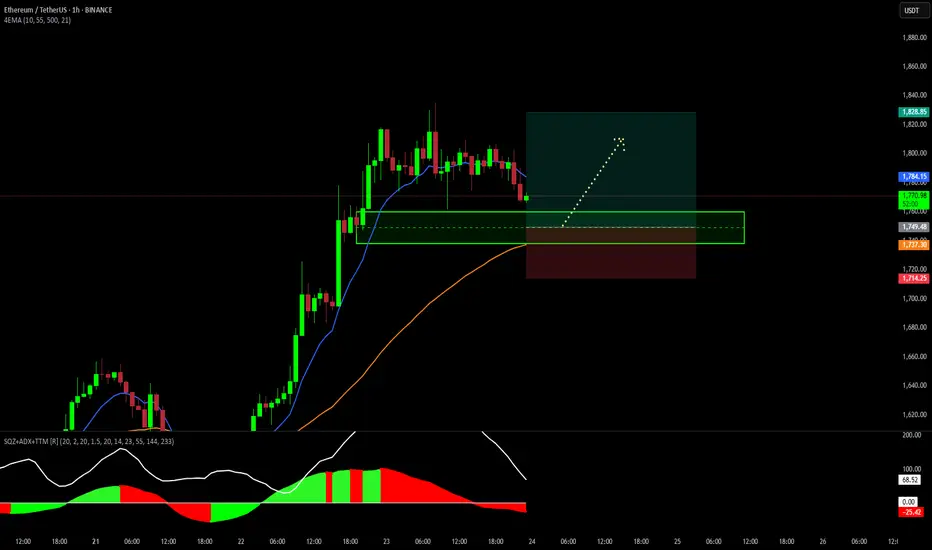
trading ETH/USD FUTURES, 4H.The price of ETH has consumed the bearish time of the SQZ indicator and has made a range above the two moving averages, which gives us a sign of strength in buyers, for the day a bullish pattern will possibly be in place and possibly the best buying zone will be between $1730 to $1700 dollars.
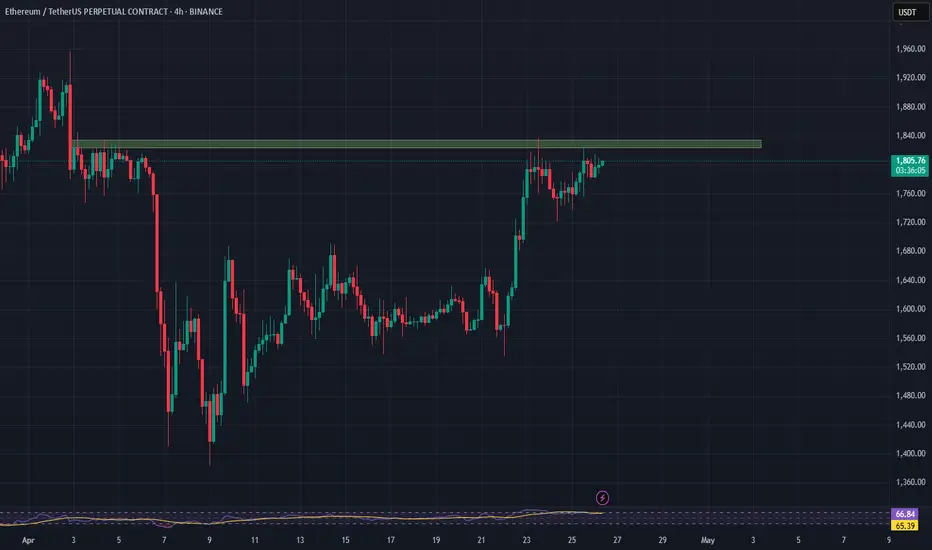
"ETH Breakout Watch: Holding Support for a Push Toward $1900+"ETH 4H chart par price apne key support (purple box) ke upar consolidate kar raha hai. Jab tak yeh support hold karta hai, $1900 - $1920 ka target active rahega.
Agar support toot jata hai to next major demand zone 1660-1680 ke aas paas hai. Tab tak structure bullish hai.
Trading plan simple hai:
✅ Support hold = Buy dips for $1900+
❌ Support breakdown = Wait for lower entries.
Chart clear path dikhata hai, risk manage karte raho! 🚀

$ETH Breakout – High Probability Move Ethereum has been in a downtrend since December 16, showing consistent lower levels. However, we’re now seeing a confirmed breakout above the trendline, which signals a strong potential reversal.
This breakout suggests a high-probability move to the upside, with price targeting the $4,000 level in the coming period.
Keep watching — the momentum is building.
Follow me for updates and analysis as the setup plays out. BYBIT:ETHUSDT.P
ETH Short is a must DOUBLE TOP on the charteven if not for long, but there is an a double top , so i expect a -7/10%
fib. retracement show it where has to go for a sane going up, as you can see my previwed analysis i have an 88% of profitable trade.
Good luck guys and trade safe, max leverage x10/15

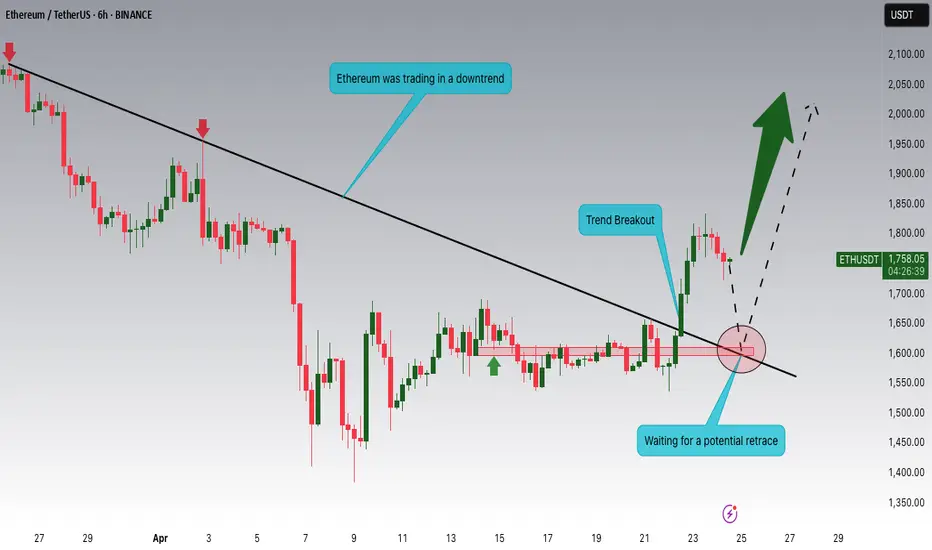
Ethereum Breakout and Potential RetraceHey Traders, in today's trading session we are monitoring ETHUSDT for a buying opportunity around 1620 zone, Ethereum was trading in a downtrend and successfully managed to break it out. Currently is in a correction phase in which it is approaching the retrace area at 1620 support and resistance zone.
Trade safe, Joe.
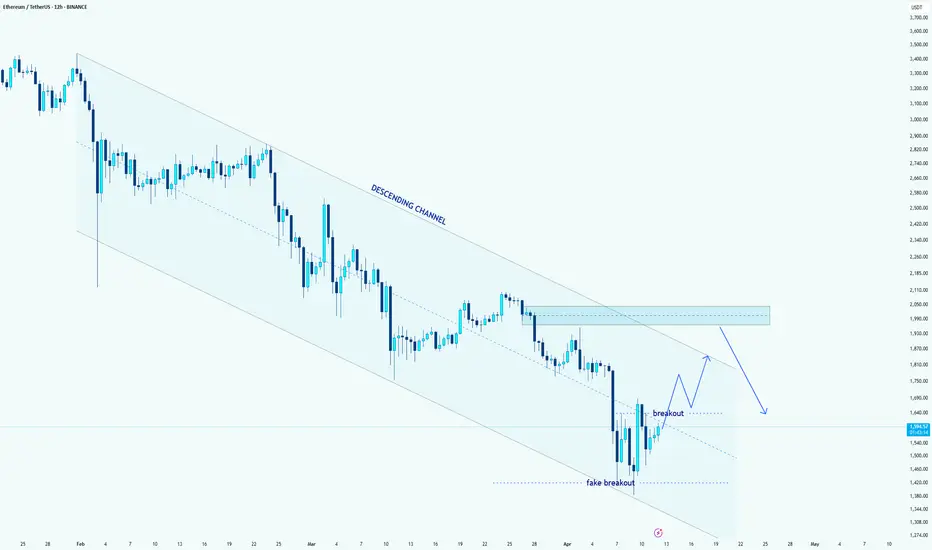
Ethereum Breaks Out of Descending Channel–But Is It Sustainable?Hello guys.
Ethereum (ETH/USDT) has recently broken out of a well-defined descending channel on the 12H timeframe, suggesting a short-term shift in momentum. However, traders should remain cautious, as price action still faces significant resistance ahead.
🔍Technical points:
Descending Channel Structure: ETH has been trending downward since early February 2025, forming a clean descending channel with lower highs and lower lows.
Fake Breakout & Reversal: Earlier in April, the price dipped below the lower boundary of the channel in what now appears to be a fake breakdown, quickly recovering back inside.
Confirmed Breakout: Recently, ETH managed to close above the midline of the channel, breaking above short-term resistance near $1,640. This confirms a bullish breakout, at least in the short term.
Next Key Resistance Zone: The price is now targeting the $1,850–$2,050 area — a strong supply zone and previous structural level. If ETH fails to break through this zone, we may see another leg down inside the broader downtrend.
Short-Term Projection:
Bullish Path: A possible continuation toward the upper channel edge near $1,900–$2,000.
Bearish Rejection: If sellers defend that zone, ETH could resume its downward trend, potentially revisiting $1,500 or even lower.
ETH Underperformance relative to BTCWhile CRYPTOCAP:BTC is back at its February highs, CRYPTOCAP:ETH is still battling to break above its early April peak.
IF CRYPTOCAP:BTC keeps pushing, CRYPTOCAP:ETH will most likely follow on it's USDT pair.
IF CRYPTOCAP:BTC rejects and goes lower, CRYPTOCAP:ETH will most likely go to the local lows or create new lows.

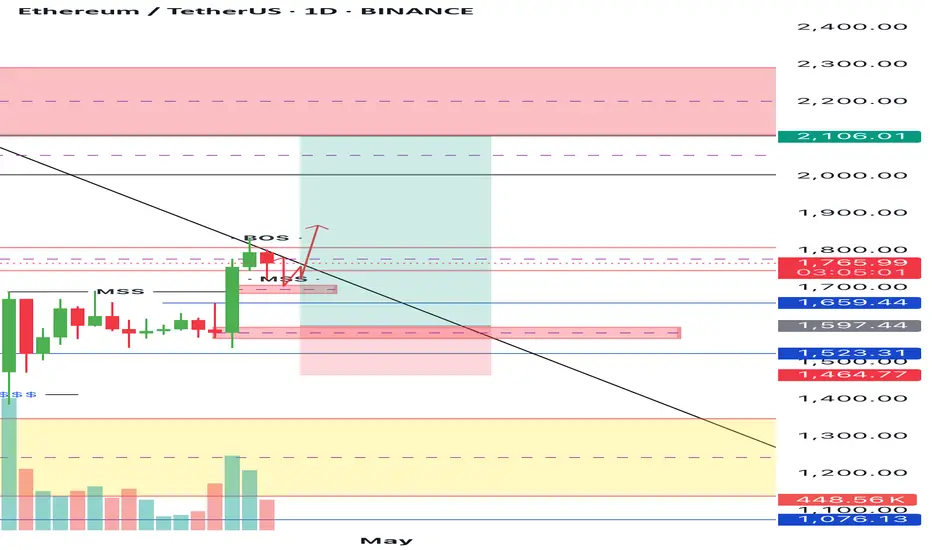
Ethereum (ETH): Possible Zone of Rejection | Waiting For MSDWe are waiting for further market structure development in order to get the confirmation on upcoming downward movement, which we are looking for currently.
After the fill of bullish CME, we had a nice rejection and first signs of weakness, which might turn into a bigger rejection from our golden zone.
As soon as we see a proper MSB form below that zone, we are going to look for downward movement from there!
Swallow Academy

ETH SCENARIOS - LONG/SHORTThat's what I'm looking at in the near future.
Just some ideas :)
Crypto Introduction
Ethereum is a decentralized platform that runs smart contracts: applications that run exactly as programmed without any possibility of downtime, censorship, fraud or third party interference.
Will book 50% of short at 1:1RR (if given) to make it risk free.
Raw R:R is over 8 so there is room to play with.
$ETH | #4h & #12h structure overview The upper boundaries of both the 4h and 12h ranges have been swept — a textbook HTF trigger for shorts within a broader bearish range context.
🔻 Breakdown:
— Both ranges remain bearish
— Sweep of H4/H12 highs confirmed → signaling possible continuation down
— Below lies FVGs and equal lows, prime targets for liquidity grabs
🧠 There’s clear downside potential into liquidation zones. Watching for M15/LTF confirmations to engage — otherwise waiting on a pullback for a safer entry.

trading ETH/USD TFUTURES, 1H.For the price of ETH, the time of 1H has passed and it has not fallen, but the price will have to go down to liquidate people and its bullish pattern will be created to try to find its previous maximum.
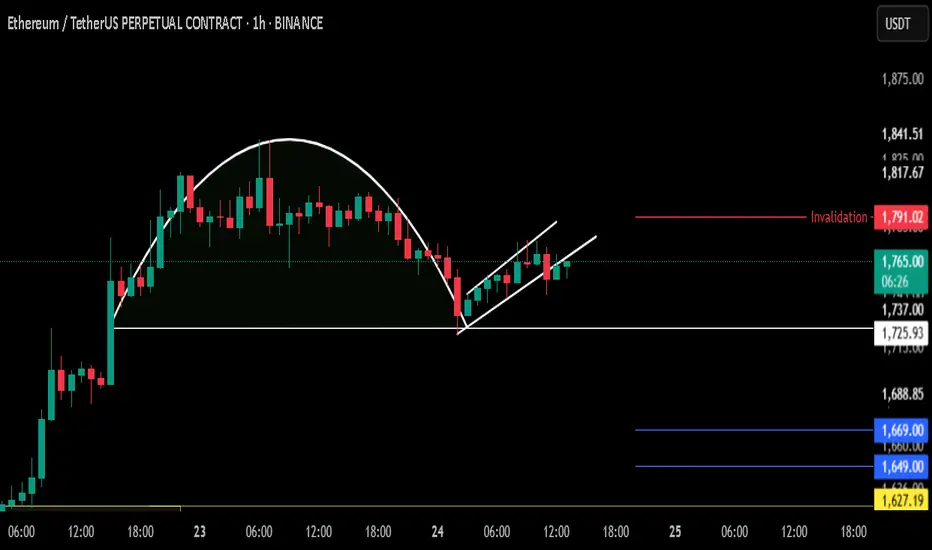
ETH/USDT ready to breakdown?? Inverted Cup & HandleETH/USDT
BINANCE:ETHUSDT.P
ETH is up 16.94% since our previous call. Currently, it has formed an inverted cup and handle pattern, which is a strong bearish setup.
If the price breaks below the white line (neckline), the pattern confirms and presents a short opportunity.
On confirmation, we expect a retest of the blue lines below, with a potential maximum target at the yellow line.
However, if the price breaks above the red line, the pattern becomes invalid.
Stay patient, avoid FOMO, and wait for clear confirmation/rejection before taking any position.
Ethereum iFVG / GP Long IdeaLong idea for Ethereun on the 1-4H, if we retrace back into the bull iFVG and tap that 1H GP, possible long entry at the level - Targeting external buyside liq for TP and to most recent sellside sweep as a stop loss

ETH - New ATH Approaching?Bitcoin has been full of surprises over the past few days, and this will most definitely affect Ethereum as well - which has not made a previous ATH when BTC did , a point we should not be forgetting.
This would also bring about the beginning of a new ALTSEASON.
But before we get too excited about all of the above - let's first see if Bitcoin can continue to CLOSE daily candles above the key support zone, as pointed out in the video.
_______________
BINANCE:ETHUSDT
BINANCE:BTCUSDT
