Ethereum. Daily Timeframe. Seller initiativeHey traders and investors!
📍 Context
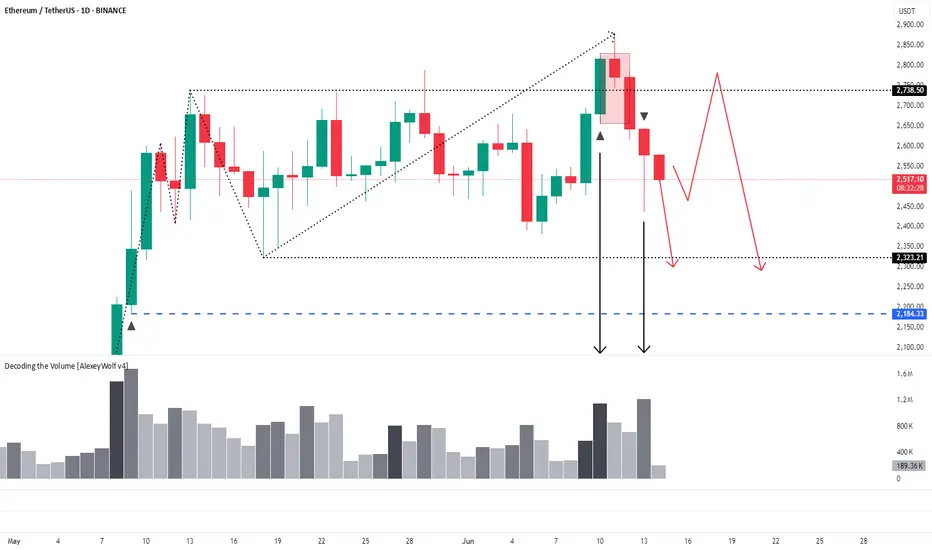
• Market phase: Sideways range
• Current control: Seller initiative
📊 Key Price Action:
The price broke above the upper boundary of the range (2738) with a buyer KC candle, touching the 50% retracement level (2874) of the last weekly seller initiative (1).
However, the seller absorbed the buyer’s candle and pushed the price back inside the range (2), forming an IKC candle (3) — the highest volume candle within the seller’s initiative.
This sequence presents three bearish signals that support a potential continuation to the downside.
🎯 Trade Idea
Likely scenario: price tests the lower boundary of the range at 3,323.
🔸 In the meantime, it’s reasonable to look for short setups on lower timeframes within the current seller initiative.
🔸 If price reaches 3,323 and valid buyer patterns appear, this zone may offer a good opportunity for long entries.
This analysis is based on the Initiative Analysis concept (IA).
Wishing you profitable trades!
ETHUSDT.3S trade ideas
ETHUSDT – LAST HOPE FOR BULLS!Hey Traders!
If you’re finding value in this analysis, smash that 👍 and hit Follow for high-accuracy trade setups that actually deliver!
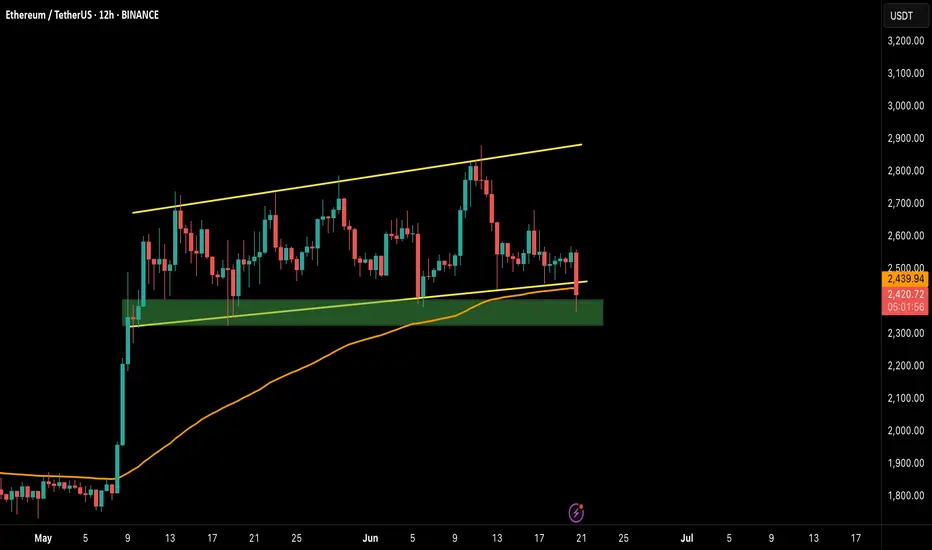
ETH has officially broken below the ascending channel support and is now testing the final demand zone (highlighted in green). This zone also aligns with the 200 EMA on the 12H timeframe — historically a strong dynamic support.
📉 If ETH fails to hold this green box, it could trigger a deeper correction, potentially dragging the price back towards the $2,200–$2,100 range.
✅ Bullish Case: A quick reclaim of the $2,460–$2,500 area followed by strong volume could invalidate this breakdown and bring back momentum toward $2,800.
🚨 Bearish Confirmation: A clean close below $2,400 on the 12H/Daily with rejection wicks would open the floodgates for lower targets.
💡 This is a make-or-break moment. Bulls need to defend this zone with strength — or risk handing over full control to the bears.
📍 Levels to Watch:
Support: $2,360 / $2,280 / $2,120
Resistance: $2,500 / $2,660 / $2,800
📊 Stay cautious, stay prepared. Follow for real-time crypto breakdowns & setups.
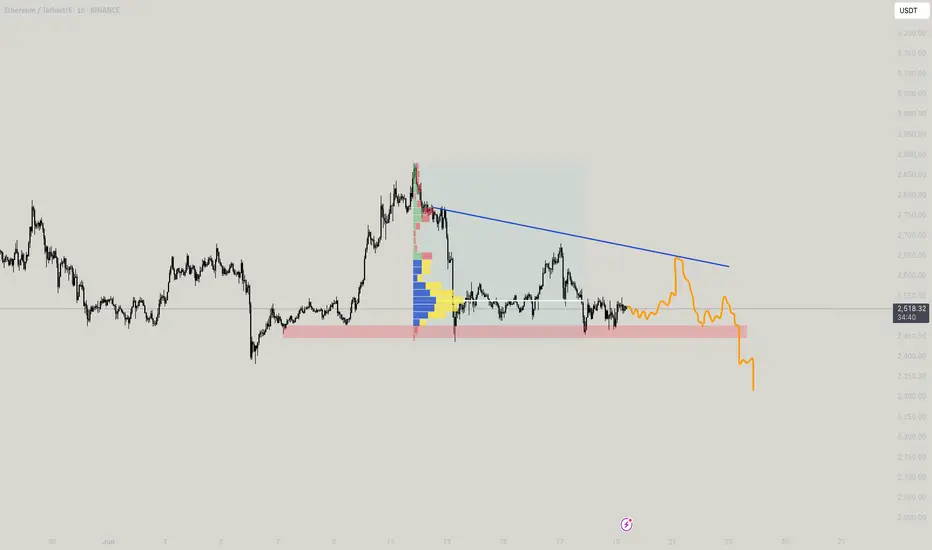
ETH - BOOM or Toink?Okay Mostly boom down, but a toink to get over most peoples liquidity and get sorted up, the probable move is this as per me
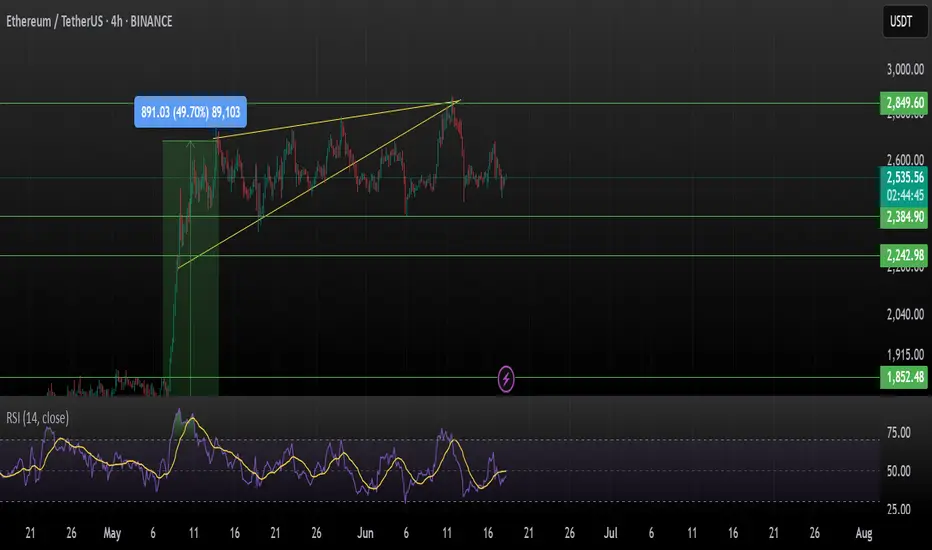
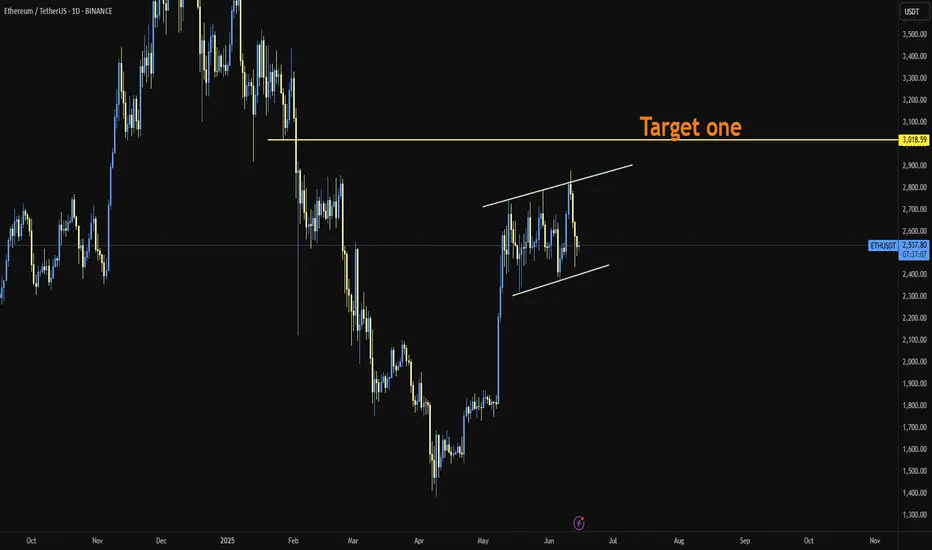
Ethereum (ETH/USDT) – Breakdown From Ascending TriangleEthereum failed to hold above the crucial resistance of $2,849 and has broken down from the ascending triangle on the 4H timeframe — invalidating the bullish breakout structure.
It seems to be consolidating and moving sideways in the range. The move is possible only if we break the channel either upside or downside.
Key Observations:
Ascending triangle fakeout followed by sharp rejection
RSI dropped from overbought (~70) to neutral zone (~46), showing weakening momentum
Current price: $2,537, testing local support at $2,384.90
Next major support zones: $2,242.98 and $1,852.48
Watch for further weakness below $2,384 — could accelerate downside toward $2,242 or lower.
Caution advised: Wait for the structure to rebuild before positioning it long.
This is not financial advice, please do your research before investing, as we are not responsible for any of your losses or profits.
Please like, share, and comment on this idea if you liked it.
#ETH #Ethereum #ETHUSDT
ETH didn’t rally — it cleared inefficiency and pausedThis isn’t the move. This is the setup for the move.
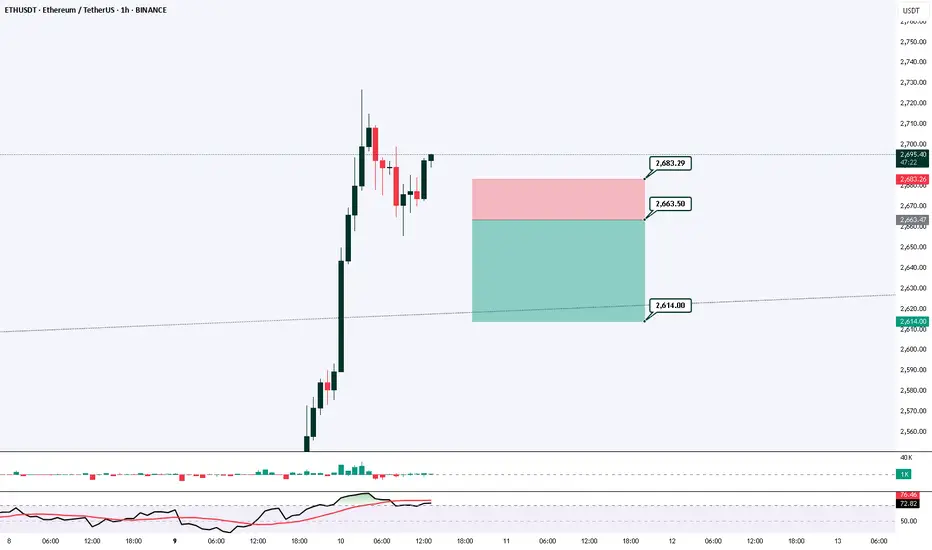
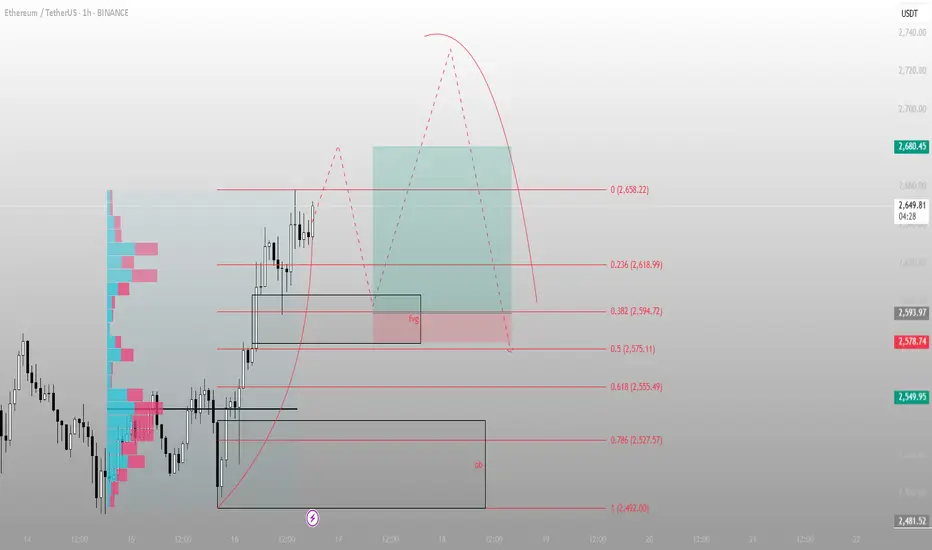
ETH tagged 2658.22 — premium — and stalled right where Smart Money pauses before redistributing or rotating.
Here’s how this lines up:
Price swept into the 0 fib (2658.22), then hesitated — that’s not weakness, that’s precision
Just below sits a clean FVG at 2594–2575, right between the 0.382–0.5 fibs
Below that: OB near 2527–2492 — last line of defense before momentum flips
Right now, ETH is offering a reactive pullback opportunity. If bulls hold 2594–2575 with a bounce, we rotate higher again. But if they don’t — 2527 becomes the decision zone.
Execution lens:
Ideal re-entry zone: 2594–2575
Invalidation: sustained close below 2555 = expect OB tap
If FVG holds, expect revisit of 2658 → extension toward 2680s
This setup isn’t done. It’s developing. Wait for price to speak — not hope.
For more plays built like this — mapped in advance, not after the fact — check the profile description
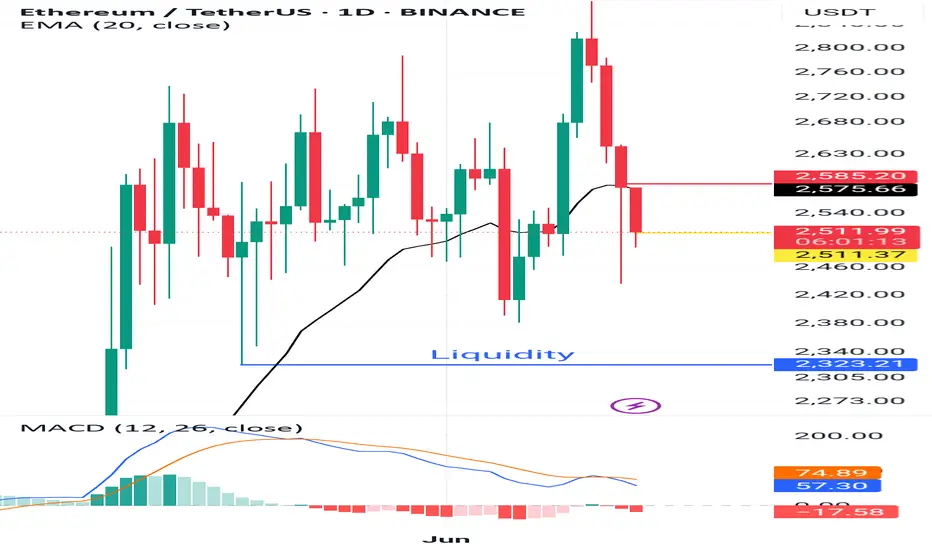
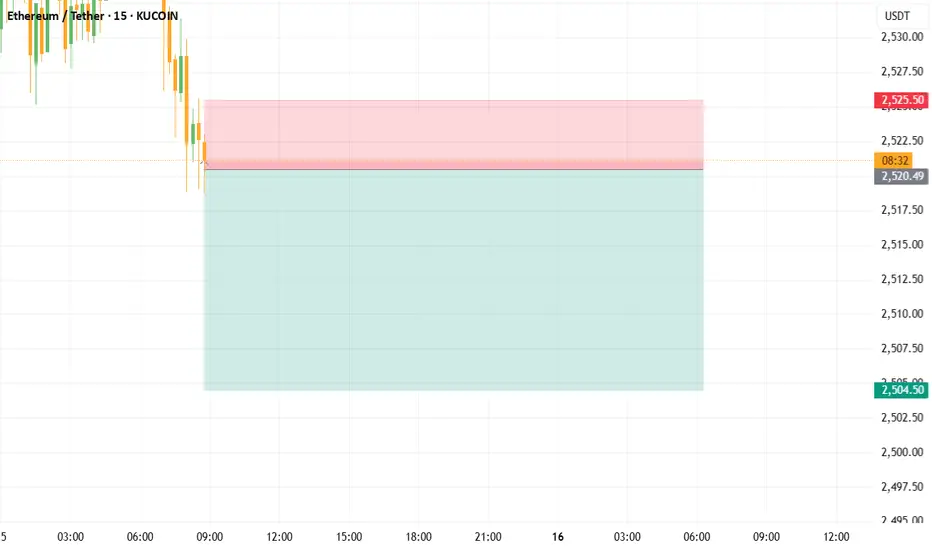
ETH-----Buy around 2530, target 2580 areaTechnical analysis of ETH contract on June 19:
Today, the large-cycle daily level closed with a small positive line yesterday, the K-line pattern was a single positive line with continuous negatives, the price was below the moving average, and the attached indicator was dead cross. The big trend of decline is still very obvious, but for now, the continuation and strength are relatively poor, which is also the reason why the price is simple and easy to wash; the short-cycle hourly chart yesterday's European market price fell and did not break down, the US market price supported the rebound, the current K-line pattern is continuous positive, and the attached indicator is golden cross, so there is a high probability that it will rise and break the high during the day.
Today's ETH short-term contract trading strategy:
Buy at the current price of 2530 area, stop loss at 2495 area, and target 2580 area;

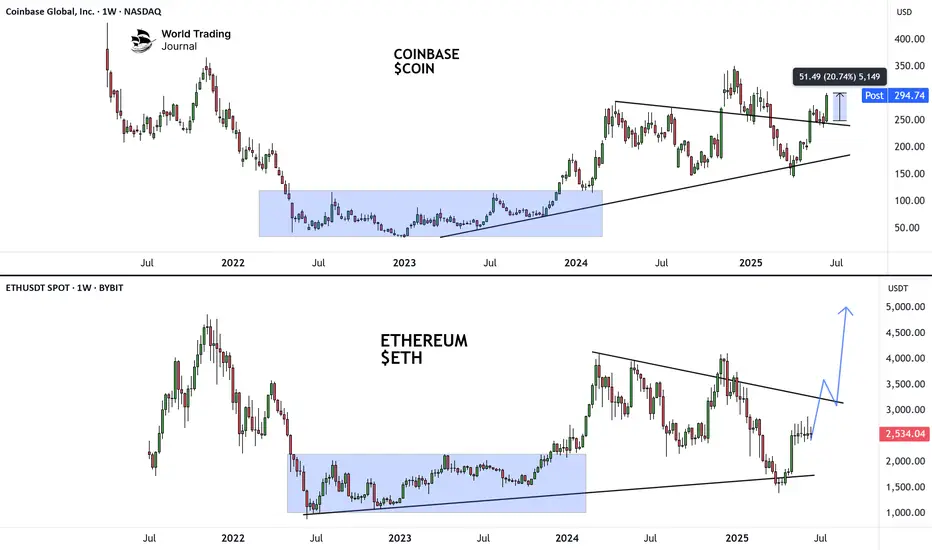
Coinbase #COIN gives a hint for crypto Coinbase #COIN gives a hint of what path awaits #ETH in the coming days
ETH TREND LINESIndicated all essential trend lines on ETH chart.
Long idea based on a bullish flag. 60/40%
Target price 3600$. Bullrun scenario.
ETH/USDTWe have talked about Ethereum many times and said that the main goal of Ethereum is 3000. Ethereum has had an upward movement and is now in a channel. The last movement it had led to a failure and it went back inside. I think Ethereum is bullish. Comment your opinion.
ETH-----Sell around 2525, target 2475 areaTechnical analysis of ETH contract on June 14:
Today, the large-cycle daily level closed with a small negative line yesterday, the K-line pattern continued to fall, the price was below the moving average, and the attached indicator was dead cross. The decline in the big trend is still very obvious, but we still have to pay attention to the stimulus brought by the news data. The low support is still around the 2300 area; the short-cycle hourly chart yesterday's European session rose and corrected the US session. The price began to retreat under pressure in the Asian morning today. The current K-line pattern is continuous and the price is below the moving average. The attached indicator is dead cross, so it is likely to continue to fluctuate downward during the day.
ETH short-term contract trading strategy:
The current price is 2525, directly short, stop loss in the 2565 area, and the target is the 2475 area;

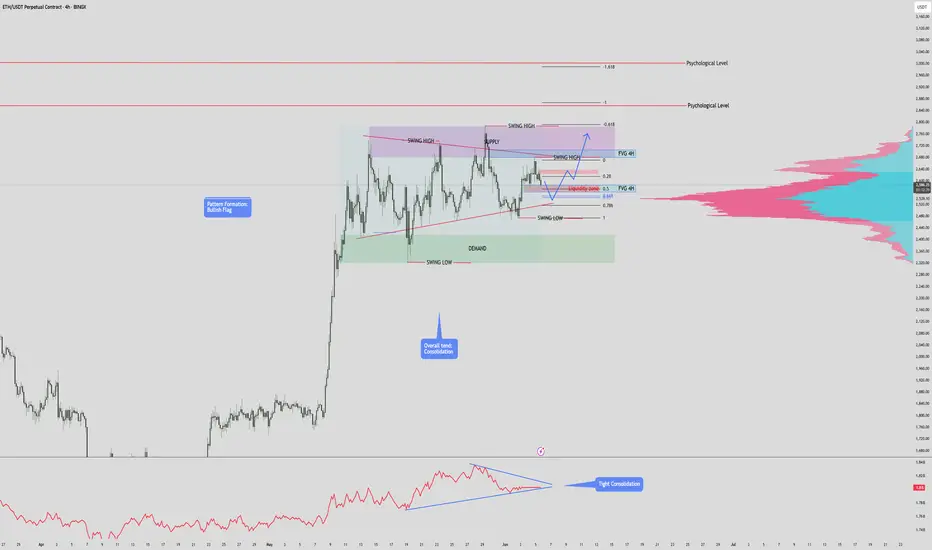
$ETH / USDT – 4H Time Frame Analysis 3,000 INCOMING?? CRYPTOCAP:ETH / USDT – 4H Time Frame Analysis
Structure: Bullish Flag | Outlook: Neutral-Bullish | Target: $3000?
🔹 Chart Overview
-Pattern: Bullish Flag (continuation structure)
Current Range:
- Supply Zone: $2,680.00 – $2,786.21
- Demand Zone: $2,319.79 – $2,417.61
Price Action:
- Tight consolidation between higher lows and lower highs, forming a symmetrical triangle within a flag structure.
Trend:
- Consolidation, but within a macro uptrend (prior strong rally).
Volume Profile:
- Anchored Volume shows high participation around $2,540–$2,600.
OBV:
- Flattening, signaling indecision and potential energy buildup.
Key Psychological Levels:
$2,860: Minor resistance from past S/R flips.
$3,000: Major round-number psychological resistance.
📐 Technical Confluences
Fibonacci Retracement:
- The 0.618 golden pocket aligns with the support trendline, reinforcing this as a critical zone.
Fair Value Gaps (FVG):
- Above Price: Acts as a magnet in bullish continuation.
- Below Price: Risk zone if price drops; aligns with liquidity and trendline support.
- Liquidity Zone: Aligned with 0.5–0.618 retracement; strong reaction expected.
📈 Bullish Scenari o
Breakout of Pennant Resistance:
- A clean break above $2,786 (supply zone & swing high) with volume.
Close above Upper FVG and Liquidity Zone:
- Confirms bullish intent. Targets psychological level at $2,860, then $3,000.
Volume Confirmation:
- OBV uptick and high breakout volume would validate the move.
Bullish Target Zones:
TP1: $2,860 (psych level + previous resistance)
TP2: $3,000 (major psychological level)
TP3: $3,120–$3,180 (1.618 Fib extension)
📉 Bearish Scenario
Rejection from Current Supply or Liquidity Zone:
- Fails to break above supply; rolls over from the upper pennant line.
Break Below Support Trendline:
- Break below golden pocket and $2,417.61 demand zone.
Invalidation of Bullish Flag:
- A breakdown below $2,319.79 (swing low) invalidates the bullish flag and may signal a trend reversal.
Bearish Target Zones:
TP1: $2,200 (local volume gap + structure support)
TP2: $2,060–$2,120 (previous accumulation zone)
TP3: $1,950 (macro support & last strong demand)
✅ Summary
Structure:
- Price is compressing within a bullish continuation pattern, awaiting breakout confirmation.
Bias: Slightly bullish unless the swing low at $2,319 is broken.
Confirmation Needed:
- Break above or below pennant boundaries with volume.
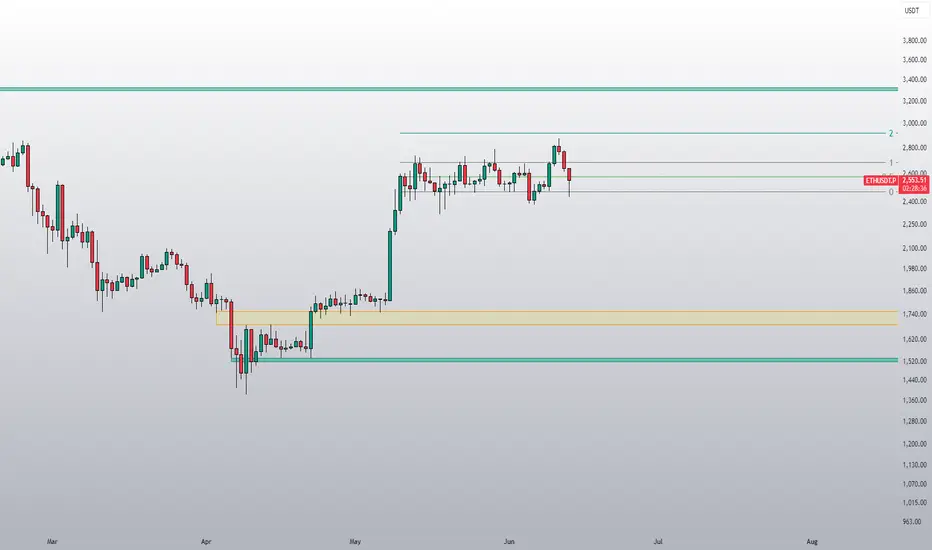
Ethereum (ETH) is still looking bullish"Spring" breakout, retest of the range low. Textbook price action on ETH!
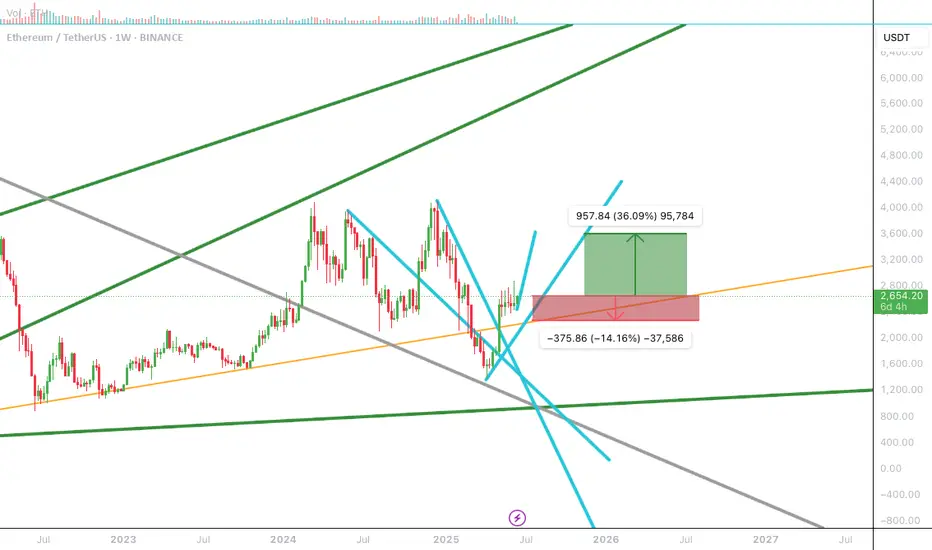
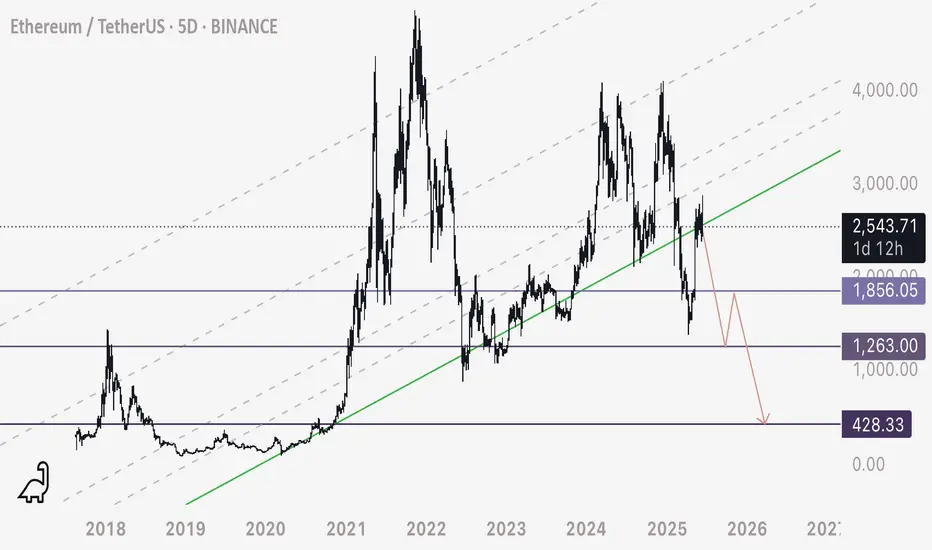
ETH - Another Take - When in Doubt, Zoom OutETH on the multi day time frame appears to have been respecting this ascending series of support / resistances since its inception.
If this resistance holds, this is a major breakdown of ETH’s last support - assuming the chart does work best on these ascending channels (certainly has historically).
Due to this I am shorting ETH at 2550 appx - and my targets are marked on the chart (3 purple levels).
I don’t see why any formation on the chart should be dismissed if it has a strong interaction historically.
Let’s see what happens.
Happy trading
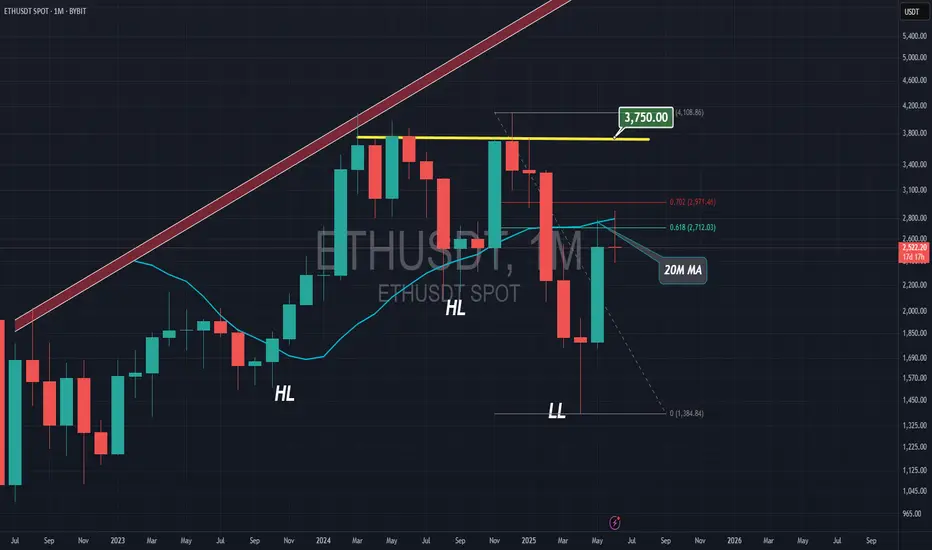
Ethereum VS $2800The 20MA on monthly timeframe for Ethereum is still working as a strong resistance, and Ethereum is running out of time to break it.
Maximum June or July..
Ethereum Set To Continue Lower, How Long?The drop is now confirmed and yet, it is still early...
Good afternoon my fellow traders, all is good when we consider the chart, Ethereum's price and the bigger picture, nothing changes. But we are witnessing a retrace. This retrace will end in a higher low and I am thinking of time now, duration.
Initially I was thinking about the Fed meeting and this event being the catalyst for change, but the Cryptocurrency market is following its own cycle and for it to be super bullish later this year, all bearish action, all weak hands, needs to be removed now, today.
So the bearish action can fluctuate between just a few days, 3-5 days, to 1-2 weeks. That's my analysis based on past history, chart data and experience.
The retrace might not last that long though, market conditions continue to improve and Ethereum might not produce a lower low compared to Bitcoin. Bitcoin is trading pretty high and a correction can develop any day. Since Ethereum is already low compared to its ATH, there is less room for prices to move lower, makes sense?
The downside is always limited, SHORTing is riskier than going LONG. It is wise to wait for a new entry before buying more. Experienced traders are recommended to SHORT. This chart setup will change in a matter of days, and then the market will turn bullish again, long-term.
Thank you for reading.
Namaste.
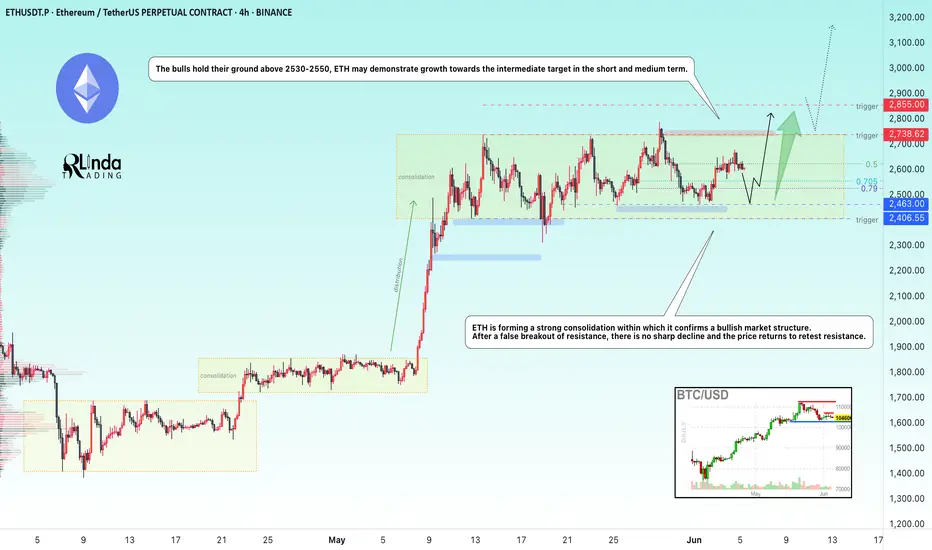
ETHEREUM → Consolidation amid a bull marketBINANCE:ETHUSD is consolidating in the range of 2400-2750, and locally, the coin looks quite promising even against the backdrop of Bitcoin forming a correction...
ETH is forming a strong consolidation within which it confirms a bullish market structure. After a false breakout of resistance, there is no sharp decline and the price returns to retest resistance.
If the bulls hold their defense above 2530-2550, then in the short and medium term, ETH may demonstrate growth towards the intermediate target.
Resistance levels: 2738, 2855
Support levels: 2525, 2470, 2400
A retest of support at 2525 - 2470 is possible, and if the price holds above this support zone, ETH may try to surprise us. There are good chances for growth.
Best regards, R. Linda!
ETHEREUM Potential Bullish BreakoutEthereum price seems to exhibit signs of overall potential Bullish momentum if the price action forms a prominent Higher High with multiple confluences through key Fibonacci and Support levels which presents us with a potential long opportunity.
Trade Plan:
Entry : 2950
Stop Loss : 2200
TP 1 : 3700

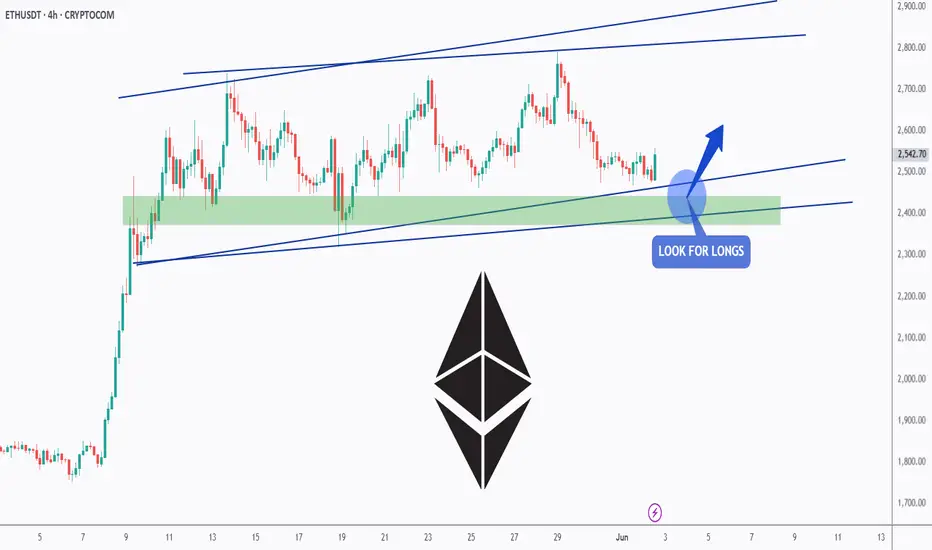
ETH - Finally Support!Hello TradingView Family / Fellow Traders. This is Richard, also known as theSignalyst.
📈ETH has been overall bullish trading within the flat rising channels marked in blue.
Moreover, the green zone is a strong support zone!
🏹 Thus, the highlighted blue circle is a strong area to look for buy setups as it is the intersection of support and lower blue trendlines acting as non-horizontal support.
📚 As per my trading style:
As #ETH approaches the blue circle zone, I will be looking for bullish reversal setups (like a double bottom pattern, trendline break , and so on...)
📚 Always follow your trading plan regarding entry, risk management, and trade management.
Good luck!
All Strategies Are Good; If Managed Properly!
~Rich
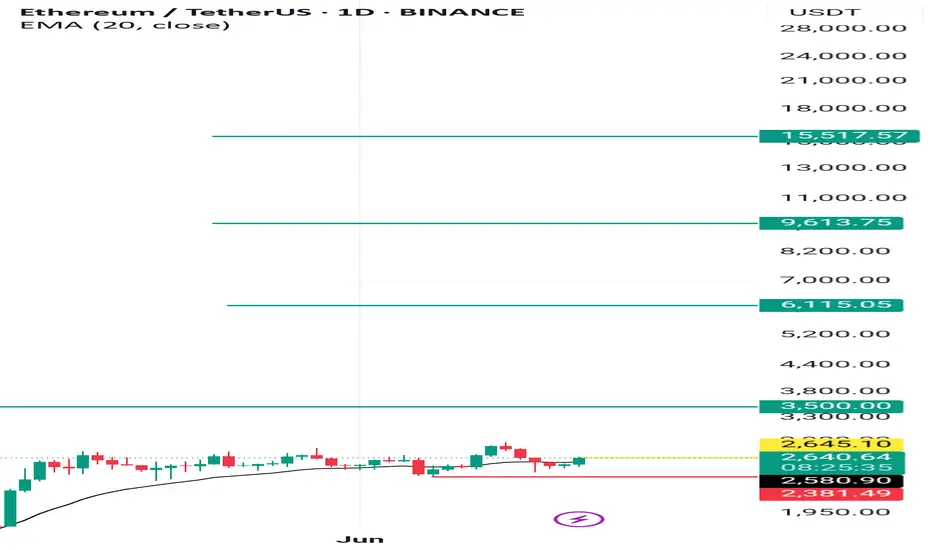
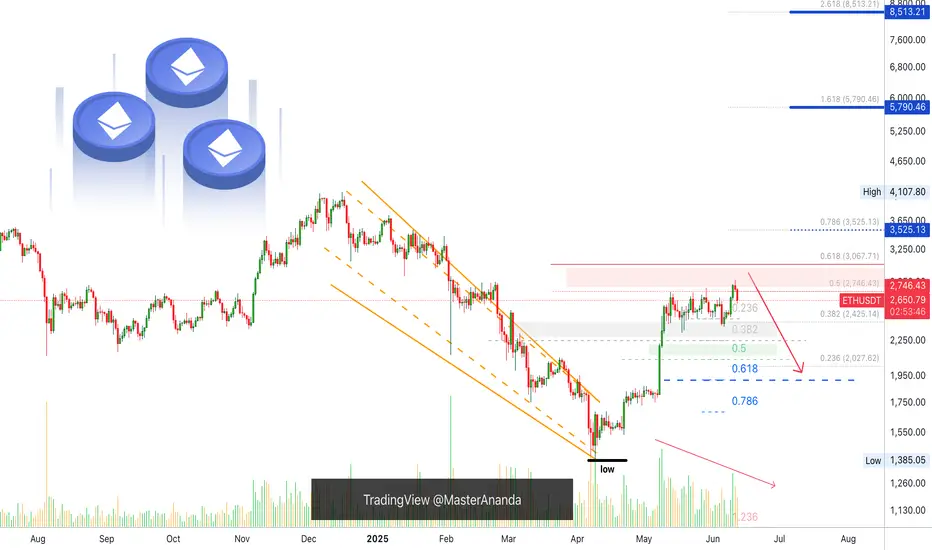
Ethereum's Price Action Reveals A Bullish Bitcoin, $8,513 Next!The strongest possible bullish signal has been confirmed. Ethereum just moved daily above MA200. This is the first time this happens coming from a low point since November 2024, this is massive.
This signal reveals two things: (1) Bitcoin is bullish and set to continue growing. You've never seen Bitcoin and Ethereum going in different directions. If Ethereum is set to continue up, Bitcoin will also do the same. The market is one. (2) Ethereum is now ready to grow for 6 months straight, minimum, and this opens the doors for $5,790 followed by $8,513 in this bullish wave. There can be more of course.
This is one of the strongest signals (MA200) but also one of the easiest to spot. It works with high accuracy, never fails. The market is bullish when the action happens above this indicator long-term.
So now you know, for sure—for certain, what will happen next. Knowing that Ethereum will be trading above $5,000 soon, how are you going to maximize profits from this knowledge? Do what it takes to increase your profits and trading success. This is the opportunity of a lifetime, it can be life changing.
Thank you for reading.
I am wishing you tons of profits, great luck and amazing success.
Namaste.