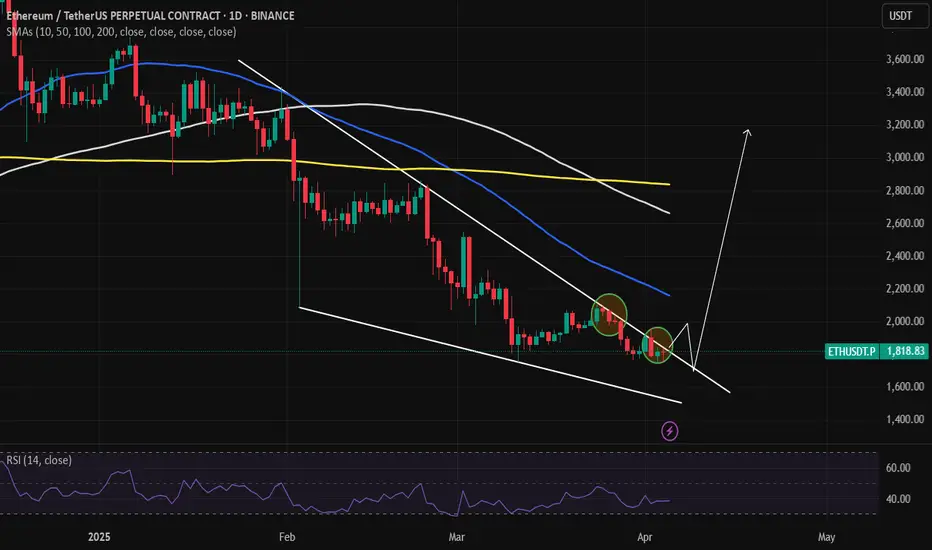
Multiple resistance tests in a fully formed falling wedge As we can see right here, there has been multiple touchdowns in the upper trend line of the huge falling wedge. This might indicate a break above and retest and going forward. Even there are some pretty decent bullish divergences on lower time frames as well.
ETHUSDT.3S trade ideas
Very nice long position on ETHAll is on the chart, we can try a long from here because there is an old restance trend line that is becomed a very good support, after tht we have in green rectangle forming a good support for eth, max leverage 10x even if i suggest 5x, please let me know what you think, last idea on ETH was a falling wedge and i did a big profit with 10k leveraged x10, let me know what do you think guys?? thanks a good monet for everybody

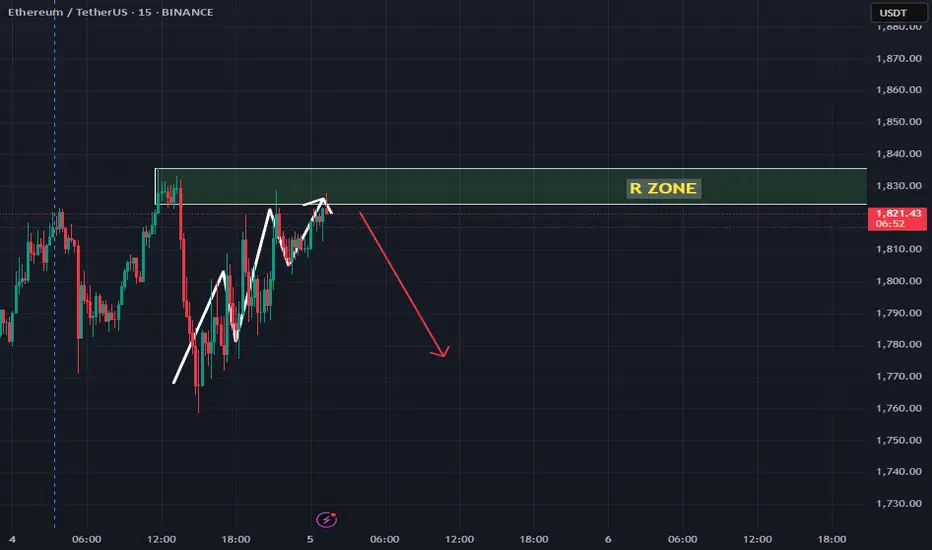
ETHUSDT NEXT MOVESell after bearish candle stick pattern, buy after bullish candle stick pattern....
Best bullish pattern , engulfing candle or green hammer
Best bearish pattern , engulfing candle or red shooting star
NOTE: IF YOU CAN'T SEE ANY OF TOP PATTERN IN THE ZONE DO NOT ENTER
Stop lost before pattern
R/R %1/%3
Trade in 5 Min Timeframe, use signals for scalping
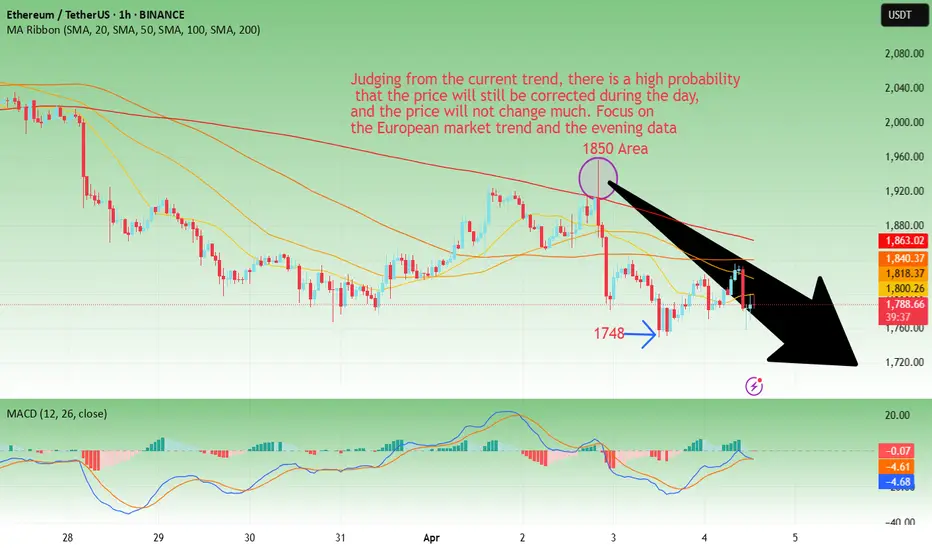
ETH-----Sell around 1825, target 1750 areaTechnical analysis of ETH contract on April 4: Today, the daily level of the large cycle closed with a small positive line yesterday, and the K-line pattern was a single positive line with continuous negative lines. The price is still below the moving average and is obviously suppressed. The fast and slow lines of the attached indicator continue to close negative today, so the pattern will cross downward. Therefore, the general trend remains unchanged and continues to be bearish. Trading remains short-term and risk control is done well; the short-term price decline yesterday broke the previous low of 1750, but did not continue. The current price fluctuates within the range and there is not much movement. From the perspective of various technical indicators, the four-hour chart is a continuous negative line, and the intraday price is suppressed, so the trend is still bearish, and the previous correction high is near 1850.
Today's ETH short-term contract trading strategy: sell at the 1825 area, stop loss at the 1855 area, and target the 1750 area;
#ETH #ETHUSDT #ETHEREUM #LONG #SWING #Analysis #Setup #Eddy#ETH #ETHUSDT #ETHEREUM #LONG #SWING #Analysis #Setup #Eddy
ETHUSDT.P Swing Long Analysis & Setup
Important area of the upper time frame for swing are identified and named.
This setup is based on a combination of different styles, including the volume style with the ict style.
Based on your strategy and style, get the necessary confirmations for this Swing Setup to enter the trade.
Don't forget risk and capital management.
The entry point, take profit point, and stop loss point are indicated on the chart along with their amounts.
The responsibility for the transaction is yours and I have no responsibility for not observing your risk and capital management.
🗒 Note: The price can go much higher than the second target, and there is a possibility of a 500% pump on this currency. By observing risk and capital management, obtaining the necessary approvals, and saving profits in the targets, you can keep it for the pump.
⚠️ Warning : The stop loss is dramatic and large. Place the stop loss based on your strategy and after getting entry and confirmation on the entry point behind the last shadow that will be created. (( This is just my opinion and is not meant to be 100% correct, so be careful with your capital. ))
Spot Investing : ((long 'buy' position)) :
🟢 Entry 1 : 1800
🟢 Entry 2 : 1500
First entry point calculations :
⚪️ SL : 1370 ((23.89%))
⚫️ TP1 : 4500 ((150%))
⚫️ TP2 : 5000 ((177.78%))
⚫️ TP3 : 8000 ((344.44%))
⚫️ TP4 : 10000 ((455.56%))
‼️ Futures Trading Suggested Leverages : 3-5-7
The World Let it be Remembered...
Dr. #Eddy Sunshine
4/4/2025
Be successful and profitable.
Do you remember my first Ethereum swing long signal?
My first swing long signal was provided on Ethereum, which was spot pumped by more than 100% and was profitable :

1:3 RR ETH SHORTI just found it as a good trade
ETH needs more Liquidity so I prefer to sell instead of buy
Good Luck

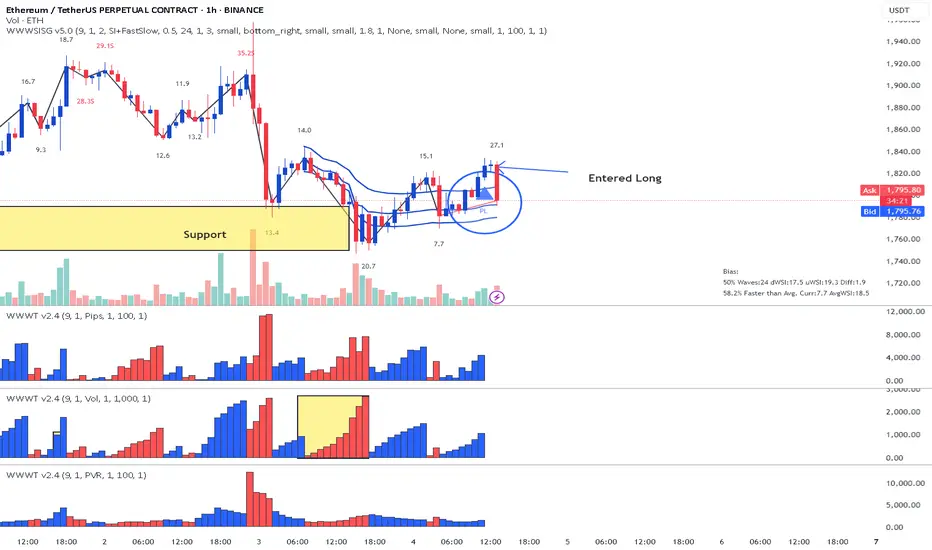
Ehtereum (ETH) - Entered Long based on Lesson 15Lesson 15 Methodology;
1.Support Level
2. Largest Down wave after a while (Buyers possible entering)
3. Placed AVWAP and wait to cross upwards and pullback
4. Enter on Plutus signal Long in this case PL
Divergences Everywhere — Bears Want You Out! Hello Traders 🐺
This is a short and quick emergency update for ETH, because I personally think that we are about to see a massive reversal in the market, especially in the Altcoin section:
1_ Falling wedge: ETH is inside a falling wedge pattern just like BTC. They have the same pattern and also we have clear signs of bottoming out for both of them.
2_ Bullish divergence on the Daily chart: If you pay close attention to the RSI, you can see that we have a massive bullish divergence and this means breakout is so imminent for ETH, and this is going to be to the upside rather than downside, because honestly we are about 60% down from the ATH price — which in my opinion is enough correction for bulls to come back and take control.
3_ BTC.D is about to top out: If you saw my last idea about it, you know that we have a very huge bullish divergence — not on the daily, not even on the weekly! We have it on the monthly chart!!! That's f..king enough to be extremely bearish on BTC.D and be over bullish on ETH and Alts as well.
4_ ETH/BTC is very close to the monthly support and demand area: I will publish a complete idea about it because this is beyond the current idea and I have to explain it in detail.
Oh right guys, I hope you make the right decision — and also always remember:
🐺 Discipline is rarely enjoyable, But almost always profitable 🐺
🐺 KIU_COIN 🐺

Ethereum (ETH): Losing Important Zones, We Might Fall To $1,500This last couple of months has been really hard for Ethereum, where we saw ay ATHs and currently we are not seeing any proper signs of recovery where usually after Bitcoin market dominance the volume flows into Ethereum.
Nevertheless, while we see a chance that price will dip more down, we are still looking for a recovery here.
Our points of interest are both the $1,900 zone and the $1,500 zone, where most of the liquidity is lying currently. As long as we are above $1500, we are bullish on Ethereum, but currently we see how weak the markets are so we wait for proper support to form!
Swallow Team

Ethereum (ETH): Most Important Zone For EthereumWe are in one of the most important zones for Ethereum, where we are looking for 2 possible scenarios currently.
1) Ideally we should see a buying volume to build from here, which would give us a good buying opportunity once we see an MSB to form on smaller timeframes.
2) If sellers keep this kind of dominance, we will fall to a lower size of our zone, which is $1,500.
Currently, Monday has been pretty weak so we might have to wait more for a proper support zone to form but keep your eyes on EMAs; they are way too far from the market price, which usually means a possible quick movement can happen!
Swallow Team

Ethereum (ETH): Price Struggles To Establish Support Zone.As we monitor the markets, ethereum has dipped nicely to our second bottom, but we got close to our sell entry zone here, which is showing the great dominance of sellers.
As we enter the weekend market, we most probably will see some volatility, but nevertheless, we wait for one of our entries to be broken and secured (properly re-tested).
Swallow Academy

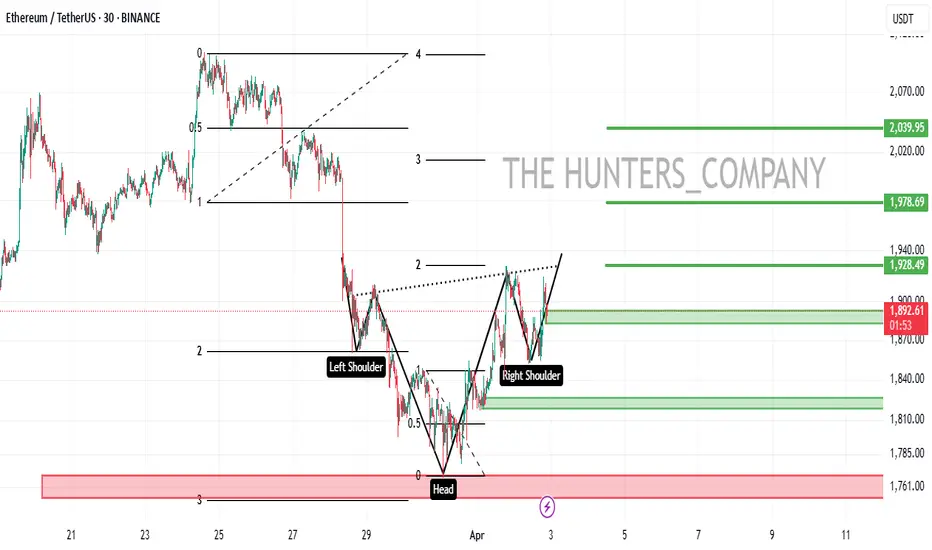
ETH/USDT:UPDATEHello dear friends
Given the price drop we had, a head and shoulders pattern has formed within the specified support range, indicating the entry of buyers.
Now, given the good support of buyers for the price, we can buy in steps with capital and risk management and move towards the specified targets.
*Trade safely with us*
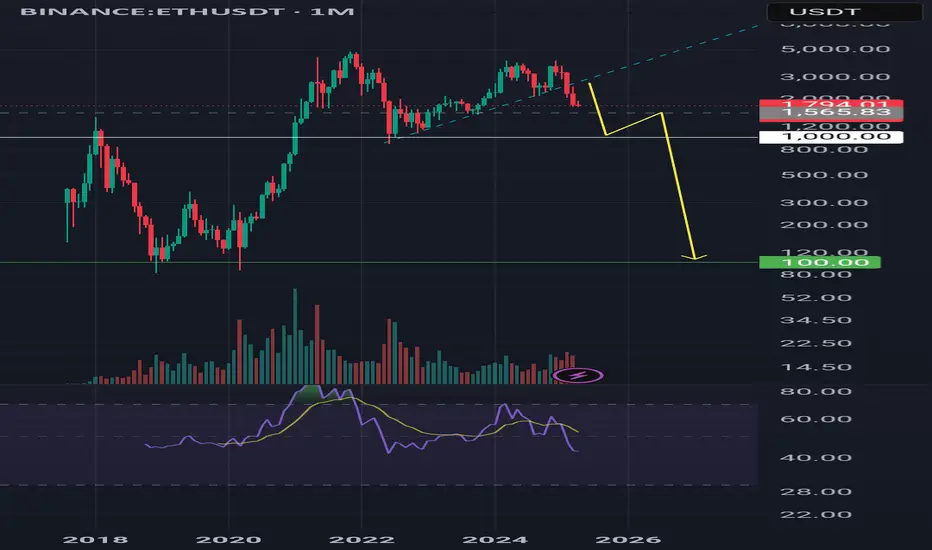
Is Ethereum dying?Ethereum is expected to fall to $1,000 support after breaking its dynamic support line and if there is no support at this price, it will drop to $100
FALLLLLLLIIIING ETHUSD.PDoes not need any descriptions... :)
the target level is the level of unfilled orders remains from old days ...

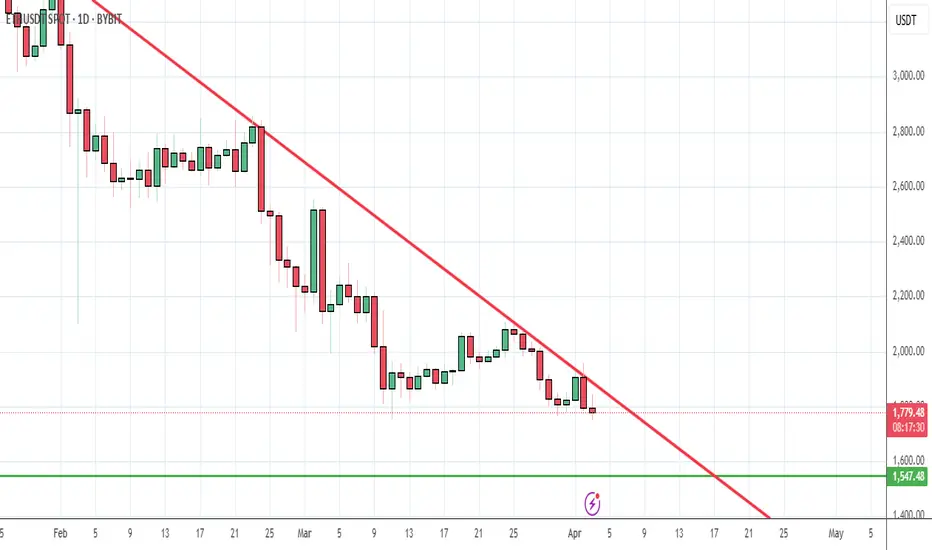
ETH heads for goblin townETH is heading for goblin town of $1540 as there's no support on the daily; the nearest major support is $1540 on the weekly chart. Look to enter $1860ish, but could wick up, so don't overleverage
ETH-----Sell around 1840, target 1770-1750 areaTechnical analysis of ETH contract on April 3: Today, the large-cycle daily line level closed with a medium-yin line yesterday, the K-line pattern was a continuous Yin and a single Yang, the price was below the moving average, and the attached indicator was dead cross, so there was no problem with the trend and it was still falling significantly, but the trend this week was more volatile, and it was greatly stimulated by the news and data. The rhythm of trading is very important; the four-hour chart is the focus, the current K-line pattern is a continuous Yin, the attached indicator is dead cross, the morning fell, and the correction was made during the day. It was just corrected to the 1845 area near the moving average pressure position, so we still have to focus on the price continuing to break in the European session. In addition, the same anti-pull strength cannot be large, otherwise it will still fluctuate.
Therefore, today's ETH short-term contract trading strategy: sell directly at the current price of 1840, stop loss in the 1870 area, and target the 1770-1750 area
