"ETH Bullish Heist: MA Breakout Confirmed! Next Stop 3600?"🔷🔹 "THE ETH HEIST: MASTERPLAN TO LOOT 3600!" 🚨💰 (Breakout + Pullback Strategy)
🌟 Yo, Fellow Market Robbers! 🌟 (Hola! Bonjour! Salaam!)
Listen up, Money Makers & Thieves! 🏴☠️💸
Based on the 🔥Thief Trading Style🔥, we’re about to pull off the ultimate ETH/USDT heist—Ethereum vs Tether is our target!
🔪 THE TRADE SETUP (LONG HEIST)
🎯 Entry Signal:
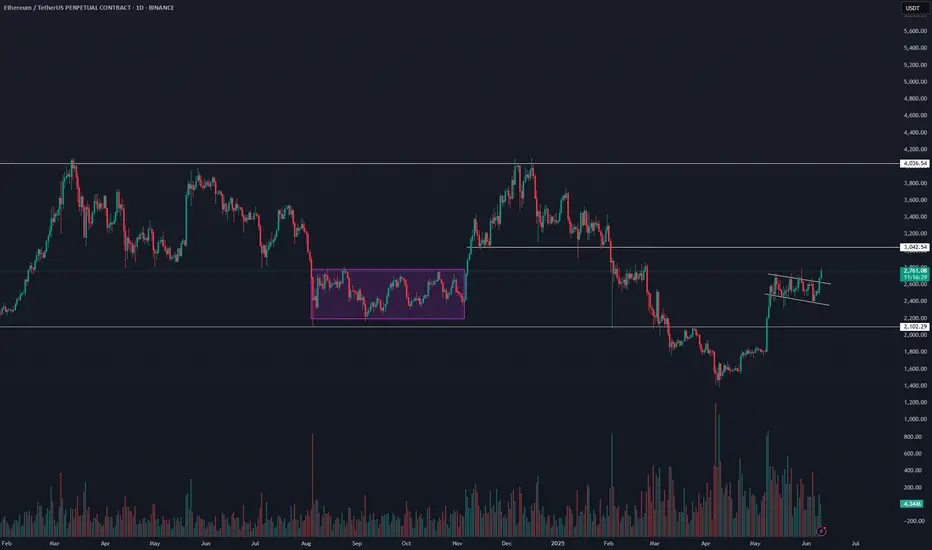
"The heist begins at MA Breakout (2900)! Wait for confirmation, then strike like a pro thief!"
Option 1: Buy Stop above MA (2900) for breakout momentum.
Option 2: Buy Limit on pullbacks (15-30min TF) for sneaky low-risk entries.
📌 ALERT! Set a breakout alarm—don’t miss the robbery!
🛑 Stop Loss (Thief’s Escape Route):
"Yo! If you’re entering on breakout, DO NOT set SL before it triggers! Place it at the nearest swing low (12H TF)—or risk getting caught by the bears! 🐻🔪"
🎯 Profit Target: 3600 (OR Escape Early!)
Scalpers: Only long scalps allowed! Use trailing SL to lock profits.
Swing Thieves: Ride the wave but exit before the cops (bears) arrive!
⚡ WHY THIS HEIST WILL WORK:
Bullish momentum + MA Breakout = Easy Loot!
Overbought? Trap? Reversal? Nah—we escape before the danger zone! (Yellow ATR = High Risk)
📢 THIEF’S WARNING:
🚨 News Alerts = Market Chaos!
Avoid new trades during high-impact news.
Trailing SL = Your Best Friend.
💥 BOOST THIS HEIST!
👉 Hit 👍 LIKE & 🔔 FOLLOW to strengthen our robbery squad! More heists = More profits! 🚀💰
Stay tuned, thieves… Next heist coming soon! 🏴☠️🔥
ETHUSDT.3S trade ideas

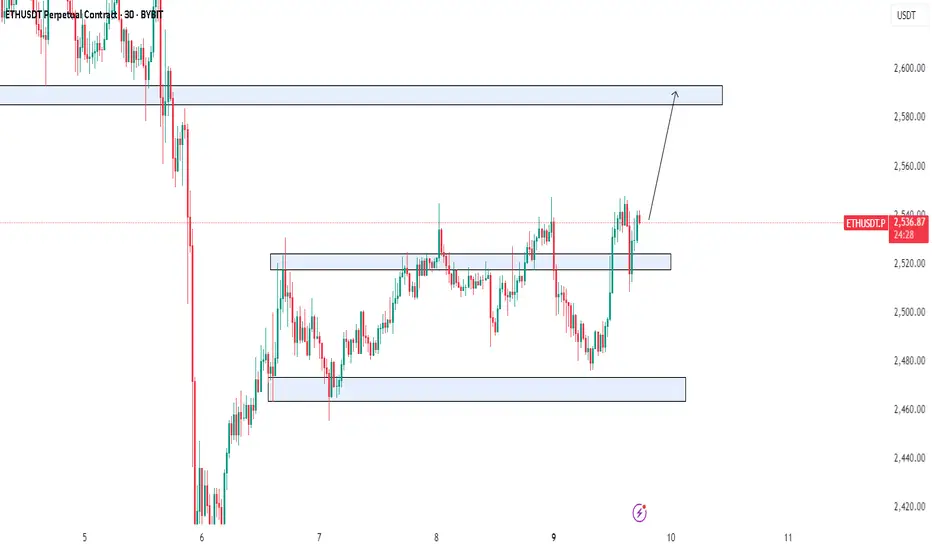
ETH 4HETH managed to pass the box it was moving horizontally upwards and is expected to rise as much as the box size. I expect it to move as I indicated with the arrow sign on the chart.
ETH Road to RecoveryWhile the spotlight often shifts to short-term price action, Ethereum (ETH) is laying the groundwork for structural expansion that could surprise even seasoned investors.

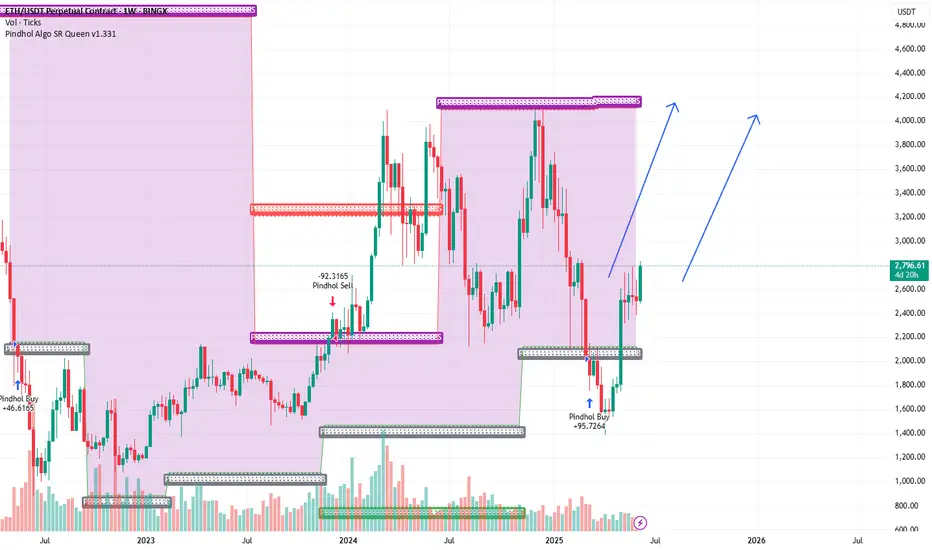
Bad Time Over for ETH? Second Wave Toward $4,000 Incoming!!🟢 Bad Time Over for ETH? Second Wave Toward $4,000 Incoming
MARKETSCOM:ETHEREUM ( CRYPTOCAP:ETH ) appears to be leaving its consolidation phase behind, and all signs point to a fresh bullish wave. After outperforming Bitcoin in recent days, CRYPTOCAP:ETH has now broken out of a key structure — signaling the potential start of a major uptrend.
We’re also witnessing rising CRYPTOCAP:ETH inflows, suggesting growing investor confidence. This kind of accumulation behavior has historically led to significant rallies. Previously, ETH consolidated between $1700–$1800 before a strong move up. More recently, it ranged between $2400–$2700, and now that it’s broken out, we’re anticipating another powerful leg — possibly the second wave of this trend.
If the current momentum continues, a move toward $4000 looks likely, and with enough strength, even a new all-time high isn’t off the table.
BINANCE:ETHUSDT Currently trading at $2795
Buy level : Above $2750
Stop loss : Below $2305
Target : $4000
Max leverage 3x
Always keep stop loss
Follow Our Tradingview Account for More Technical Analysis Updates, | Like, Share and Comment Your thoughts

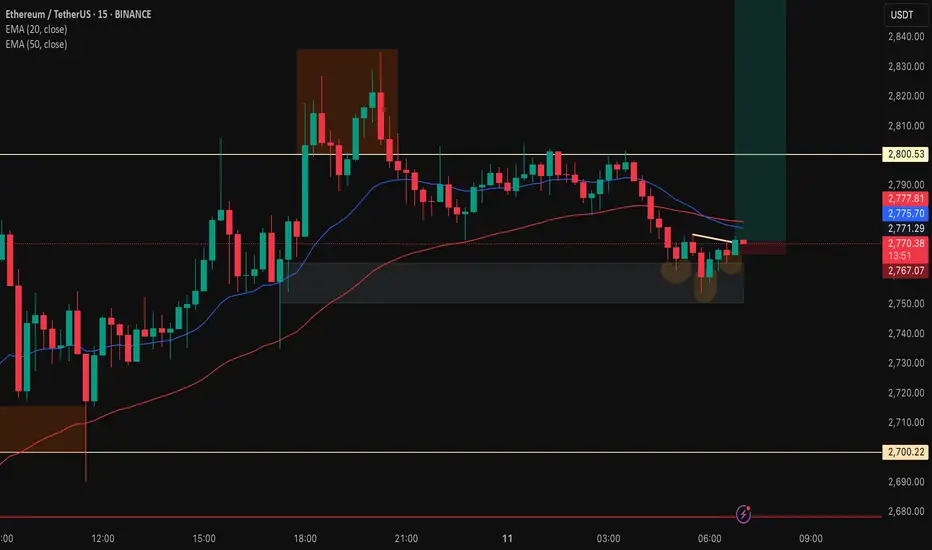
ETH to 3000?price pierced through $2800 decisively yesterday and is now retracing back into the mid 2700s.
Im looking for divergence and reversal patterns on the smaller time frames (intraday) to execute a continuation long.
eth 4h
eth is in the distribution zone and the price is expected to move in the direction it broke out of the box. I have shown the levels it can go to in the graph in which direction it breaks the box. Lots of profits.
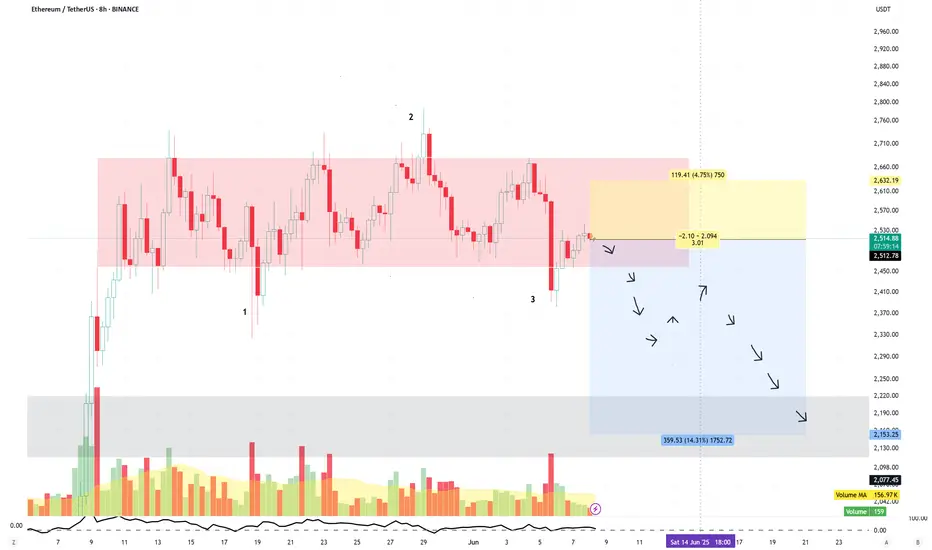
Short ETH
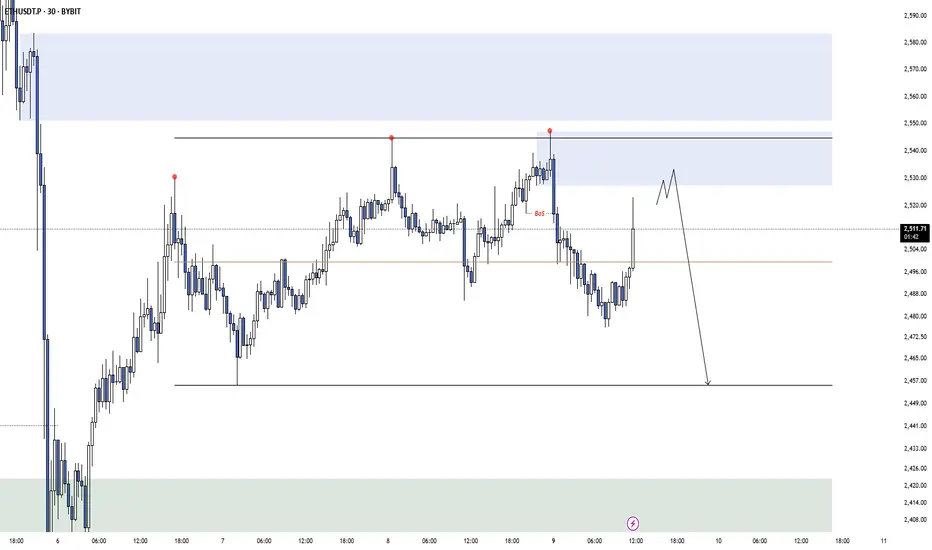
ETH has been consolidating below the key resistance level at $2,700.
On the 8-hour timeframe, price action suggests the formation of a potential distribution schematic 1-2-3.
A short setup is illustrated on the accompanying chart.
Disclaimer:
This analysis is based on my personnal views and is not a financial advice. Risk is under your control.
ETHUSDT – 5-Month Bullish Boom Incoming🚀 ETHUSDT – 5-Month Bullish Boom Incoming! | Ethereum Price Prediction
📈 Chart: ETHUSDT | Timeframe: 1D | Outlook: Bullish
🔍 Overview
Ethereum (ETHUSDT) is setting up for a major breakout and could rally significantly in the next 5 months (June to October 2025). With strong technical support, improving on-chain metrics, and bullish macro sentiment, Ethereum might be preparing for a massive upward move.
📊 Technical Analysis
✅ EMA Support:
ETH is currently holding strong above the 200-day EMA, confirming a bullish long-term trend.
✅ Ascending Triangle Formation:
We’re seeing a clean ascending triangle forming on the daily chart, with resistance around $3500. A breakout could target $4000–$5,200 levels.
✅ Volume Spike + RSI Confirmation:
Recent buy-side volume spikes combined with an RSI above 60 suggest renewed momentum. We may see continuation once ETH breaks above resistance.
🧠 Fundamental Factors
💡 Ethereum 2.0 and Scaling Improvements:
Continued upgrades to the Ethereum network (like Danksharding) could boost confidence and drive new adoption.
💡 Institutional Interest:
BlackRock, Fidelity, and other major players are increasing their exposure to Ethereum-based ETFs and DeFi projects.
💡 Altcoin Season Rotation:
As BTC dominance slows, capital may rotate into ETH, pushing price upward aggressively in the coming months.
🎯 Price Targets
Target Price Level Timeline
TP1 $3,500 July 2025
TP2 $4,200 August–September 2025
TP3 $5,100 December 2025
🛑 Invalidation Level
A daily close below $3,100 would invalidate this bullish thesis and suggest reevaluation.
🗣️ Conclusion
Ethereum is coiling up and looks ready for a powerful move to the upside. If it breaks the $4K level with strong volume, expect ETH to fly. Keep an eye on macro factors and network upgrades.
💬 Let me know your thoughts! Do you think ETH can hit $6K by October? Drop a comment and don’t forget to like if you agree!
#ETH #ETHUSDT #Ethereum #CryptoAnalysis #Altcoins #Bullish #Crypto2025 #EthereumPricePrediction #TradingViewIdeas
ETHUSDT UPDATELooking at the ETH daily chart, we see a flag formation. If it breaks, it could take us to 3500.

ETH – System Trigger Hit
ETH on the 12H has just reclaimed the green line: resistance from the previous tops.
This level sits roughly midway between the 0.5 and 0.382 Fib levels, with \$3000 now looking closer than \$2500.
PSAR has just flipped above the last tops, and price is now above MLR > SMA > BB center > 200MA.
All system conditions are met for a long entry on this timeframe.
This also comes as confirmation of the daily signal entry at today closing
Always take profits and manage risk.
Interaction is welcome.

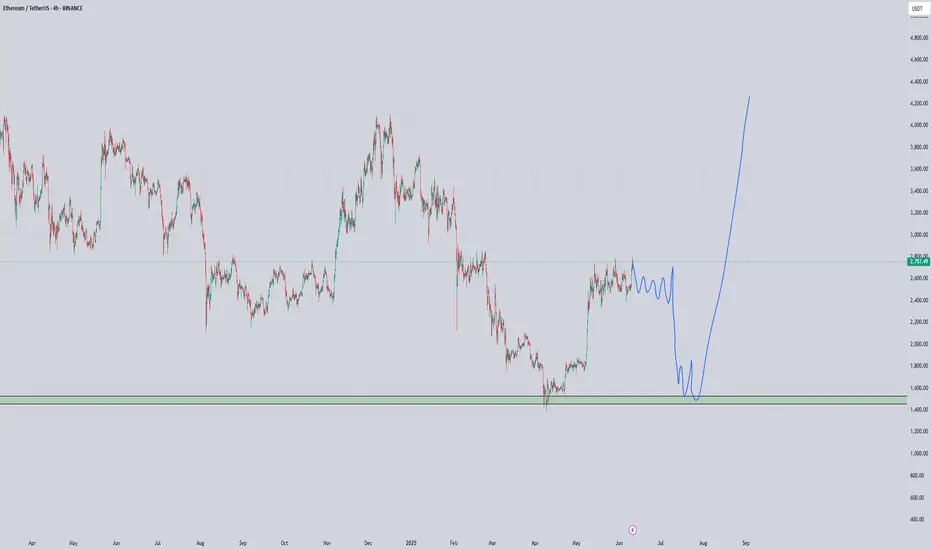
ETH - mega dump and mega ultra pumpI found a fractal for Bitcoin, and Ethereum is currently similar to it. If we want to see a truly strong upward movement, then there is a high probability of such a helicopter, as similar situations have already occurred before the strongest growth.
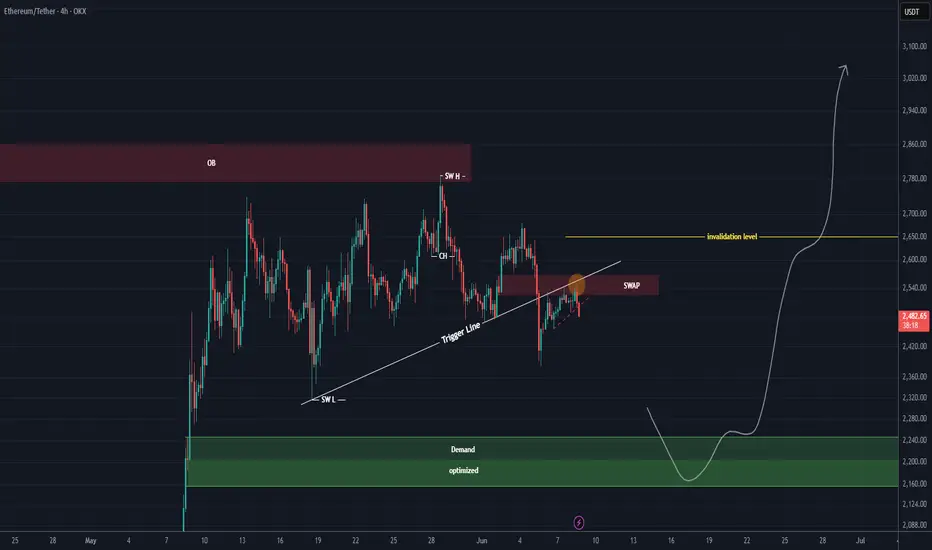
ETH NEW UPDATE (4H)This analysis is an update of the analysis you see in the "Related publications" section
Inside the red zone from the previous analysis, there was also a SWAP zone that price reacted to. The pullback trendline has also been broken. After re-evaluating the chart, the best area for a potential re-entry is the $2,165 to $2,250 range.
Do not enter a position without a proper setup and risk management | you could easily become market maker bait.
A daily candle close above the invalidation level would invalidate this bearish scenario.
For risk management, please don't forget stop loss and capital management
Comment if you have any questions
Thank You
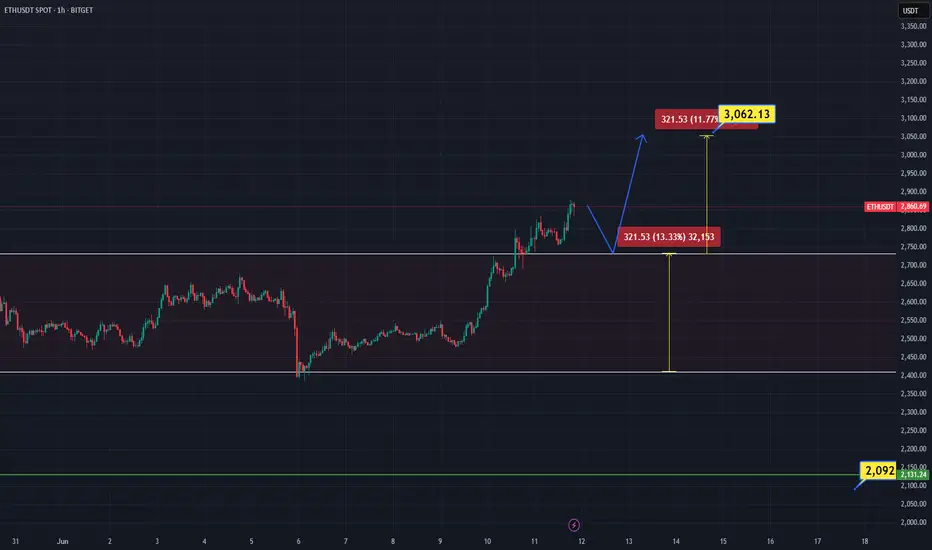
Ethereum breaking out!Two days ago, I've posted that we're most likely trading in a 2K-4K range on Ethereum. There was a slight deviation below 2K but the bulls swiftly regained control.
As for now, it's seems obvious we are heading towards, at least, 3K. I'm confident 4K is on the horizon, though I prefer to take it level by level.
ETH is breaking out off this bull flag and this chart looks more and more like one of those charts you study in textbooks.
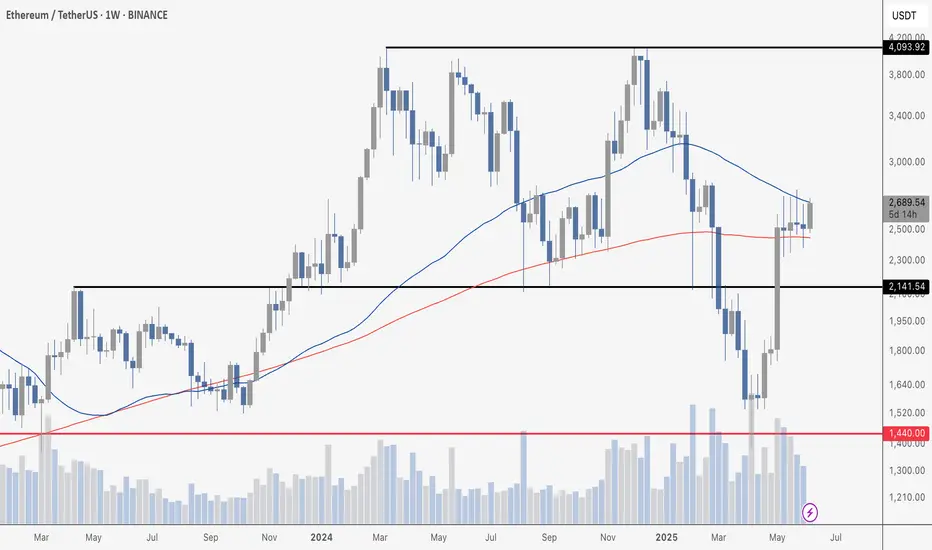
ETHEREUM LOOKS READY TO POPEthereum is in an interesting spot. It is sandwiched between the weekly 50 and 200 MAs, both key areas to watch on any chart. It has been trading between these lines for the better part of 6 weeks, astounding compression and consolidation. A close above the 50 would signal major upside is likely, while a close back below would mean this run is likely over. As you can see, we have wicks on almost every candle testing each.
My bias is up.
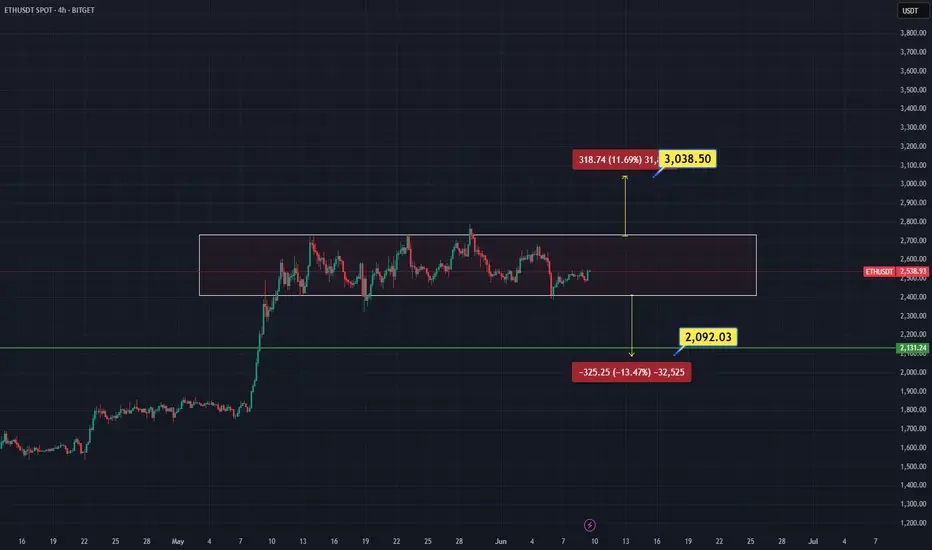
Ethereum Consolidates in Tight Range – Breakout Imminent?Ethereum has been trading within a defined high time frame range between $2,400 support and $2,800 resistance for nearly a month, dating back to May 12. This prolonged sideways action indicates a consolidation phase that could either be accumulation or distribution—depending on how price reacts to the edges of the range.
The most notable aspect of current price action is the steady decline in volume. As volume drops, volatility tends to compress, increasing the probability of an eventual breakout. However, for any breakout to be validated, it must be supported by a significant surge in volume. A weak breakout without follow-through volume risks a deviation that traps traders and reverts back into the range.
Structurally, Ethereum remains bullish. The broader trend is still intact, with price forming higher highs. A pullback from current levels into the lower boundary of the range could present a chance for a higher low to form, offering further confirmation of trend continuation. Alternatively, an upside breakout from this range—without a deeper pullback—would still be valid, provided it’s volume-backed.
For now, Ethereum remains in a holding pattern. Traders should be patient and wait for a clear move beyond either $2,800 or $2,400 with volume confirmation before taking directional trades. A break above $2,800 could trigger bullish continuation, while a break below $2,400 would shift structure and suggest deeper downside risk

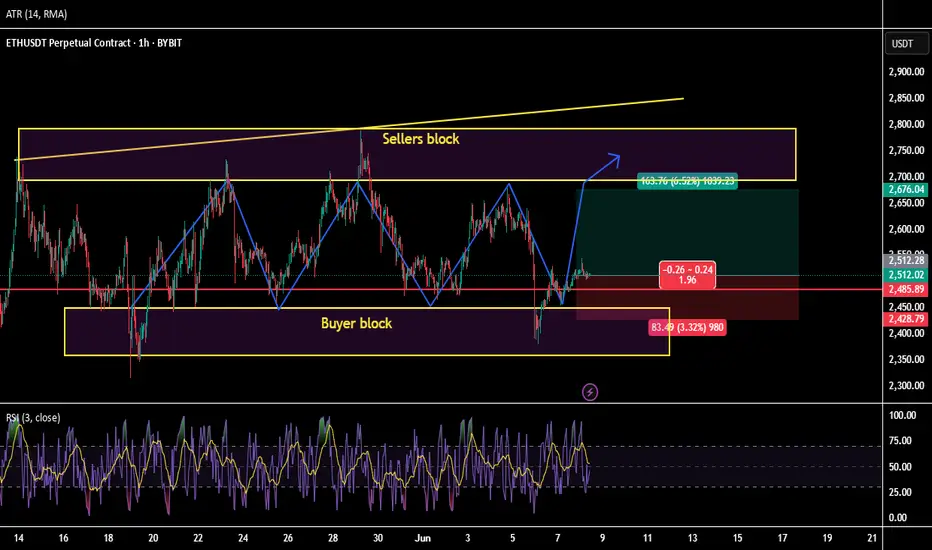
ETHUSDT/ Swing between blocks.Ethereum is moving towards the block. Volumes indirectly confirm the strength of buyers.
RR of the deal is greater than 2.
ETH is going for itAfter reclaiming the range, now the breakout on the daily RSI. Everything looks set for ETH.

ETH/USDT possible breakout and buy continuationThe price hasn't made any new lows and is showing strong signs of buy trend continuation....since it already made a break and return to the zone its a possibility of a nice late trade.
ETH SELL SIGNAL 🚨 ETH SELL SIGNAL 🚨
Ethereum is flashing red on the charts! 🔻
📉 Target: $2496
High-probability setup based on price action + volume dynamics.
Perfect time to lock in gains or short the dip! 💰
Follow for more real-time crypto signals, smart entries, and profit-taking strategies. 🚀
#ETH #Ethereum #CryptoSignals #SellSignal #TradingView #CryptoTrader #Altcoins #ETHAnalysis
ETH DistributionThere is a potential extended model 1 going over into a model 2 on ETH. I look for entries at this extreme supply. The supply above and the speed its coming up is not optimal so let's see what happens.
ETH/USDT Price Action Analysis — Bullish Continuation Expected 📊 ETH/USDT Price Action Analysis — Bullish Continuation Expected 🚀
🔍 Chart Overview (as of June 9, 2025):
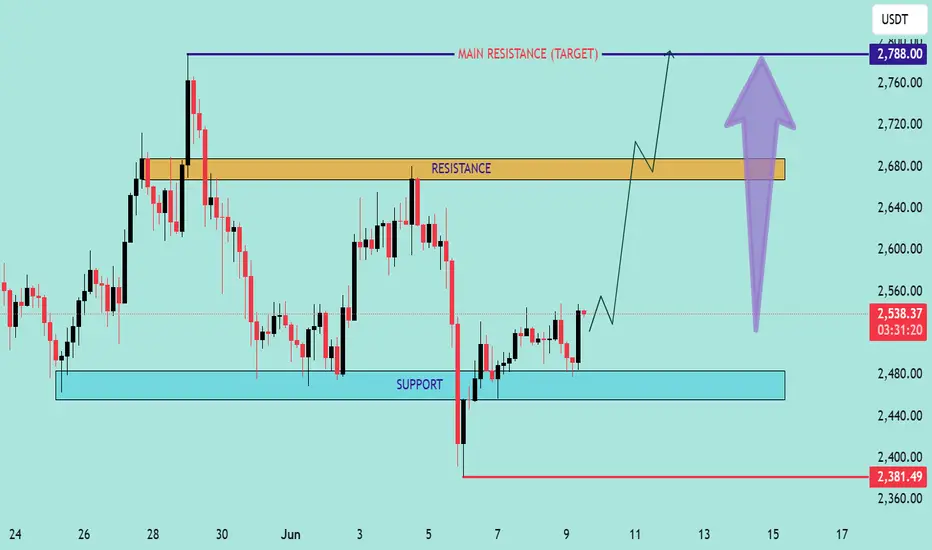
This chart of ETH/USDT highlights a well-defined support and resistance structure, projecting a potential bullish move toward a main resistance target at $2,788.00.
🧱 Key Zones:
🔵 Support Zone: $2,440 – $2,480
Price rebounded strongly from this area, showing buyer interest and liquidity absorption.
🟠 Resistance Zone: $2,660 – $2,690
Previously rejected zone where supply overtook demand. Price must break and hold above this for further upside.
🔺 Main Resistance Target: $2,788.00
If resistance is cleared, this is the next major supply area, acting as a potential take-profit level.
📈 Price Action Insight:
Price is currently hovering near $2,538.37, approaching resistance.
The chart suggests a potential breakout scenario after a short consolidation.
A bullish breakout above $2,690 could trigger a sharp rally toward the $2,788 target.
The chart projects a pullback-retest pattern (break, retest, and continuation) before the final leg up.
⚠️ Risk Management:
Invalidation Level: $2,381.49
A break below this level would invalidate the bullish setup and could lead to further downside.
✅ Summary:
Bias: Bullish 📈
Entry Area: Break and retest above resistance zone ($2,660–2,690) 🔓
Target: $2,788 🎯
Invalidation: Below $2,381.49 🚫
📌 Note: Always use proper risk management and confirm breakouts with volume or momentum indicators (e.g., RSI, MACD).
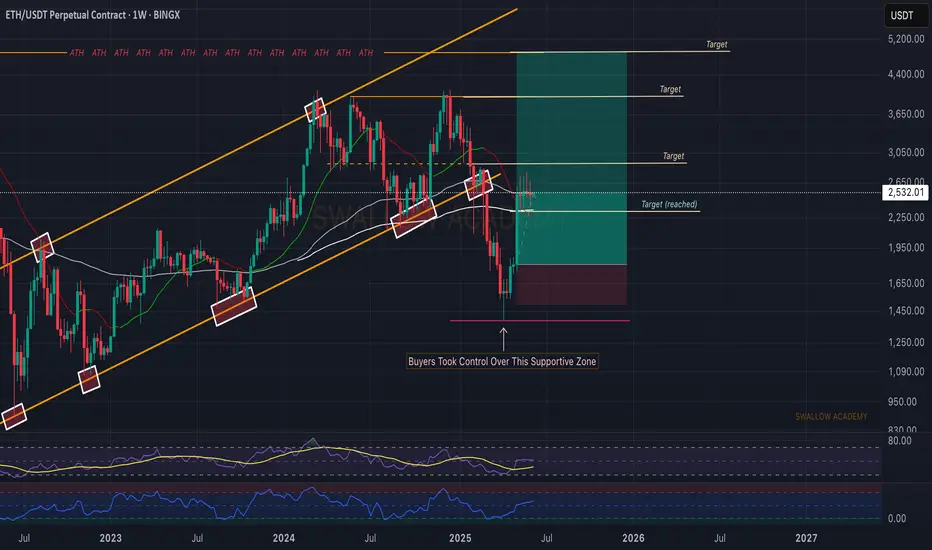
Ethereum (ETH): Time For ETH To Shine | Bullish!Ethereum has done very well so far, where we have established the bottom for the weekly timeframe and also got a good entry for the long position here.
Now, while we reached our first target we are still looking for further movement to upper zones, filling rest of our target. This would be the next step for upcoming bull market, where liquidity will fall into ETH and coins on ETH ecosystem.
Swallow Academy