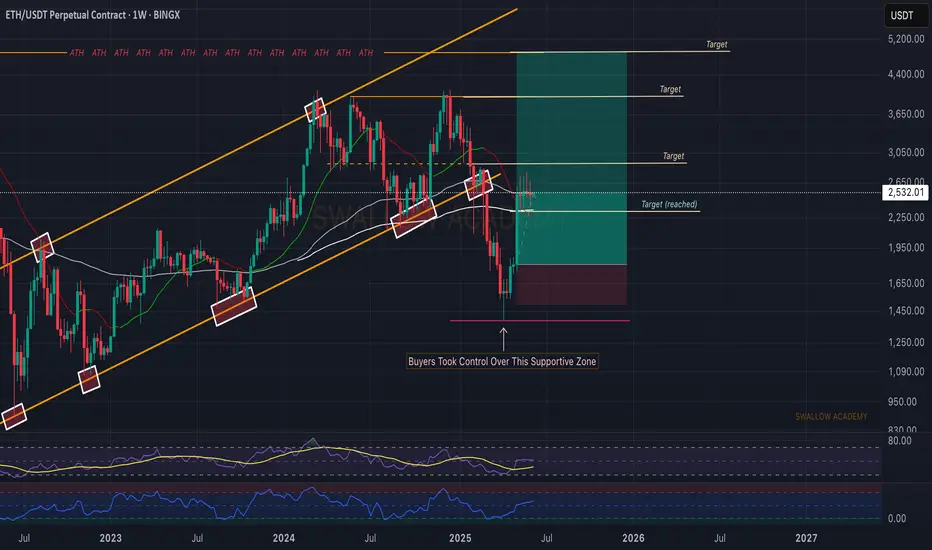
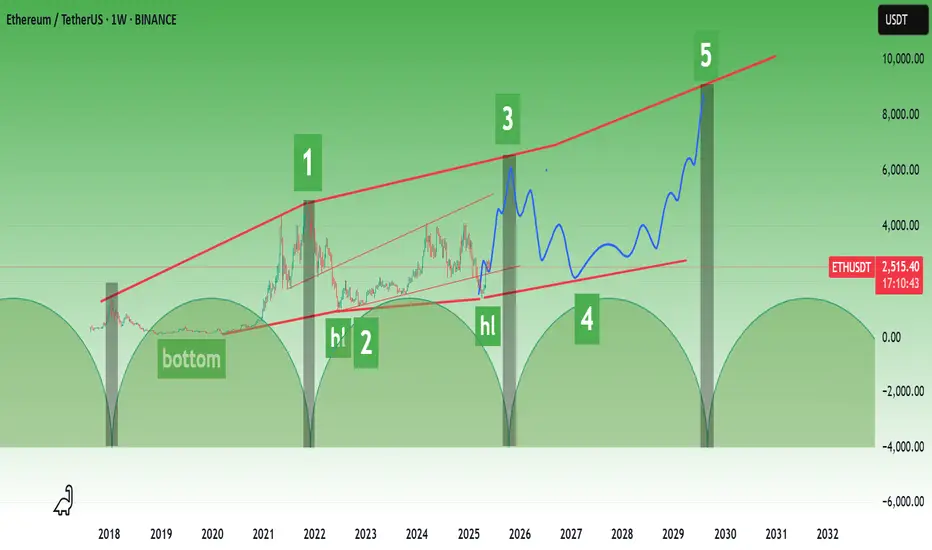
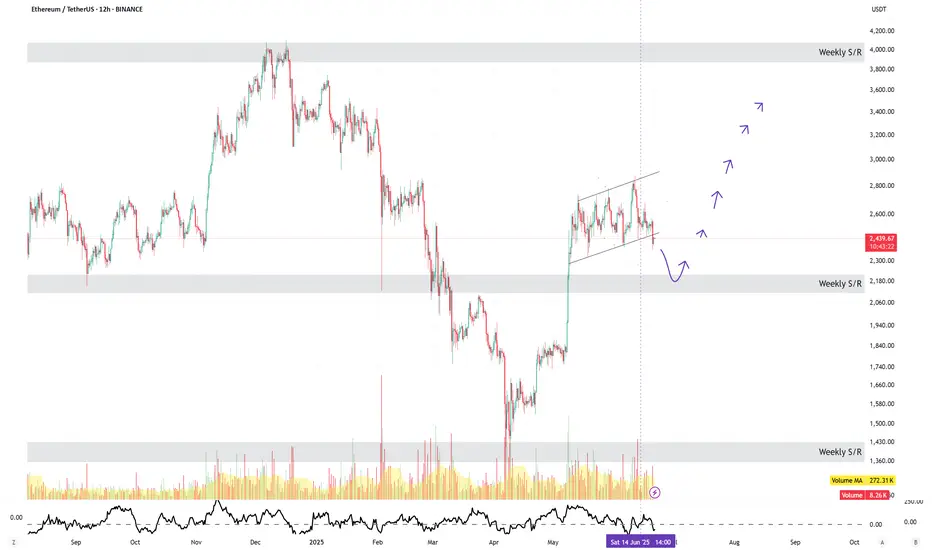
Ethereum (ETH): Time For ETH To Shine | Bullish!Ethereum has done very well so far, where we have established the bottom for the weekly timeframe and also got a good entry for the long position here.
Now, while we reached our first target we are still looking for further movement to upper zones, filling rest of our target. This would be the next step for upcoming bull market, where liquidity will fall into ETH and coins on ETH ecosystem.
Swallow Academy
ETHUSDT.3S trade ideas
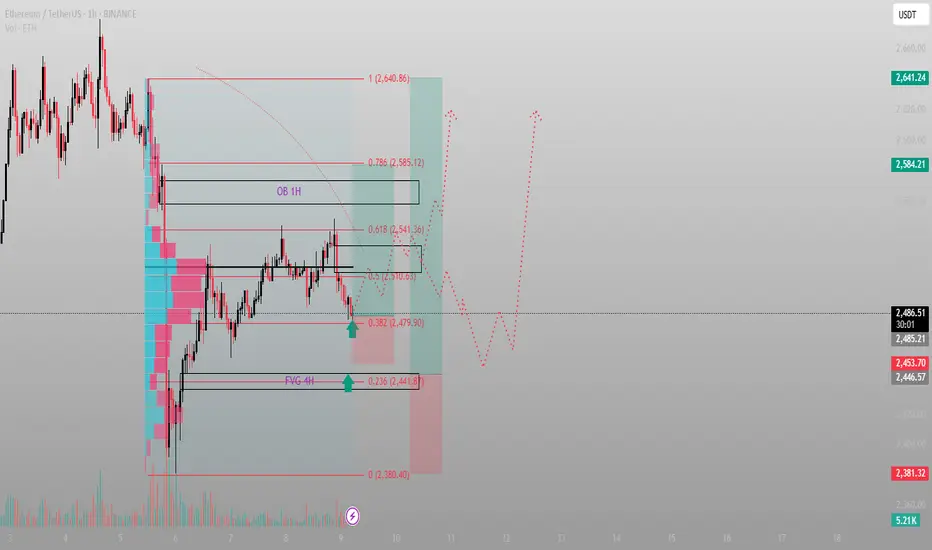
It tapped the level I was watching. Now it’s time to act, not reBINANCE:ETHUSDT just kissed the 0.382 fib at 2479 — and that’s not coincidence. That’s engineered precision. Anyone still waiting for confirmation is late. The confirmation already happened.
Here’s the structure:
4H FVG sits just below, untouched. It’s a magnet — but we may front-run it.
Price reacted from the 0.382, aligning with volume and previous inefficiency.
The 1H OB above (2541–2585) is the first real test. Break it, and we’re looking for 2640+.
This isn’t trend-following. This is manipulation-following. Watch where price shouldn’t go — and then track where it chooses to go.
What I’m watching:
Long is active from the 2479–2441 zone
TP1: 2510 (half-level reclaim)
TP2: 2541–2585 OB sweep
Final target: 2640.86 (EQ of full move)
Invalidation: clean break below 2440 FVG
A level doesn’t need your belief to hold. It needs liquidity.
More setups — real Smart Money reads, not noise — are posted in the profile.
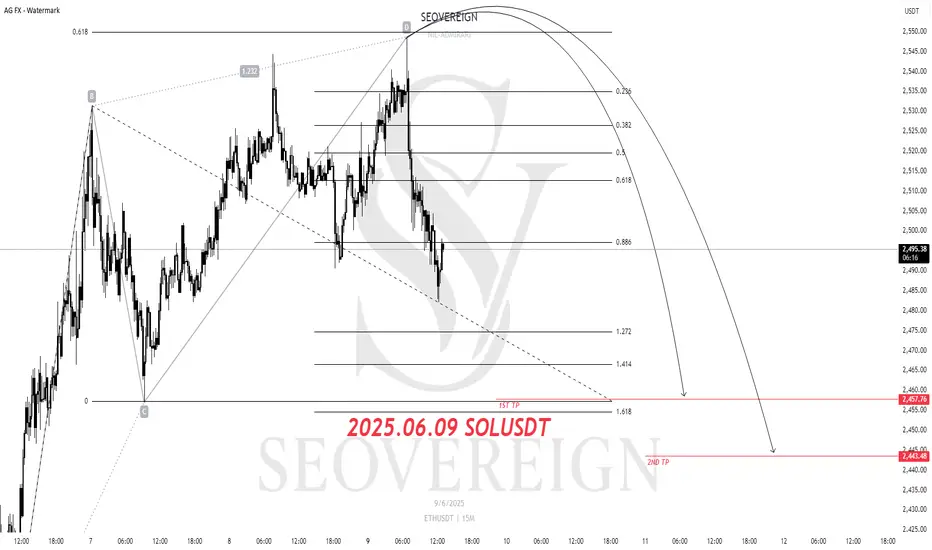
ETHEREUM Short Position Update – June 9, 2025We are the SeoVereign Trading Team.
With sharp insight and precise analysis, we regularly share trading ideas on Bitcoin and other major assets—always guided by structure, sentiment, and momentum.
🔔 Follow us to never miss a market update.
--------------------------------------------------------------------------------------------------------
Ethereum (ETH) Short Position Strategy
Position Basis: Technical reversal signal based on the ABCD
1st Target: 2.45
Analysis Summary:
Currently, ETH has entered the completion zone of the ABCD pattern, one of the harmonic patterns, suggesting a potential price reversal. This pattern provides a technical basis for a short entry along with an overbought signal at the top.
The targets are set as support zones that the downward wave may reach after the pattern completion, and a partial take-profit strategy may be effective depending on market conditions. Thorough risk management and setting a stop-loss are crucial to prevent pattern invalidation.
ETHEREUM ROADMAPI tried to predict based on previous time periods and elliot waves.
Please note that my analysis is not short-term. Of course, there may be short-term correction waves in Ethereum.
* The purpose of my graphic drawings is purely educational.
* What i write here is not an investment advice. Please do your own research before investing in any asset.
* Never take my personal opinions as investment advice, you may lose your money.
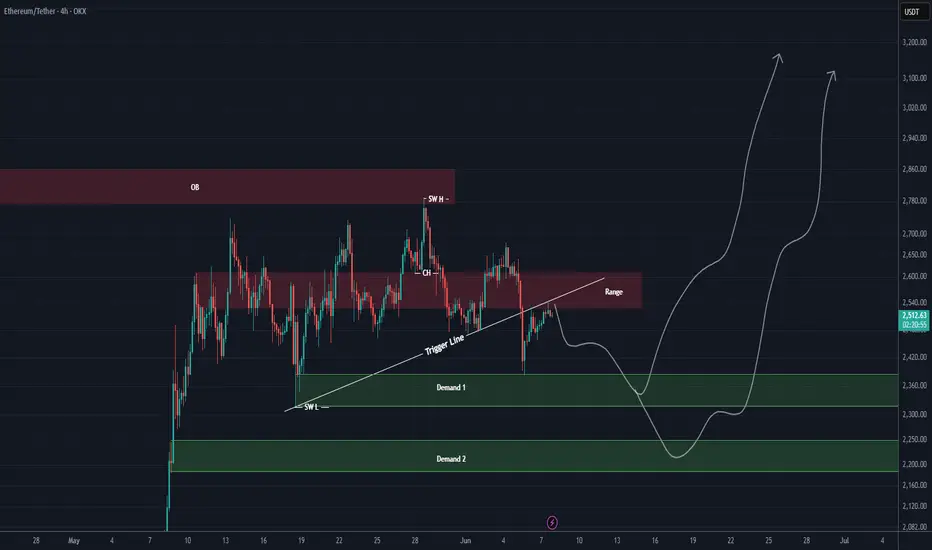
ETH New Update (4H)After being rejected from the higher levels and losing the trigger line, Ethereum now appears to have pulled back into the range zone and the trigger line.
It is expected that the price will be rejected once again from the red zone to the downside, and then turn bullish again from one of the two green zones and move upward.
This is our current outlook on Ethereum. The analysis will be updated accordingly.
Keep in mind that taking short positions in these zones is not low-risk either!
For risk management, please don't forget stop loss and capital management
Comment if you have any questions
Thank You
ETH is testing its resistance ETH may reject from its resistance line as ETH is showing weakness at around $2550 mark level, lets see and if it does it may go down to $2200 level. #ETH #BTC #crypto
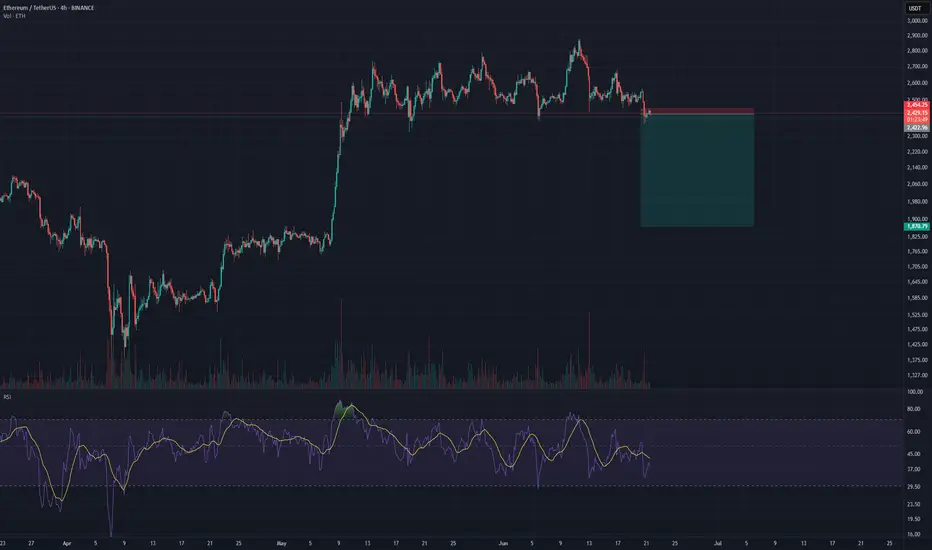
ETH/USDT – Short-Term Bearish SetupETH/USDT – Short-Term Bearish Setup
Ethereum is losing momentum near resistance and showing signs of weakness.
I’m entering a short position, targeting $2,481 in the near term.
🔻 Clean structure, strong rejection – watching for continuation.
📉 Follow for more high-conviction setups and sharp entries!
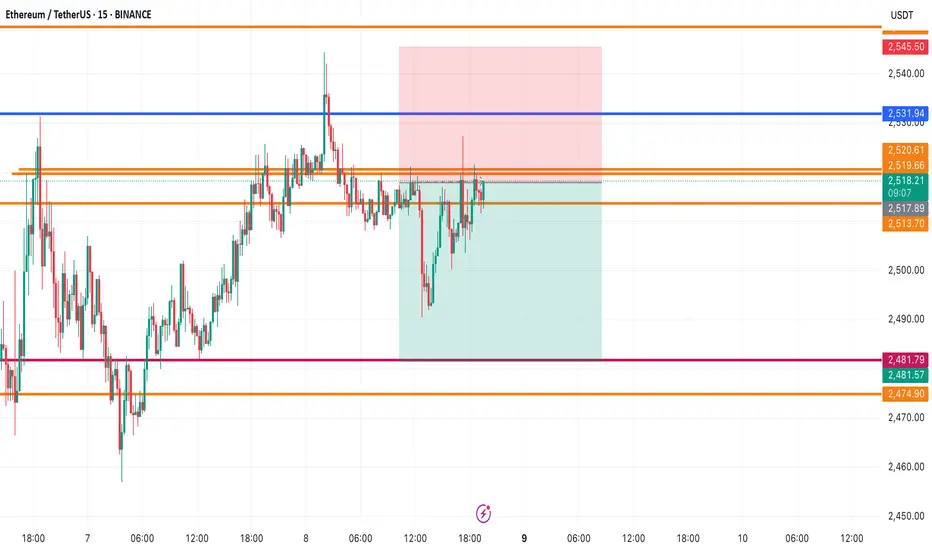
Long trade
📘 Trade Journal Entry — ETHUSDT (Buyside Trade)
🗓 Date: Saturday, 7th June 2025
⏰ Time: 4:00 PM (NY Time)
📍 Session: NY Session PM
📈 Timeframe: 1-Hour
🎯 Result: ✅ Target hit successfully
🔹 Trade Details:
Entry Price: 2,518.91
Take Profit: 2,561.82 (+1.70%)
Stop Loss: 2,513.19 (−0.23%)
Risk-Reward Ratio: 7.5
🔹 Technical Context:
Entered a strong bullish continuation pattern on the 1Hr timeframe.
Confirmed by confluence of higher lows and demand zone support.

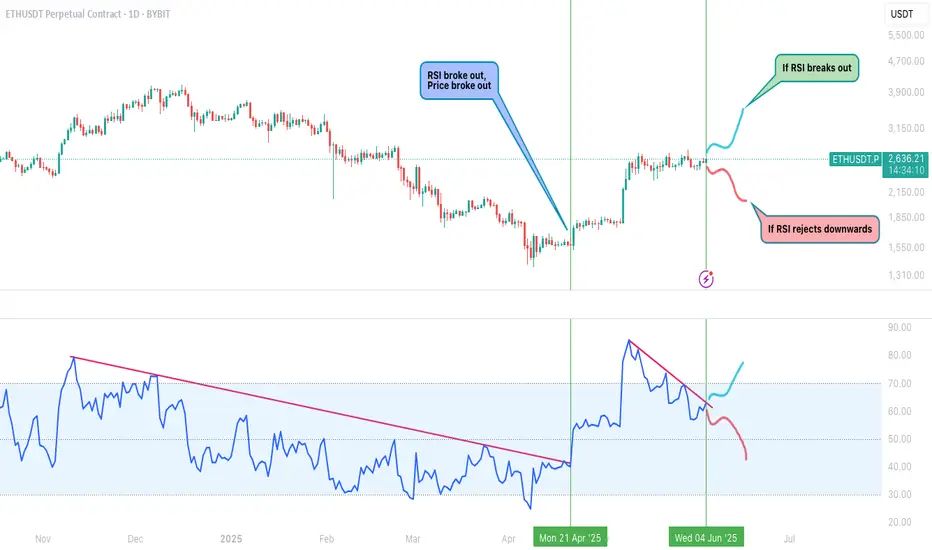
ETHEREUM RSI AT A CRITICAL DECISION POINTCRYPTOCAP:ETH bulls, keep your eyes on this,
We’ve seen this play before:
RSI breakout → Price breakout
That’s exactly what happened back in April — a clean move that led to a strong rally.
Now we’re approaching a similar RSI structure...
Two potential scenarios ahead:
If RSI breaks out upward again, expect ETH to revisit higher zones like $3,150+
If RSI rejects from the trendline, downside toward $1,850–$1,550 isn’t off the table
RSI is often the early signal — use it to anticipate the move before the price confirms.
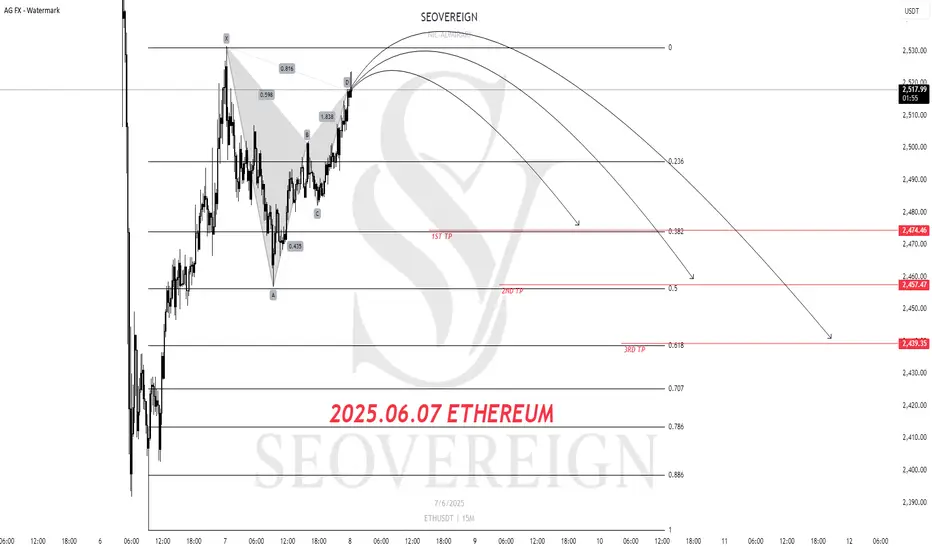
Ethereum Short Position Update – June 7, 2025We are the SeoVereign Trading Team.
With sharp insight and precise analysis, we regularly share trading ideas on Bitcoin and other major assets—always guided by structure, sentiment, and momentum.
🔔 Follow us to never miss a market update.
--------------------------------------------------------------------------------------------------------
Ethereum Short Position Share
Currently, Ethereum is approaching the completion zone of a Gartley pattern.
The Gartley pattern is one of the traditional corrective patterns and often acts as an important price reversal point.
In this pattern, the price is showing resistance near the high and signaling a reversal, indicating a high possibility of a shift into a short-term corrective phase.
Accordingly, a short position is considered with the first target set at $2,476.
This area corresponds to a previous support level and the pattern target, making it a technically significant selling target zone.
It is important to monitor market conditions and volume trends while managing risk simultaneously.
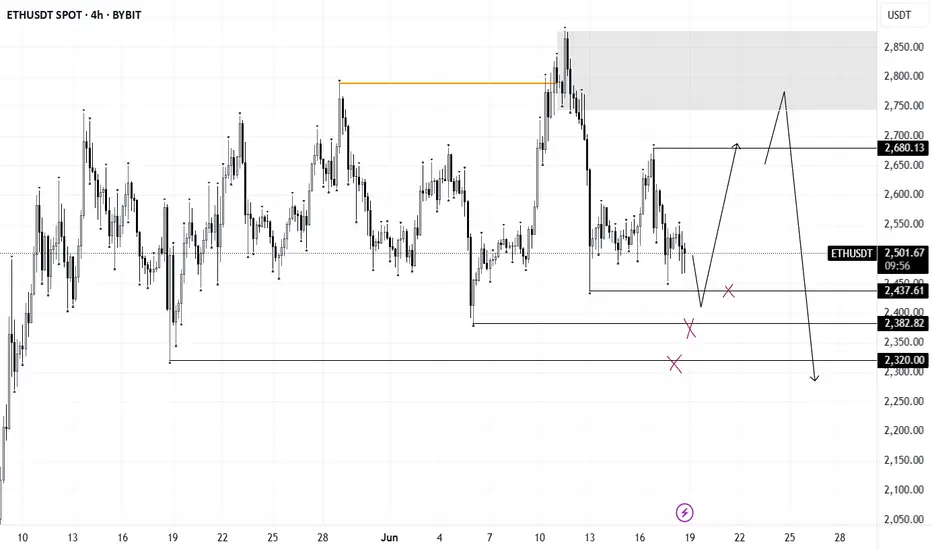
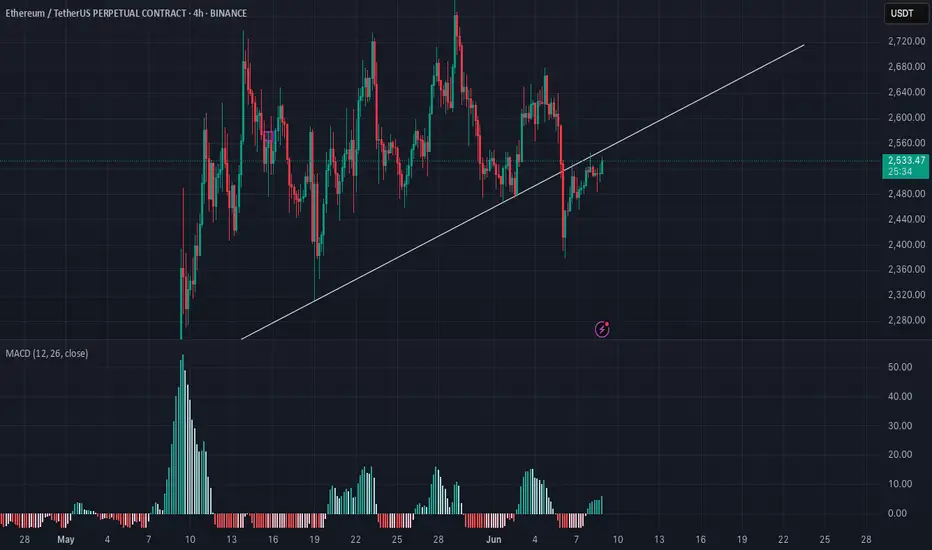
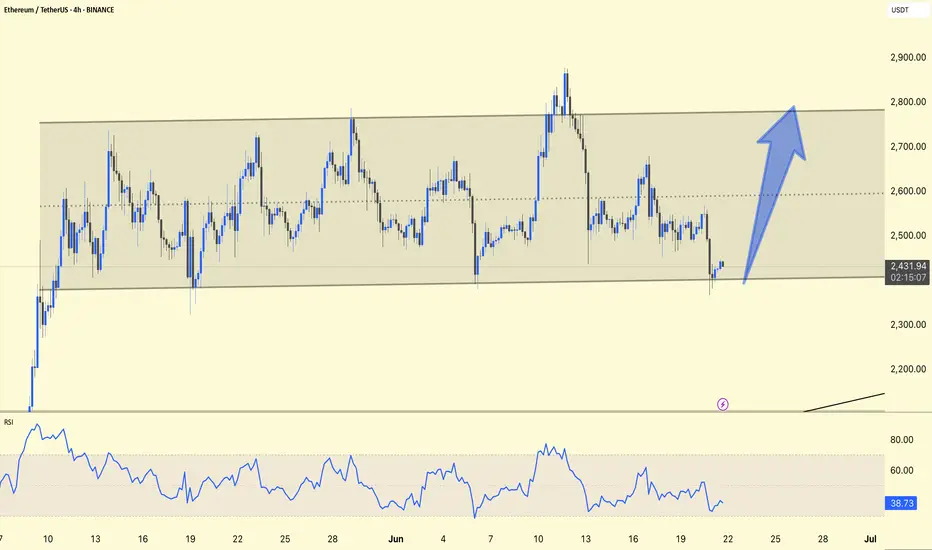
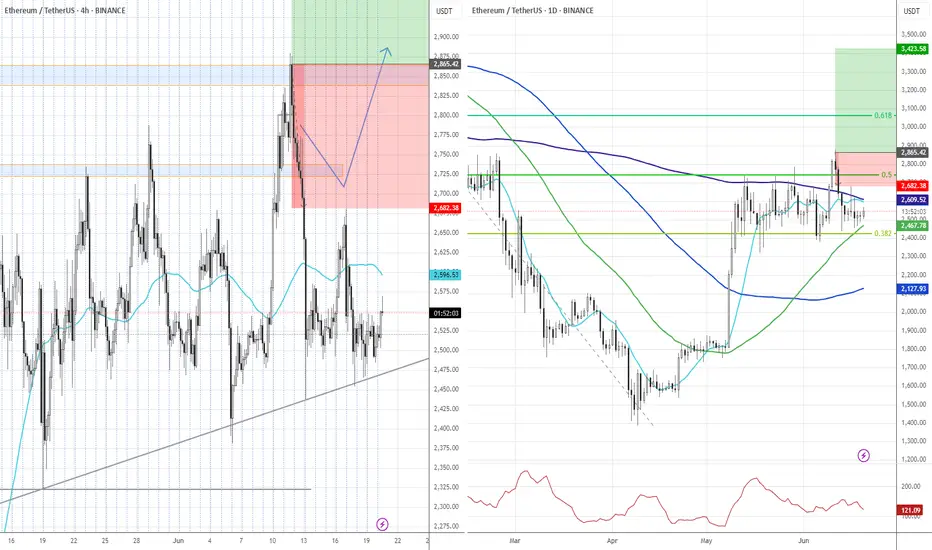
ETH/USDT 4H Technical Analysis UpdateChart Insights:
ETH is holding the lower trendline support (~$2,430), which indicates a potential reversal zone.
The RSI is hovering around 39, which indicates oversold territory, suggesting that buyers may step in soon.
Expected Move:
The chart predicts a strong move upwards towards the $2,800–2,900 zone (blue arrow), which aligns with the top range boundary.
Trade Plan:
Buy Zone: Near the lower trendline ($2,430–2,450)
Stop Loss: Just below the trendline ($2,400)
Target: Near the upper range boundary (~$2,800–2,900)
Stay alert!
Wait for ETHETH faced rejection at the weekly resistance near $2,700.
Price is likely to retest the current weekly support around the $2,100 zone.
Patience is key—wait for ETH to reach this support area before considering entry.
Disclaimer:
This analysis is based on my personnal views and is not a financial advice. Risk is under your control.
Long trade
15
min overview
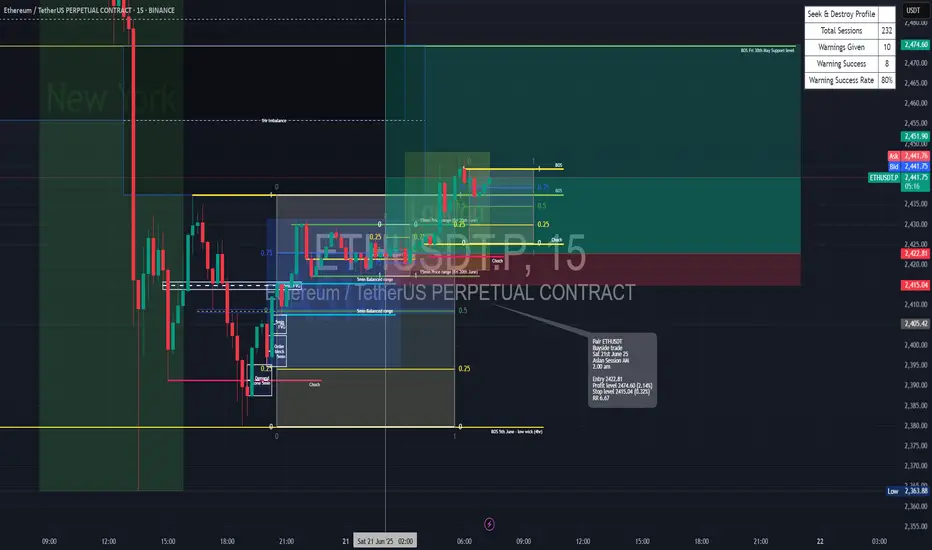
🟢 Trade Journal Entry – Buyside Trade
📍 Pair: ETHUSDT
📅 Date: Saturday, June 21, 2025
🕒 Time: 2:00 AM (Asian Session AM)
⏱ Time Frame: 15 Minutes
📈 Direction: Buyside
📊 Trade Breakdown:
Entry Price 2422.81
Profit Level 2474.60 (+2.14%)
Stop Loss 2415.04 (−0.32%)
Risk-Reward
Ratio 6.67 1
🧠 Context / Trade Notes:
BOS 5th June – 4HR Low Wick:
Break of structure observed on June 5th from a 4-hour low wick.
Observing the current NY session sweep of the liquidity from the London low wick signalled Sellside exhaustion.
Order Block & Retest:
A bullish OB formed on a prior swing, with a clean mitigation of price (Fri, 20th price range) and BOS, confirming buy-side interest.
5min TF Observation - entry:
Narrative:
Utilising DRT levels (coined by Ali Khan) to navigate the range and unfolding price action.
Target imbalance zone 1Hr.
ETH READY TO GO 3000$ ???🔍 ETH/USDT Analysis – Daily Timeframe
ETH is currently trading at $2,427, holding above the key support zone around $2,370 - $2,390, which is aligned with the 100 EMA. This zone has acted as a strong accumulation area.
📈 Market Structure:
Price is consolidating inside a horizontal range. A confirmed breakout above the resistance zone ($2,650 - $2,700) could lead to a bullish continuation towards the major resistance at $2,861.
📊 Technical Outlook:
Trend: Sideways range (accumulation phase)
100 EMA: Acting as dynamic support
Breakout Potential: Bullish continuation expected on breakout and retest
📌 Trade Plan (Not Financial Advice):
Entry Idea: Break and close above $2,700 zone
Target: $2,861 and higher
Invalidation: Daily candle close below $2,370
ETH is building strength above its 100 EMA. A breakout from this range can trigger a fresh bullish leg.
🔁 Like & share your opinion! Always DYOR before trading.

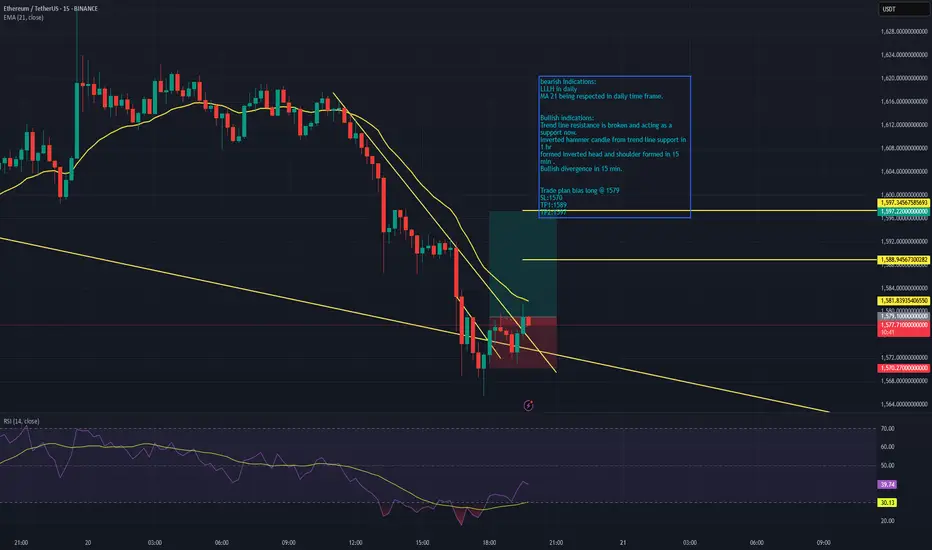
ETH -bullish indicationsbearish indications:
LLLH in daily
MA 21 being respected in daily time frame.
Bullish indications:
Trend line resistance is broken and acting as a support now.
Inverted hammer candle from trend line support in 1 hr
formed Inverted head and shoulder formed in 15 min .
Bullish divergence in 15 min.
Trade plan bias long @ 1579
SL:1570
TP1:1589
TP2:1597
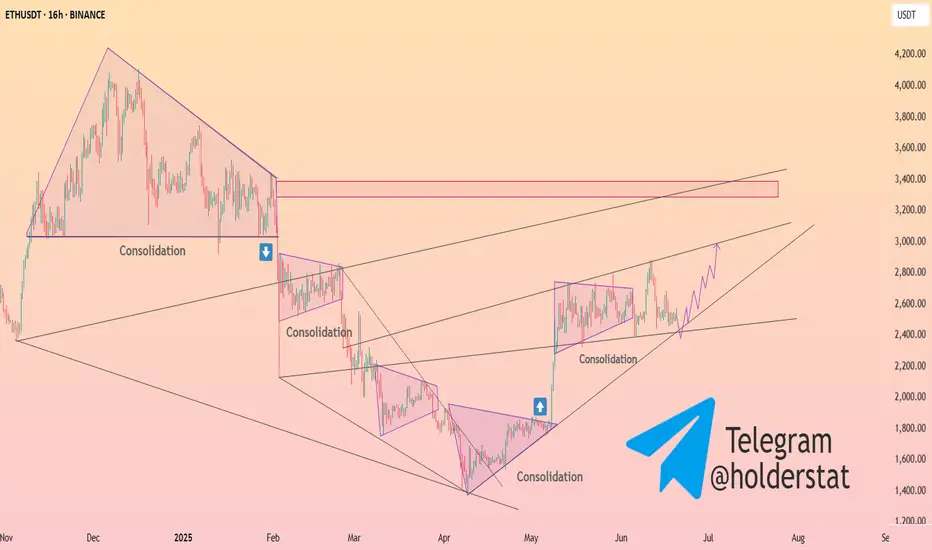
HolderStat┆ETHUSD ascending channel strengthBINANCE:ETHUSDT on the 16h chart is showing a robust uptrend, with price action contained within an ascending channel. Each consolidation has led to a breakout, and the current price is bouncing off the lower channel support. The pattern of higher lows and strong rebounds from support levels indicate that bulls are in control. The next resistance is at 3,200, and a breakout above this could open the way to 3,400 and beyond. The technicals support a bullish continuation as long as ETH holds above 2,400.
SHORT ETH🔷 Setup Summary: SFP + Key Volume Combo
1. Context:
Pattern: Double Top + SFP (Swing Failure Pattern)
Timeframe: Likely M15–H1 (possibly during Asian/European session)
Background: Price breaks previous high slightly (liquidity grab), then sharply reverses — a clear trap.
2. Confirmation:
A clear Key Volume candle appears at the top — signaling market maker action.
A strong rejection candle (pinbar or engulfing) confirms the SFP.
Price fails to hold above the new high — trap confirmed.
3. Entry Strategy:
Entry: After the SFP confirmation candle closes.
Stop Loss: Above the SFP high or Key Volume wick (a “valid” SL, not necessarily tight).
Take Profit:
Short-term: 3R (if trading intra-session).
Long-term: Target demand zone or Daily support if trend supports it.
4. Risk Management (per system guidelines):
Max risk per trade: 1–2% of account.
If setup invalidates: cut the loss immediately, don’t widen SL or overtrade.

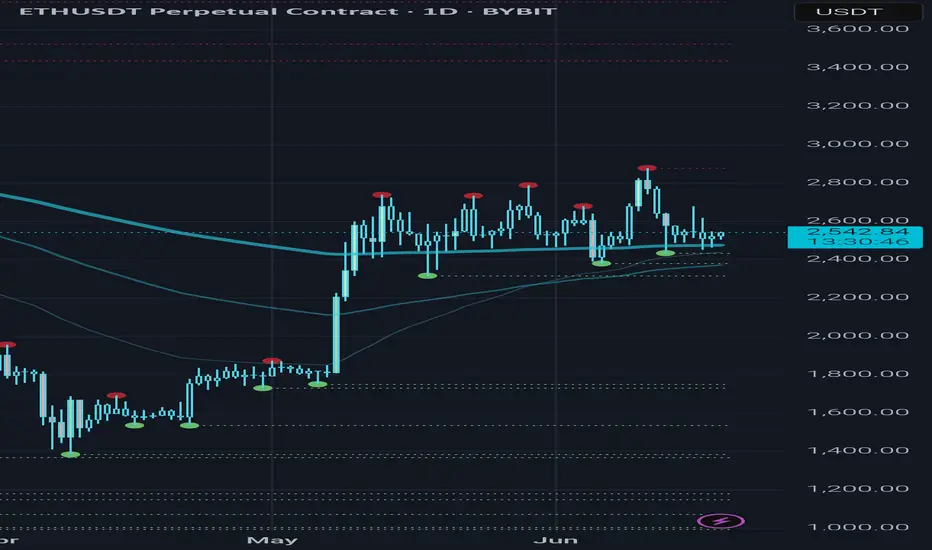
Ethereum Daily Chart = Coiled SpringSitting on the 200 EMA.
3x liquidity sweeps below — no breakdown.
Red dots stacking above = pressure cooker.
📉 Break $2.45K → dump
🚀 Break $2.7K → $3K squeeze
Big move coming. Don’t blink.
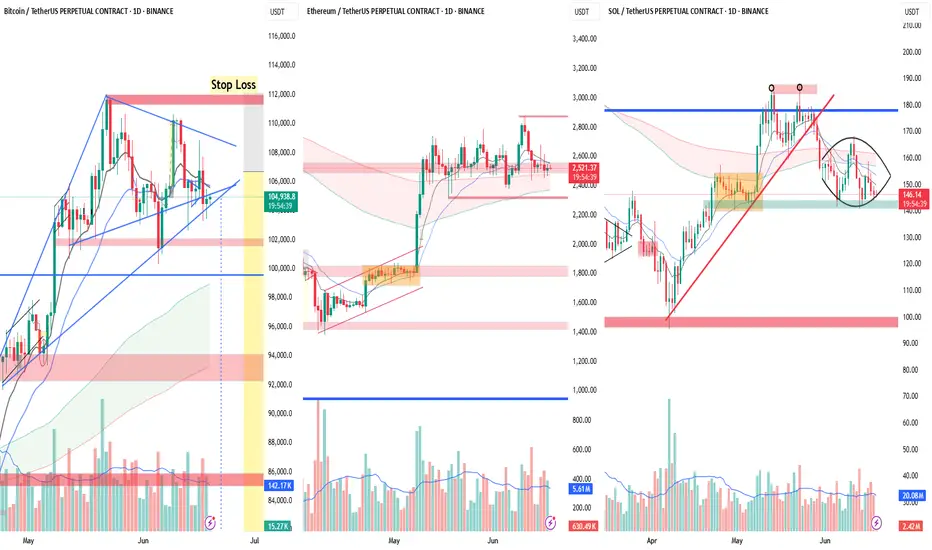
Crypto at a Crossroads: BTC, ETH & SOL – 3 Charts, 3 Messages📊 Market Overview:
The crypto market often moves together — but BTC, ETH, and SOL are telling 3 very different stories right now. From Bitcoin’s coiled spring to Ethereum’s indecision and Solana’s struggle — this divergence could define the next major trend.
1️⃣ Bitcoin (BTC): The Market’s Trigger
BTC is tightening in a Symmetrical Triangle after a powerful uptrend — a textbook Bull Pennant.
🔼 Lower highs + higher lows = pressure build-up
🔇 Volume drying up → classic pre-breakout setup
⚡ A decisive move (esp. above $ 108K) will likely lead the entire market
Bias: Bullish continuation likely, but prepare for either direction.
2️⃣ Ethereum (ETH): The Waiting Game
ETH is stuck in a rectangle range between $ 2,450–$ 2,800.
😐 Flat MAs = no short-term trend
📉 ETH is neutral → waiting for BTC to move first
Strategy: React to breakout or breakdown from range boundaries.
3️⃣ Solana (SOL): The Weakest Link
SOL shows clear signs of reversal and relative weakness.
⚠️ Double Top near $185 in May
🔻 Lost multi-month trendline
🛡️ Testing critical support at $ 140–145
🌀 Attempting a Rounding Bottom (accumulation?) but still below key MAs
Watch: Support must hold. Break below = major downside risk.
🎯 Trade Strategy:
If BTC Breaks Up (above $ 108K):
🚀 Long BTC → Targets: $ 118K–$ 120K
✅ Long ETH above $ 2,800
🧨 Aggressive Long SOL above $ 160 (trendline reclaim)
If BTC Breaks Down (below $ 104K):
⚠️ Short BTC → Targets: $ 100K, $ 98K
⚠️ Short ETH below $ 2,450
🚨 High-conviction Short SOL below $ 140 → Potential drop to $ 100 zone
❌ Invalidation:
📉 Bullish thesis invalid if BTC breaks below triangle
📈 Bearish invalidated if BTC breaks up (Stop loss above $112K)
🔚 Final Word:
BTC is the market’s steering wheel — ETH is parked, SOL is stalling.
⏳ The triangle is near apex. A breakout will ripple across all coins.
Which direction are YOU betting on? Bullish or Bearish? Drop your view below!
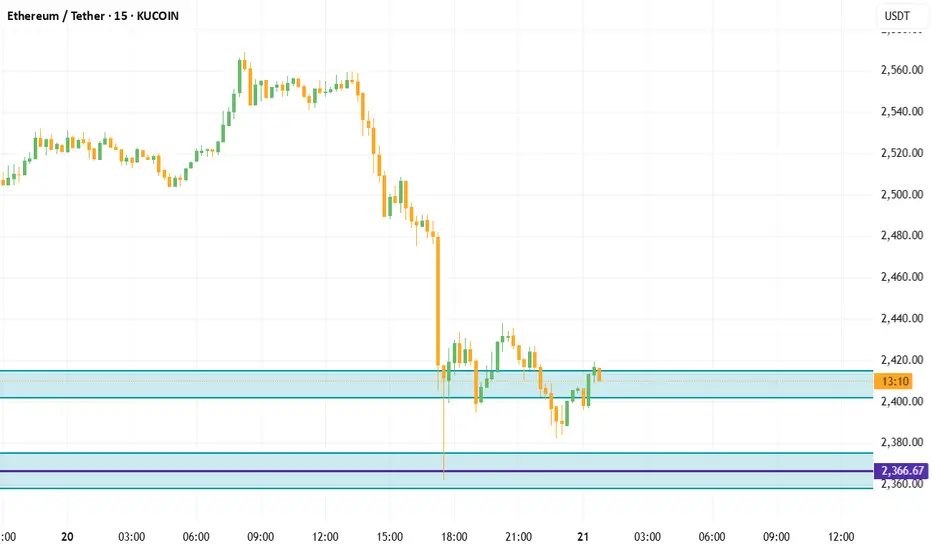
ETH/USDTETH remains in a consolidation phase. Attention is on the nearest liquidity zone — a sweep or reaction here could signal the next move. Failure to reclaim and hold above the $2600 level on the weekly close opens the door for a potential drop into the $2000–$2300 range, aligning with a possible manipulation phase before reversal.
Longs or shorts only considered upon clear confirmation and valid setup. No rush — let the market come to you.