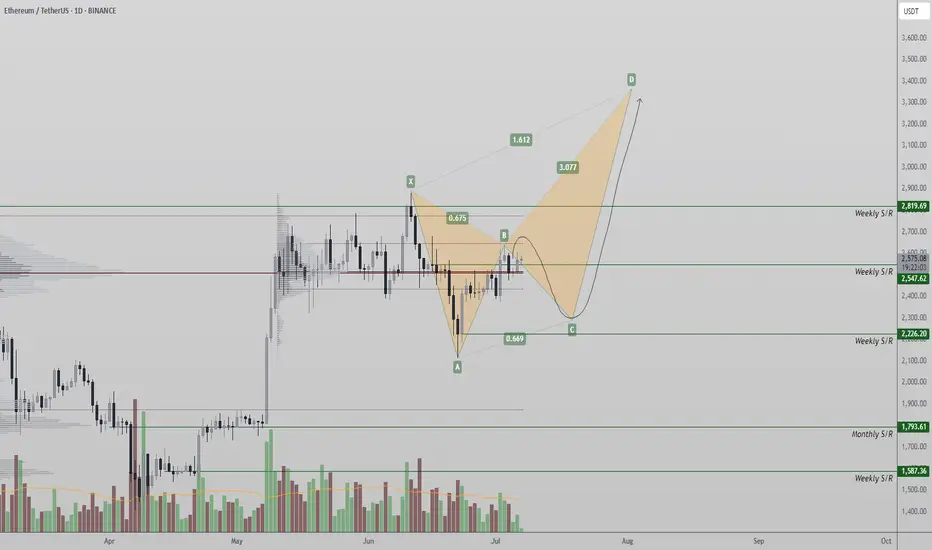
Eth $2,500 Resistance — Will Harmonic Pattern Trigger a Rally?Ethereum Stuck at $2,500 Resistance — Will Harmonic Pattern Trigger a Rally to $3,400?
Ethereum has been trading in a prolonged consolidation phase around the $2,500 level — a region that has acted as resistance for several weeks. This extended period of sideways action could signify either accumul
Why You Still Lose Money Even With Perfect AnalysisYour setup was on point, your entry was clean, your stop-loss was tight.
Everything looked perfect.
And yet, you still lost.
Maybe the real issue isn’t in your chart, maybe it’s in your head.
Hello✌
Spend 3 minutes ⏰ reading this educational material.
🎯 Analytical Insight on Ethereum:
BINA
Ethereum Analysis – Vitalik’s Gas Cap Proposal Adds PressureToday, I want to show you the possible moves for Ethereum ( BINANCE:ETHUSDT ) this week.
Please stay with me .
Let’s first take a look at the important news that has come for Ethereum in the last 24 hours :
Ethereum’s Gas Cap Proposal Sparks Concerns
Ethereum co-founder Vitalik Buterin
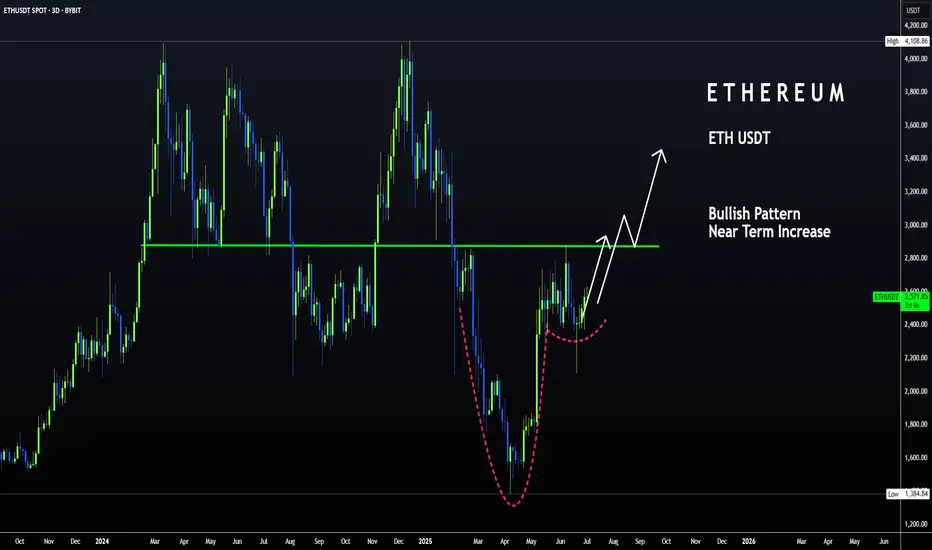
ETH | Bullish Pattern - Cup and Handle +15%A Bullish pattern is appearing on the Ethereum chart.
From a Cup and Handle pattern, we can easily expect atleast a 15% increase. This is true for the near term. A +15% would put us here:
Just under $3K we may see heavy resistance. This is also the neckline resistance, as it was the previous sup
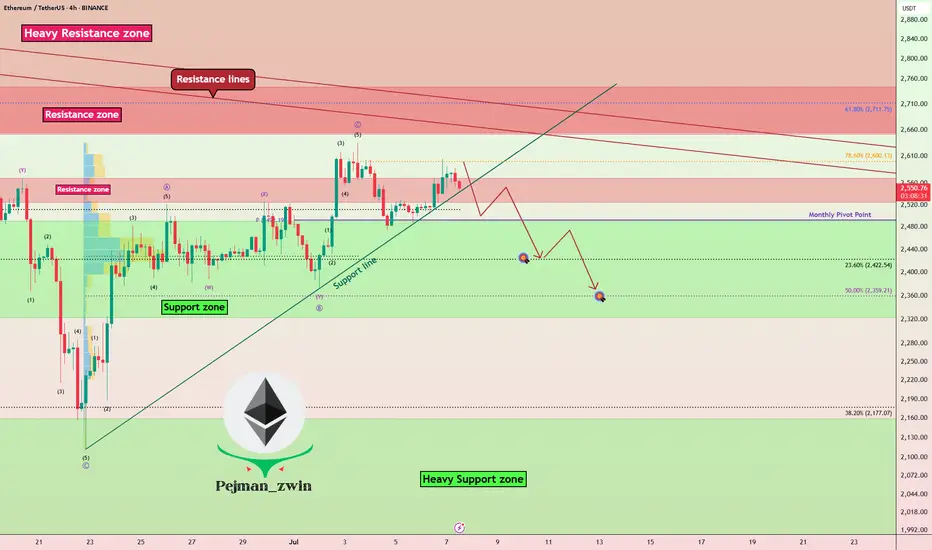
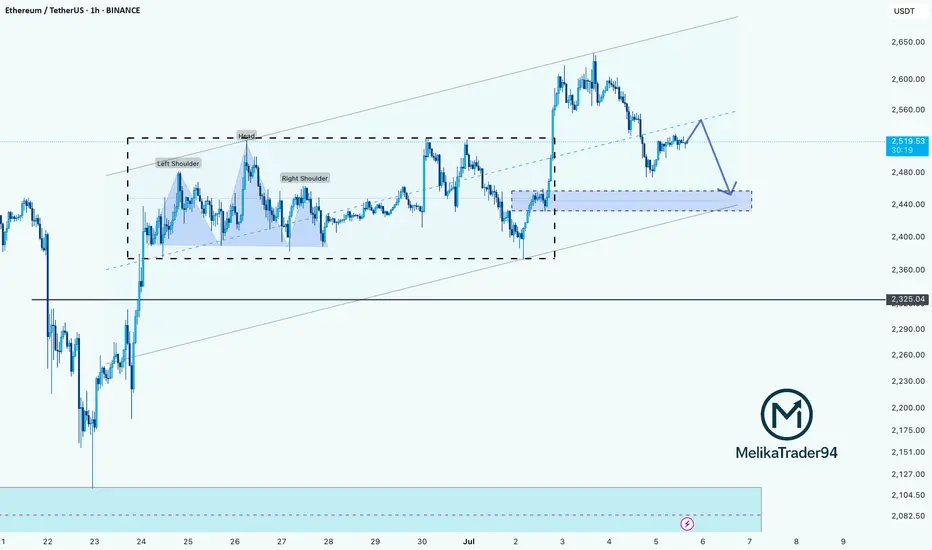
Ethereum Faces Key Resistance: Potential Pullback AheadHello Guys!
What I see:
Head and Shoulders Pattern:
Left Shoulder: Formed
Head: Peak, followed by a drop.
Right Shoulder: Formed.
The neckline break around $2,450 initiated a downside move, confirming the bearish setup.
Current Price Action:
ETH is currently trading near $2,519, atte
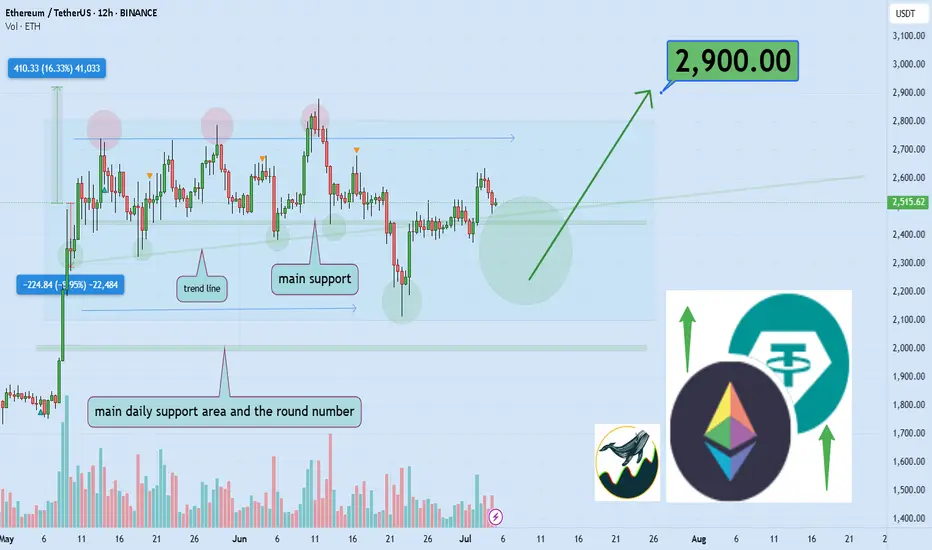
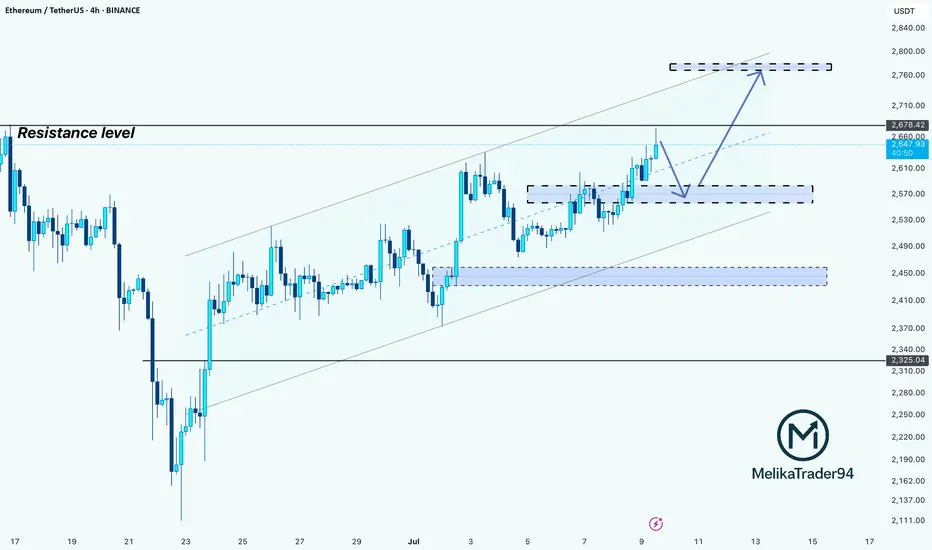
ETH Pullback Before Next Rally? Hello guys!
Ethereum is currently testing a strong resistance zone around the $2,678 level, which has previously acted as a key barrier. Price action has been climbing steadily within an ascending channel, indicating a clear bullish trend in play.
However, since ETH is right at the resistance, we
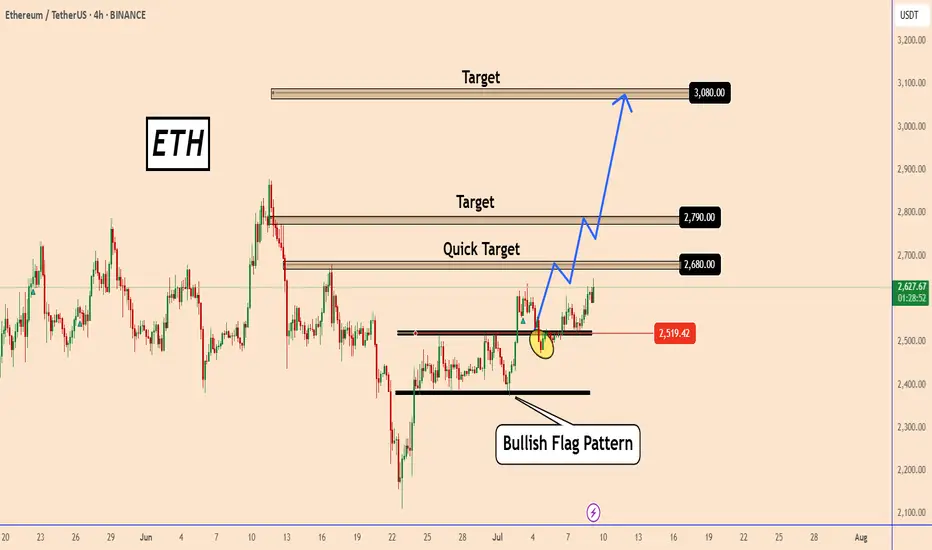
ETH Price Forecast: Keep Bullish Above 2519ETH Price Forecast: Keep Bullish Above 2519
Finally, ETH is holding strong above 2520. Over the previous days, ETH lost momentum and was about to invalidate the pattern, as it reached 2475.
However, the uncertain situation from geopolitical tension and tariffs is still supporting the bulls on t
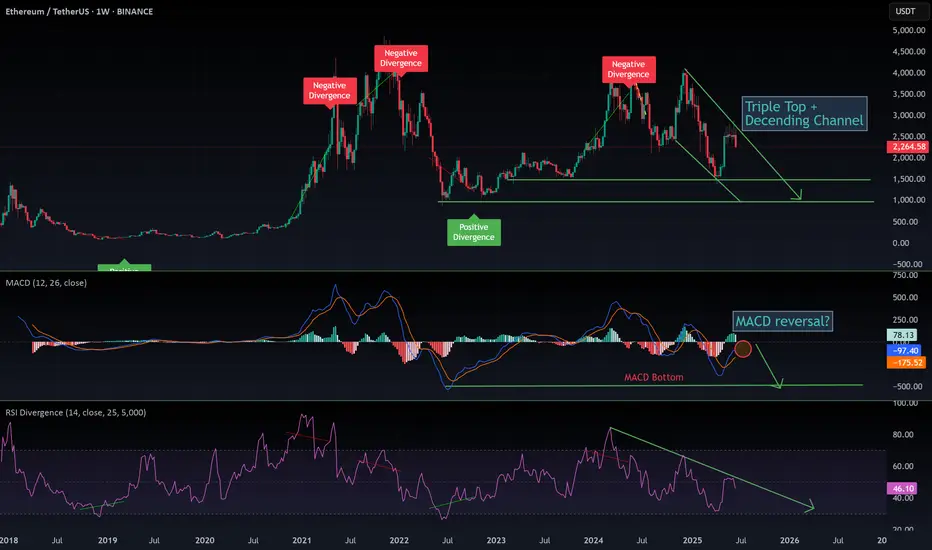
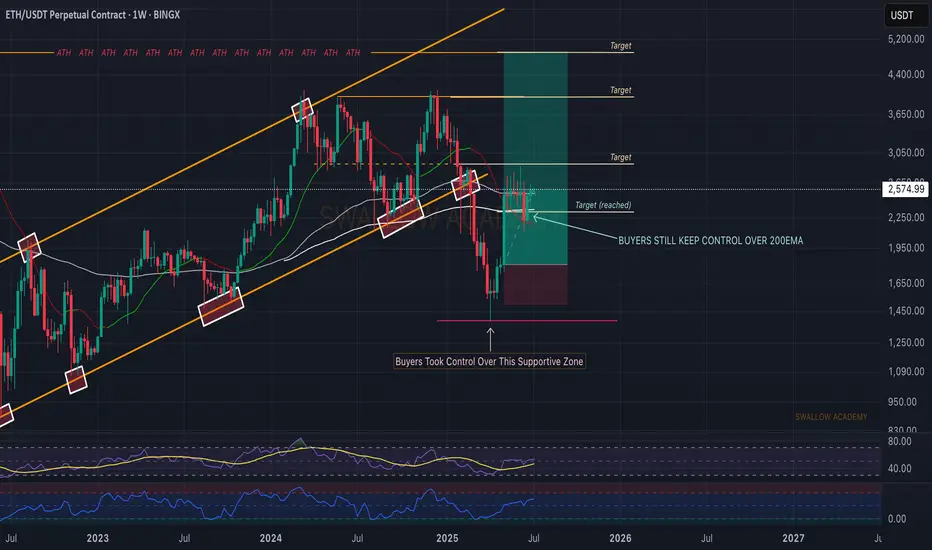
$ETH: The 1-week chart is an absolute disaster!Once again, I want to make it clear: I’m naturally a bull. But I live in Thailand, far from the noise of influencers shouting "buy, buy, buy!" I’ve learned my lesson—when they scream buy, you get rekt. That’s why I rely solely on the charts.
Charts are just mathematics—they don’t lie. So here’s my
Ethereum (ETH): Still Cheap Don't You Think? | $2800 NextEthereum is still cheap compared to what is about to happen. Now saying "about to happen" is a little broad, saying as it might be weeks or months until we see the full potential of ETH but we are bullish for sure.
Bitcoin had its moment of money inflow and now money has to flow somewhere else, wh
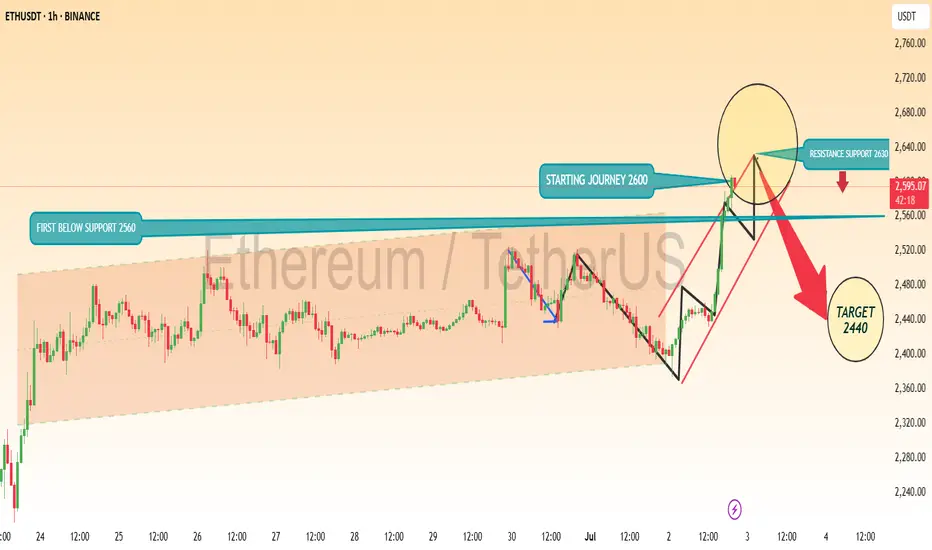
ETHEREM ETHUSD LONG TECHNICAL CHART IDEAEthereum (ETHUSD) Technical Outlook – Short-Term Levels and Potential Targets
📊 Key Insights:
First Below Support: 2560 USDT
Starting Journey: 2600 USDT
Resistance Zone: 2630–2650 USDT
Target on Breakdown: 2440 USDT
Market Structure:
After a period of consolidation between 2560 and 2600, ETHU
See all ideas
Summarizing what the indicators are suggesting.
Oscillators
Neutral
SellBuy
Strong sellStrong buy
Strong sellSellNeutralBuyStrong buy
Oscillators
Neutral
SellBuy
Strong sellStrong buy
Strong sellSellNeutralBuyStrong buy
Summary
Neutral
SellBuy
Strong sellStrong buy
Strong sellSellNeutralBuyStrong buy
Summary
Neutral
SellBuy
Strong sellStrong buy
Strong sellSellNeutralBuyStrong buy
Summary
Neutral
SellBuy
Strong sellStrong buy
Strong sellSellNeutralBuyStrong buy
Moving Averages
Neutral
SellBuy
Strong sellStrong buy
Strong sellSellNeutralBuyStrong buy
Moving Averages
Neutral
SellBuy
Strong sellStrong buy
Strong sellSellNeutralBuyStrong buy
Displays a symbol's price movements over previous years to identify recurring trends.