Ethereum's Last Wave? Bearish Trend Incoming!Ethereum ( BINANCE:ETHUSDT ) started to rise and pump as I expected in the previous idea .
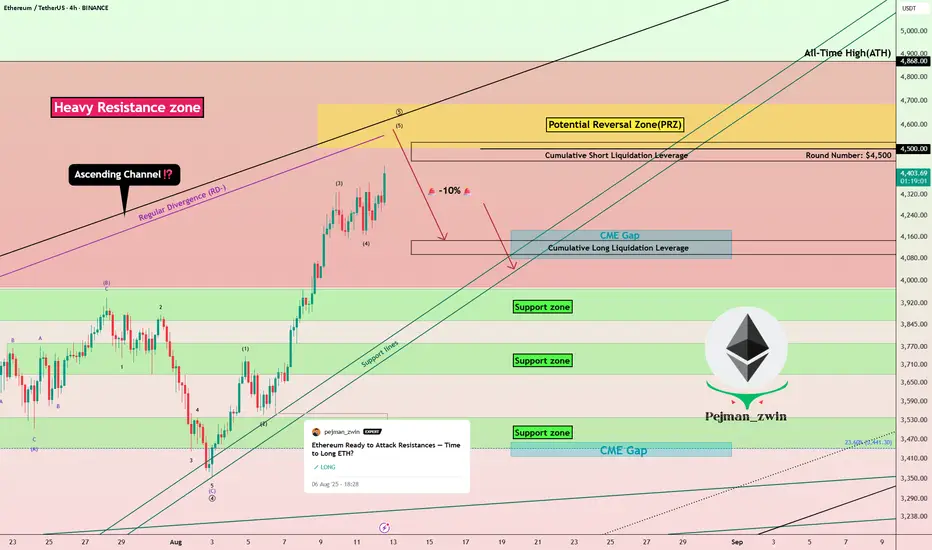
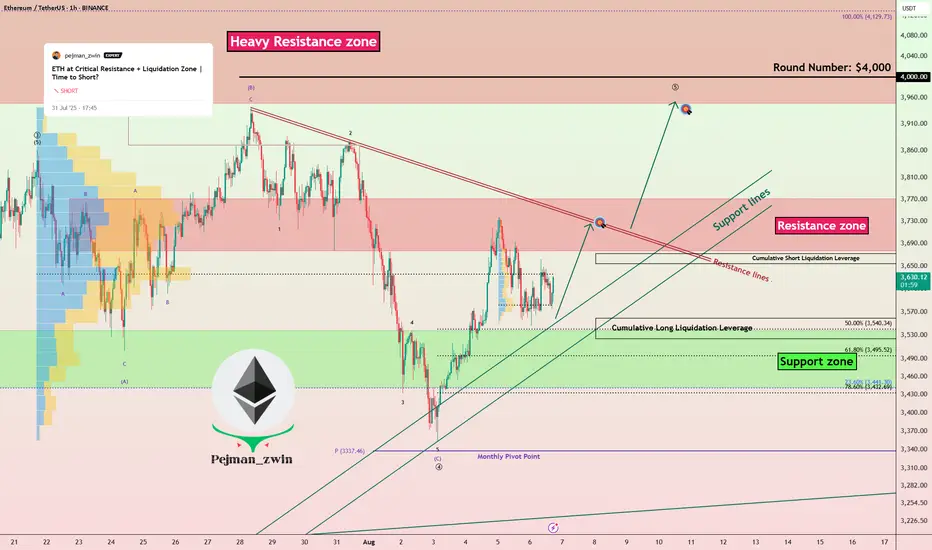
Ethereum is currently trading in a Heavy Resistance zone($4,868(ATH)-$3,977) near the Potential Reversal Zone(PRZ) , Cumulative Short Liquidation Leverage($4,527-$4,452) , and the upper line of the ascending channel(potential) .
In terms of Elliott Wave theory , Ethereum appears to be completing microwave 5 of main wave 5 . Main wave 5 could complete at the Potential Reversal Zone(PRZ) .
Also, we can see the Regular Divergence(RD-) between Consecutive Peaks .
Before any conclusions, let's take a look at the ETHBTC ( BINANCE:ETHBTC ) chart.
ETHBTC also indicates the end of the uptrend, and if the market falls , we can expect ETH and the tokens on the Ethereum blockchain to undergo a correction this time.
I expect Ethereum to bearish trend in the coming days and at least close the CME Gap($4,185-$4,080) .
One of the tokens that we can use for short positions alongside Ethereum is the ENS token ( BINANCE:ENSUSDT ). ENS is the decentralized naming system built directly on the Ethereum blockchain, simplifying crypto addresses into human-readable names .
Cumulative Long Liquidation Leverage: $4,145-$4,094
CME Gap: $3,461-$3,417
Note: Stop Loss: $4,780
Do you think Ethereum will create a new All-Time High(ATH) soon, or should we wait for a correction?
Please respect each other's ideas and express them politely if you agree or disagree.
Ethereum Analyze (ETHUSDT), 4-hour time frame.
Be sure to follow the updated ideas.
Do not forget to put a Stop loss for your positions (For every position you want to open).
Please follow your strategy and updates; this is just my Idea, and I will gladly see your ideas in this post.
Please do not forget the ✅' like '✅ button 🙏😊 & Share it with your friends; thanks, and Trade safe.
ETHUSDT.P trade ideas
The season of Ethereum has arrived!
Do you know that Ethereum is currently the strongest coin in the market?
Even its targets and chart look stronger than Bitcoin’s.
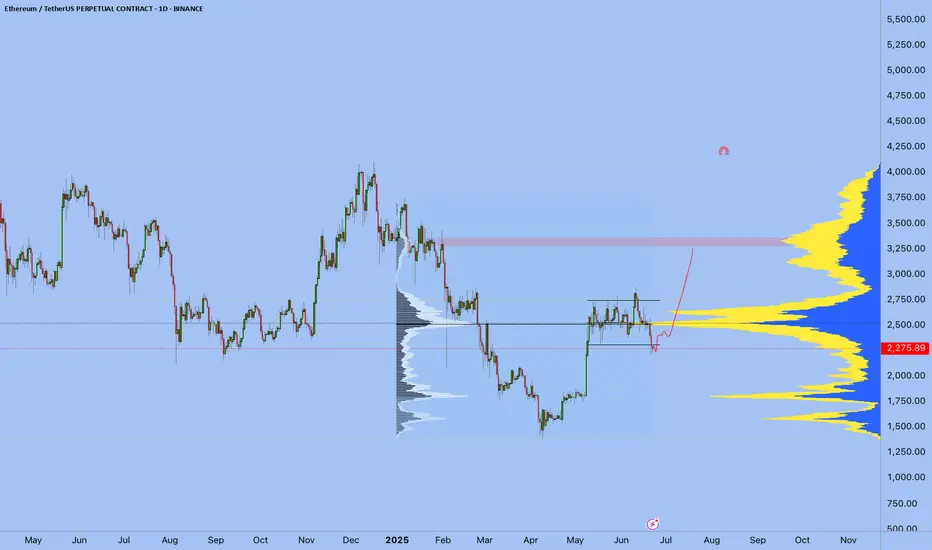
Exactly 4 months ago, I posted an Ethereum analysis saying it had reached its lowest bottom, and at that time its price was exactly $2,180.
Take a look at the chart below.
Now my view is playing out, and Ethereum is only a few steps away from a new all-time high.
But did you know it’s still early, and you haven’t missed the opportunity yet?
Ethereum just broke a megaphone pattern on the weekly timeframe with a massive candle.
Even with all this upward movement, it only started breaking the pattern in the last couple of days, and it still has around 5% left to climb before hitting a new peak and entering price discovery mode.
And even with the crash that happened yesterday, it didn’t drop much and bounced back very quickly, as if it were just a normal day.
Overall, Ethereum will be in the 5-digit range—just like I told you exactly 4 months ago, when many didn’t believe it—and it will reach that by the end of the year. Remember my words, just like every time I’ve told you before.
Best Regards:
Ceciliones🎯

ETH Remains Bullish – No Reversal Signals YetETH Remains Bullish – No Reversal Signals Yet
Following our earlier analysis, ETH has surged from the $2,500 zone to $4,300, showing a strong and sustained bullish trend.
Currently, there are no signs of a reversal, and momentum remains intact across multiple time frames.
I've prepared a multi-timeframe analysis indicating that ETH has the potential to reach $4,800 as a minimum target, with room for further upside if bullish conditions persist.
You may watch the analysis for further details!
Thank you!

ETH - Eyes on a New All-Time High?ETHUSDT has been on fire lately, following a textbook bullish structure of Impulse → Fakeout → Impulse.
After breaking above the previous range in July, ETH confirmed strength with a sharp impulse move, only to shake out weak hands via a fakeout retest before pushing higher again. 📈
Currently, ETH is in the midst of another impulsive leg, with the next major target sitting at the ATH around $4,876.
📊 Key Notes:
- Fakeouts have served as liquidity grabs before strong rallies 🏹
- Current momentum favors the bulls 🐂
- As long as price holds above the last breakout zone (~$4,050–$4,150), the path of least resistance remains up.
🎯 Next Stop: ATH and beyond if bullish pressure sustains.
📚 Always follow your trading plan regarding entry, risk management, and trade management.
Good luck!
All Strategies Are Good; If Managed Properly!
~Richard Nasr

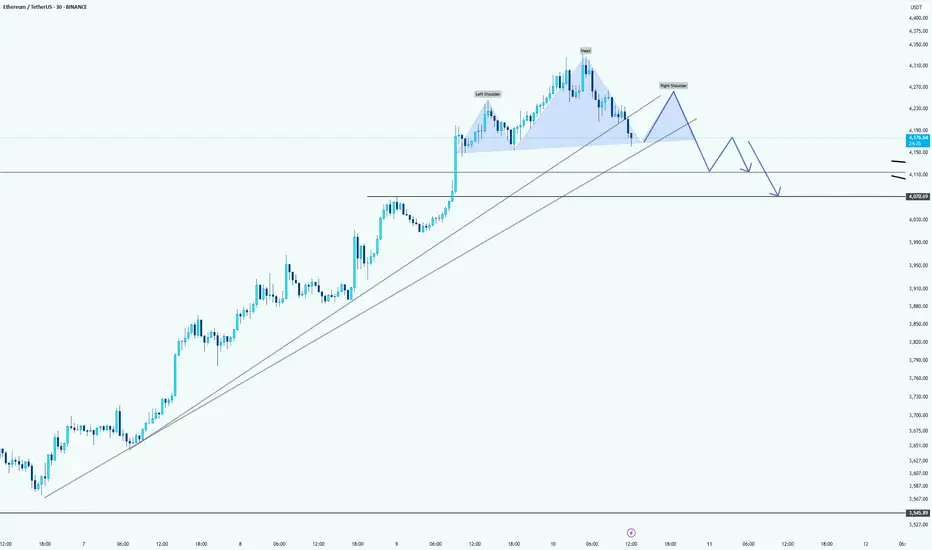
Ethereum: just a little bit correction hereHello guys!
Chart Pattern: Head and Shoulders
The chart shows a Head and Shoulders pattern forming on the Ethereum price action. The trendline drawn across the neckline of the pattern is a crucial support level to monitor.
Potential Breakdown:
If Ethereum fails to hold above the neckline (around $4,130), we might see a pullback and potentially a breakdown from the pattern. This suggests a bearish outlook for ETH in the short term.
Target:
A possible target for this bearish move could be around th e $4,050 - $4,100 range , where the price could find support from the upward trendline (in light gray). The price may retrace towards these levels before deciding whether it will continue higher or confirm further downside.
Uptrend Support:
Ethereum remains in an overall uptrend, as indicated by the sloping upward trendline beneath the price action. If the price pulls back to this trendline and holds, there could still be bullish potential.
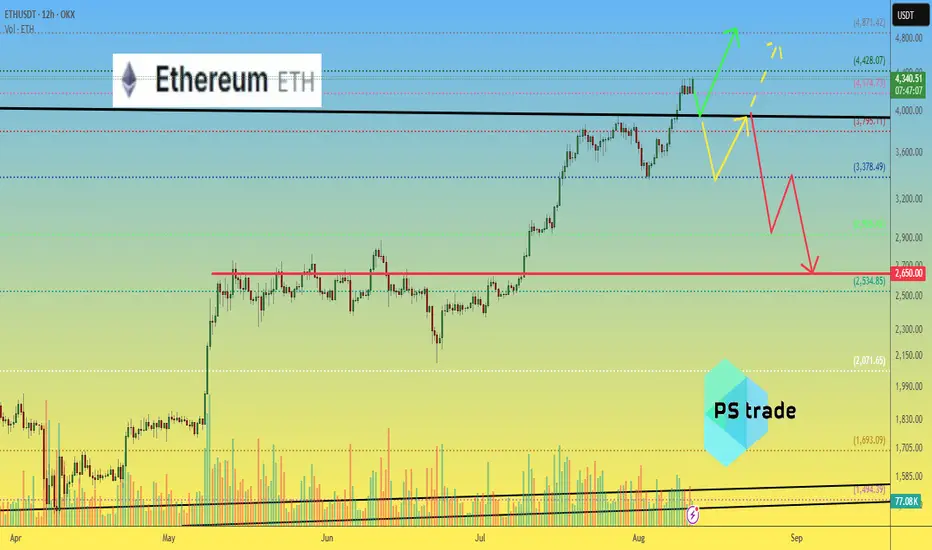
Ethereum ETH price analysis📉 Three possible scenarios for #Ethereum CRYPTOCAP:ETH :
🟢 Bullish:
Minor correction to $3950–$4000, followed by a breakout to new all-time highs (ATH).
🟡 Neutral:
Drop to $3400, bounce to $3950 — and then the decision point: breakout or breakdown?
🔴 Bearish:
Deeper correction to $2650 — possibly the last great buying opportunity before the next major rally.
👉 Which scenario for OKX:ETHUSDT resonates most with you?
Let us know in the comments!
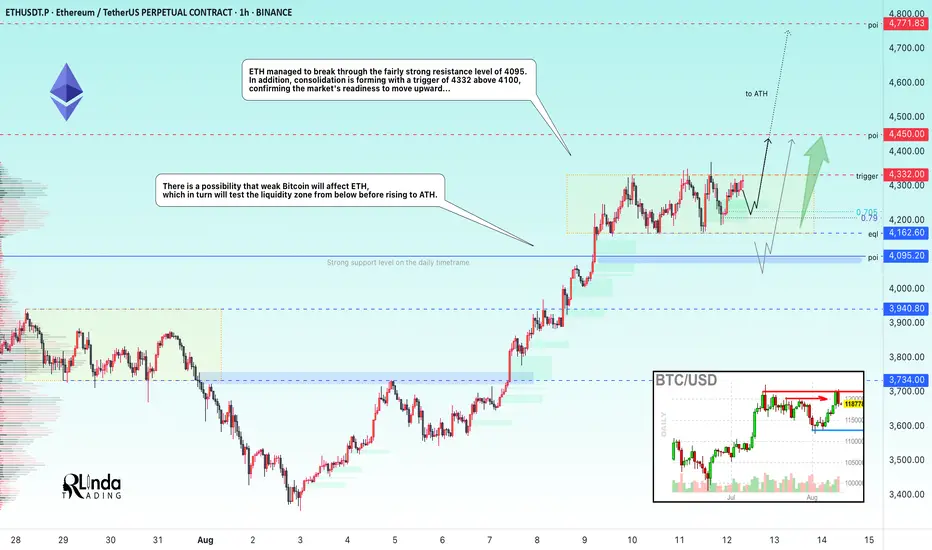
ETHUSDT → A new range has been opened. Onward to ATH!BINANCE:ETHUSDT is breaking through strong resistance formed in the 4090-4100 area on D1-W1. Consolidation is forming after strong growth, which can be seen as a positive sign.
Bitcoin has been looking quite weak recently against ETH, which continues to rally despite Monday's red market. ETH managed to break through the fairly strong resistance level of 4095, and after a strong 25% rally, the price moved into consolidation (trading range 4325-4160, with resistance at 4325 as the trigger). Technically, we see that the market has stopped updating local lows, and a fourth retest of resistance is forming with reduced volatility, which in general could lead to a breakout attempt. Consolidation of the price above the consolidation resistance could trigger further growth. A channel to the ATH is open...
Resistance levels: 4325, 4450, 4800
Support levels: 4220, 4162, 4095
ETH is quite strong and the market may not allow the price to fall too low, as there is a lot of excitement. However, I do not rule out the possibility that weak Bitcoin will affect ETH, which in turn will test the liquidity zone (4162 - 4095) from below before rising to ATH.
Best regards, R. Linda!
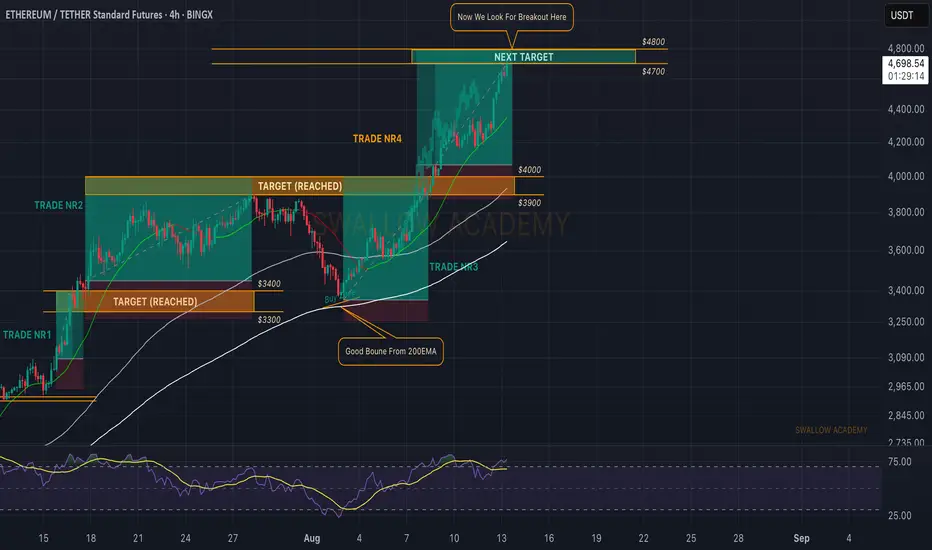
Ethereum (ETH): We Reached $4800 | Looking For Break & New ATHEthereum is the boss, pushing for a new ATH, where we reached our target with ETH and now the price is going for the new ATH (potentially).
We are going to wait out for a proper breakout here from that new ATH and once we get it, we expect a very volatile upside movement.
Swallow Academy
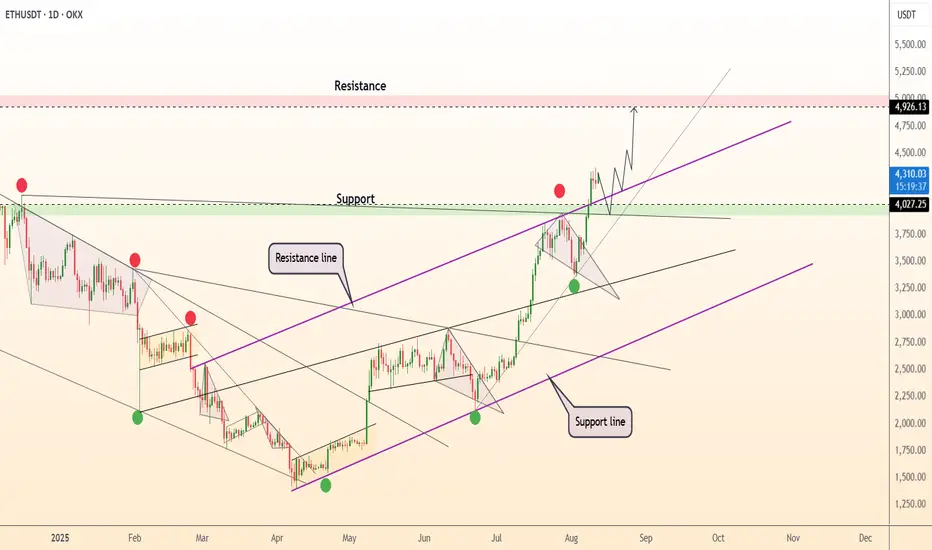
DeGRAM | ETHUSD above the resistance line📊 Technical Analysis
● ETHUSD broke above the long-term resistance at ~$4,027, confirming a bullish continuation from the rising purple trend channel.
● Price retested that breakout as support and is setting up for a measured move toward the key $4,926 supply zone, with on‑chart channel geometry and breakout structure supporting further upside.
💡 Fundamental Analysis
● Spot Ethereum ETFs surged with record trading volume of $2.725 B on August 11, signaling strong institutional and retail demand.
● Derivatives market is deepening—Ethereum futures open interest exceeded $30 B, while CME futures hit a record $7.85 B—as institutional flows fuel momentum.
● Corporate treasury adoption jumped sharply: small public companies now hold 966,000 ETH ($3.5 B), underscoring real‑asset confidence.
✨ Summary
Buy above $4,027; target $4,926. Setup remains valid while holding above $4,000.
-------------------
Share your opinion in the comments and support the idea with like. Thanks for your support!
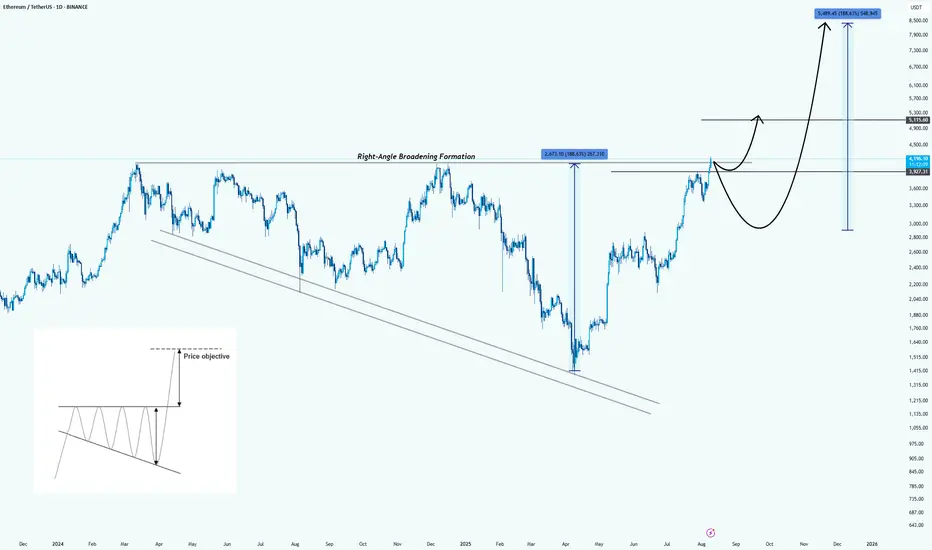
Ethereum: Formed a Right-Angle Broadening FormationHello guys!
Pattern Identified:
This is a Right-Angle Broadening Formation (characterized by a flat resistance level at the top (around $4,200 – $4,300) and a rising lower trendline). It shows increasingly volatile swings upward while repeatedly testing the same ceiling.
Technical Implication:
RABFs are typically bullish continuation patterns. The flat top acts as a breakout trigger, while the rising base indicates consistently higher lows and aggressive buyer support.
Price Objective:
According to the pattern’s measured move principle, the breakout target is projected by the vertical height of the formation, added to the breakout point:
Height : $2,070
Breakout point : $4,300
Target : $6,370 (first objective)
Extended bullish run could reach $8,500 if momentum sustains.
Key Levels:
Resistance: $4,200 – $4,300 (breakout trigger)
Support: $3,700, then $3,200
First measured target: $6,370
Extended target: $8,500
Bullish Scenario:
Strong daily close above $4,300 with volume could kickstart a rapid move toward the first target, possibly with only a brief consolidation at $5,100 before continuation.
ETHUSDT #009 (Be careful, need 15-20% correction for next cycleHello dear traders.
Good days.
First of all thanks for your support and comments.
————————————————————————
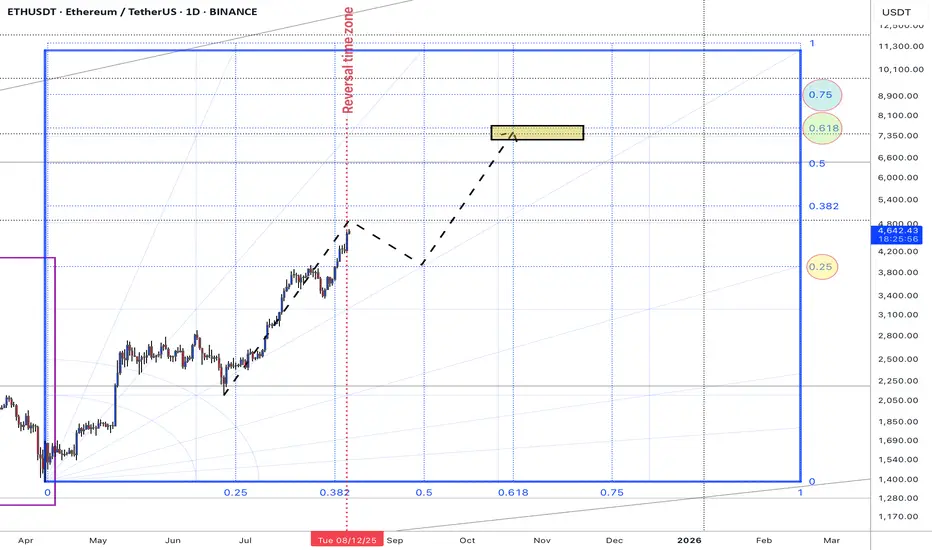
On daily Gann Square ETHUSDT break out 0.5 Gann Square price zone and with good strength trend line support it expected to fill 0.618 Gann box price level at exact reversal time zone .
So be careful and do not be FOMO . expected to grow up to 4800$ and correct 15-20 % correction for retest 0.5 Gann price zone .
If support at 3940-3915 $ will grow up fro next bull cycle .
BTC Dominance is mached also at exact time with ETHUSDT .
Weekly overview of ETHUSDT Chart will updated.
Good luck and safe trades.
Ethereum Breaks 504 Days Long Resistance · The 2025 Bull MarketEther just broke a 504 days long resistance. The next one is the 2021 all-time high which happened a massive 1,372 days ago. Early November 2021.
Ethereum is breaking all resistance. One is already gone and the next one will be gone very soon, just this week is the first time that ETHUSDT is moving freely after breaking the high from March and December 2024. This was a price level around $4,100 and this was a tough barrier.
First in March 2024 Ethereum started to decline from this price to a low of $2,111. The second time happened with a $1,385 bottom. This time, ETHUSDT is already trading at $4,725 so there is no resistance left.
The last all-time high is not a resistance level of relevance. It does have some psychological effects because people track it but the market isn't likely to stop there for any meaningful amount of time. The action is headed straight up.
You know we are open and aiming for $11,000 but right now $6,000 followed by $7,300 is an easy goal. Go higher.
Do you think Ethereum was expensive when it traded around $2,400?
Remember, "trading at bottom prices"? Not anymore.
Ethereum is ultra-bullish now and there is no going back, a new all-time high is upon us and once Ether hits a new all-time high, all bets are off. Everything will speed up and all the smaller altcoins will start to follow.
The high increase in trading volume that tends to happen on the third wave of a bullish impulse is not present here. In fact, there is no significant rise in trading volume since July 2022. The weekly session in April produced high volume but not higher.
This is good. This means that the best is yet to come. We haven't seen much yet. We still have to experience the bullish force, strong momentum, the completion of the third wave and then finally the fifth wave.
Whatever you do, keep holding long-term.
Ethereum is going up.
Namaste.

my view on ethAfter carefully observing the current ETH price structure, I’m leaning toward a bearish bias in the short to mid-term.
As always, this is not financial advice — just sharing my personal view based on market structure and price action. Risk management remains the most important tool in this game.

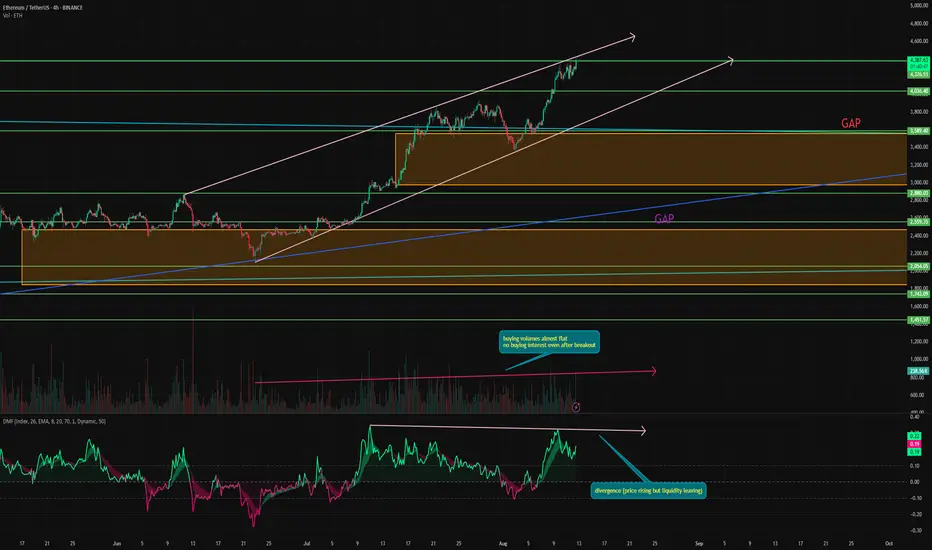
ETH looking bad while reaching ATHThe price is rewriting its local ATH and pushing for a breakout toward a new all-time high.
However… the chart still looks like crap.
How long can this kind of growth last? Let’s break it down:
➡️ First thing you notice — almost flat buying volume for the last two months. The price is climbing, but there’s practically no buying volume behind it. Historically, real breakouts to new highs are accompanied by massive volume spikes and strong volatility.
ETH, on the other hand, is just cruising up like a chill guy. That doesn’t mean there’s huge demand — it just means nobody’s in a rush to sell.
➡️ Money Flow — even worse. The indicator shows a divergence with price. These current levels were reached while liquidity was actually flowing out of ETH and positions were being closed. This only confirms that interest in the asset is still declining.
➡️ Along the way, two large gaps have formed — at $3556–2981 and $2474–1851. And as we all know, in 99% of cases, gaps get filled sooner or later.
➡️ Price is also still moving inside an ascending channel and is currently testing the upper boundary — right at the major resistance of $4377.
📌 Conclusion:
Right now, market sentiment on ETH is insanely bullish. People are already talking about $10,000 like it’s around the corner. But the chart doesn’t look genuinely impressive — similar to what we saw with Bitcoin last year.
In my view, even $5,000 seems like a distant dream at this point. And let’s not forget — we’ve had an unreal bullish summer, which is extremely rare for crypto. Do you really think this rally will just keep going in September? And in October? And that bear markets are gone forever?
Yeah… not so fast 😁
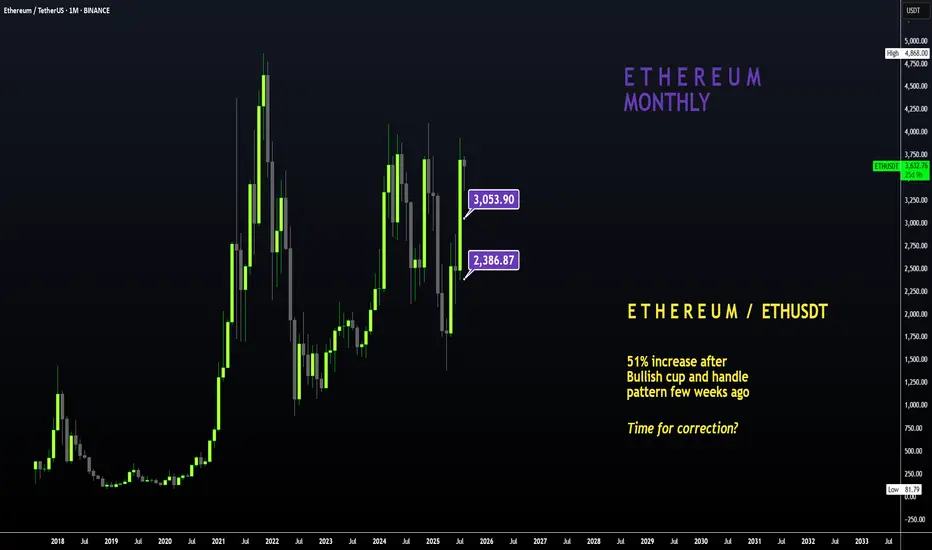
ETH | NEW ATH or DUMP ?Ethereum recently peaked at $3900. And allthough this is not a new ATH (close by a few hundred dollars), it is a local high for the year.
My last update was on an inverse Head and Shoulders pattern on ETH, which has since increased over 50%:
(The original idea here:)
The question now, is what's next for ETH - further increase, or are the increases over for the near term and is a correction more likely?
I'm going to say that the increases for ETH are over for now. This is because we correction is most definitely due after such a large increase in a fairly short timeframe. I'm not saying we're heading into a full out bearish cycle, but a 20-25% correction would be most normal at this point.
Additionally, XRP has also made it's peak and lost the high, now trading just under $3. This is a strong sign that the alts have likely already rallied, since XRP used to be the last to increase (if it increased at all, historically. (Thanks Jedd).
I was very lucky to call that top here:
Either way, buyers may use this correction to scoop up on smaller alts over the next few weeks. This ultimately depends on whether the market has ONE MORE pump, and if the correction will bounce back from a 20-25% pullback.
_________________
BINANCE:ETHUSDT
ETH at 4.5 yr resistance. Whats next ??1) if it brakes resistance it goes to $5k sooner
2) if it gets rejected at resistance it goes to $5k later
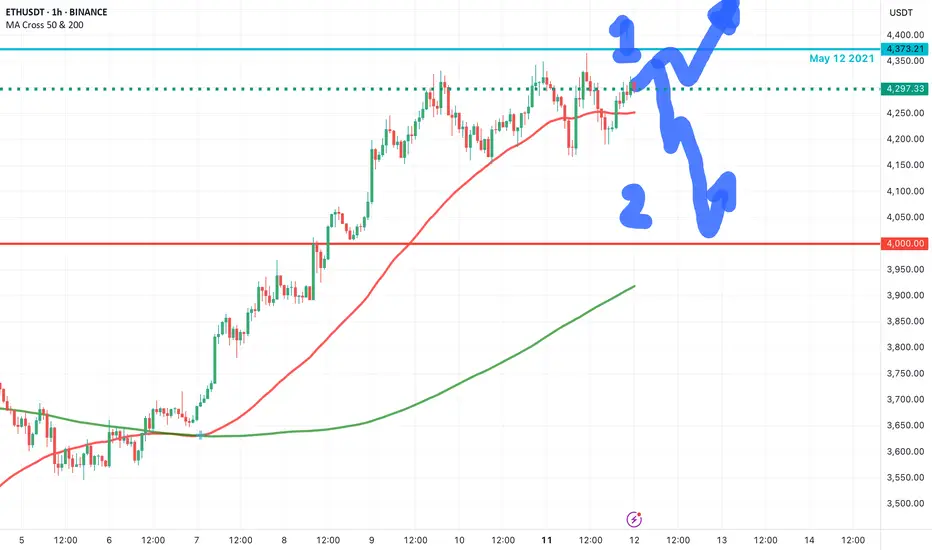
Eth I also changed my mind about Ethereum. Let's see what happens. Does the math work out? Let's go see.

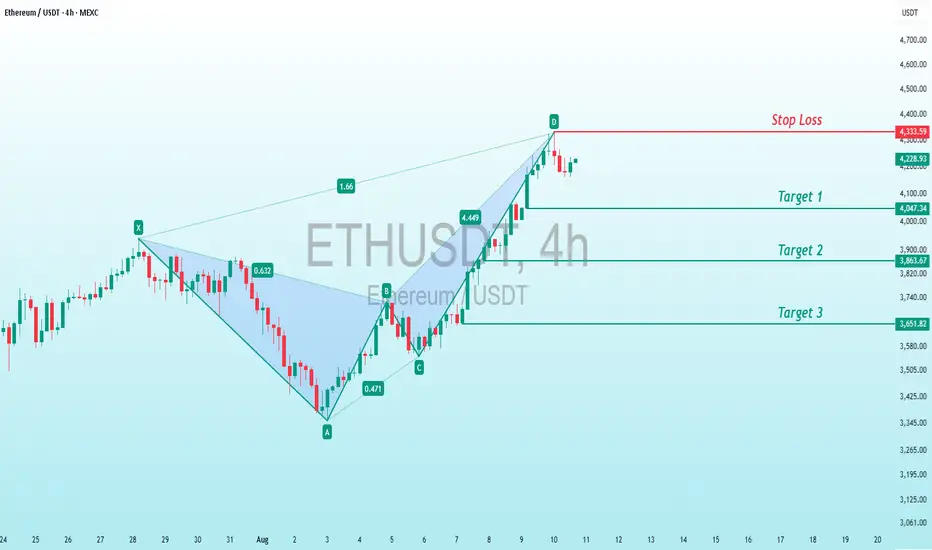
ETHUSDT 4H Breakout: Symmetrical Triangle Targets AheadMEXC:ETHUSDT
Key Elements:
Pattern: The chart shows a symmetrical triangle pattern formed by two converging trendlines connecting the highs (resistance) and lows (support). The breakout appears to have occurred upward from point D, with a measured move of 1.683 times the height of the triangle (from 0.619 to 4.49).
Price Levels:
Entry/Breakout Point (D): Approximately 4.49.
Stop Loss: Set at 4,333.59, just below the upper trendline and recent high.
Targets:Target 1: 4,047.34.
Target 2: 3,963.67.
Target 3: 3,651.82.
The price range spans from around 3,250 to 4,500 USDT.
Indicators:The triangle's height (0.619) and the breakout move (4.49) suggest a calculated target projection.
Green and red candlesticks indicate bullish and bearish periods, respectively.
Analysis:The upward breakout from the triangle suggests bullish momentum, with the price potentially aiming for the listed targets.
The stop loss at 4,333.59 is strategically placed to limit downside risk if the breakout fails.
The targets decrease incrementally, indicating a possible profit-taking strategy as the price progresses.
Eth next target All time high1D bullish FVG with a strong weekly bullish FVG will definitely push ETH to All time high

Ethereum Ready to Attack Resistances — Time to Long ETH?Ethereum ( BINANCE:ETHUSDT ) fell to the Support zone($3,538-$3,442) and Support lines as I expected in the previous idea .
Ethereum is currently trading near the Support zone($3,538-$3,442) , Support lines , and Cumulative Long Liquidation Leverage($3,559-$3,524) .
In terms of Elliott Wave theory , it seems that Ethereum has completed the main wave 4 . The main wave 4 has an Expanding Flat structure(ABC/3-3-5) . To confirm the main wave 4, we must wait for the Resistance zone($3,771-$3,677) and Resistance lines to be broken.
I expect Ethereum to trend higher in the coming hours and attack the Resistance lines and Resistance zone($3,771-$3,677) .
Cumulative Short Liquidation Leverage: $3,672-$3,645
Note: Stop Loss: $3,450 =Worst
Please respect each other's ideas and express them politely if you agree or disagree.
Ethereum Analyze (ETHUSDT), 1-hour time frame.
Be sure to follow the updated ideas.
Do not forget to put a Stop loss for your positions (For every position you want to open).
Please follow your strategy and updates; this is just my Idea, and I will gladly see your ideas in this post.
Please do not forget the ✅' like '✅ button 🙏😊 & Share it with your friends; thanks, and Trade safe.
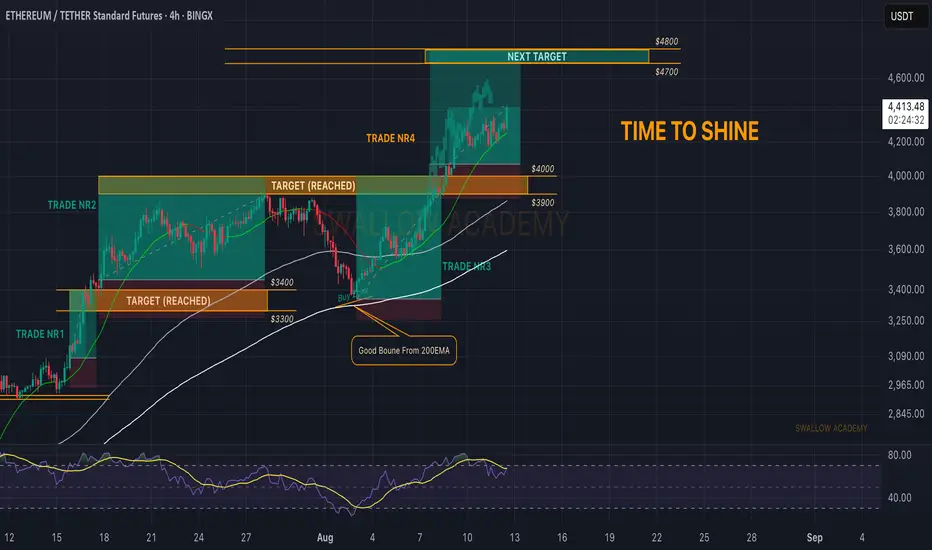
Ethereum (ETH): Time To Shine | Easiest Coin To Trade | $4800ETH has been performing more than well; since $3000, we have been hunting multiple trades and so far all of them have played out well.
Currently our 4th trade is in process, where we are aiming to see the ETH at $4800, which most probably will happen, considering the dynamics of the current money inflow we are having on ETH.
Bitcoin had its time; now it is Ethereum's turn.
Swallow Academy
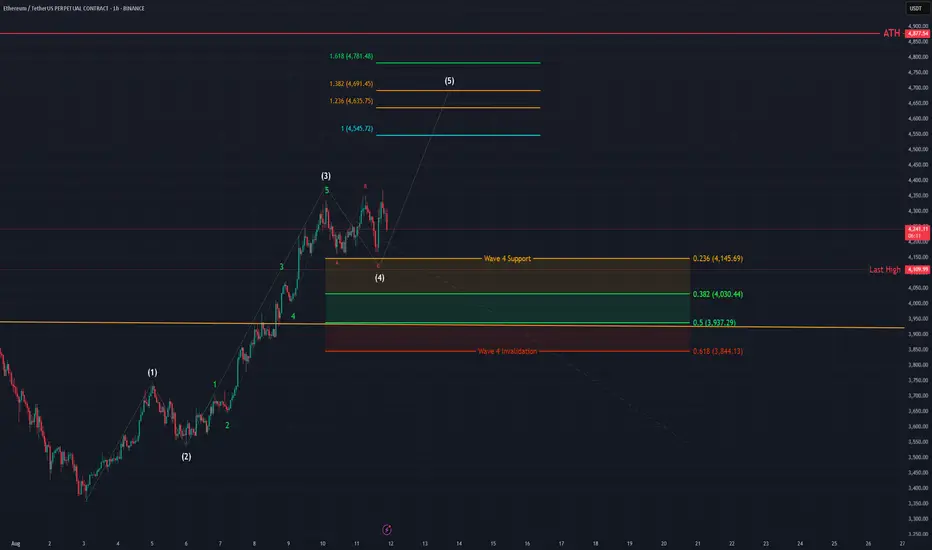
ETH - 1H Elliott Wave Analysis - 11.08.25Welcome to our updated Elliott Wave Analysis for Ethereum which has been showing a lot of strength and bullish momentum recently.
We're assuming that we finished the white Wave 3 and probably even the white Wave 4 in the red ABC which would mean that we possibly started the white Wave 5 already.
We want to communicate the white Wave 4 support area in case we get an extended correction.
The white Wave 4 support area lies between the 0.236 FIB at 4145 USD and the 0.5 FIB at 3937 USD. We also have a lot of potential support at around 4000-4100 USD which is a psychological level as well as recent highs that we have broken which can spark buying interest around that zone.
The first targets for the white Wave 5 would be the 1 to 1 FIB at 4545 USD, the 1.236 FIB at 4635 USD, the 1.382 FIB at 4691 USD and if we get an extended 5th Wave the 1.618 FIB at 4'781 USD.
Thanks for reading.
NO FINANCIAL ADVICE.