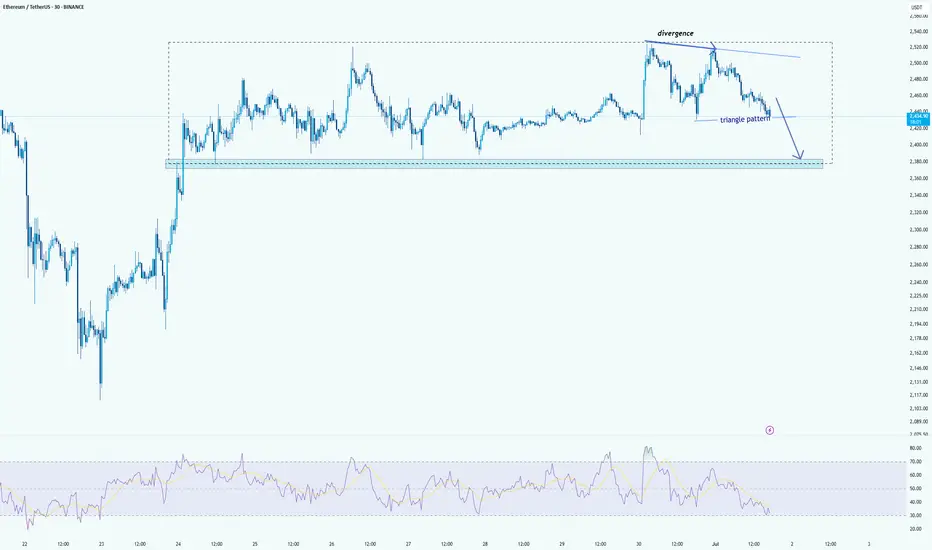
ETH 30min: Bearish Triangle Forming After RSI Divergencehelo guys
Ethereum is currently trading within a clear range, and recently formed a bearish triangle pattern near the top of the consolidation. A visible RSI divergence confirmed the loss of bullish momentum as price made a higher high, but RSI printed a lower high — a common sign of exhaustion.
Now, ETH is moving downward within the triangle, and pressure is building near the lower edge of the range. If the pattern breaks down as expected, the next likely move is a drop toward the support zone around $2,370–2,380, which marks the bottom of the range.
This setup shows a typical structure:
Divergence → Triangle → Breakdown toward range low
Unless price reclaims the triangle top quickly, bears have the upper hand in the short term.
ETHUSDT.P trade ideas
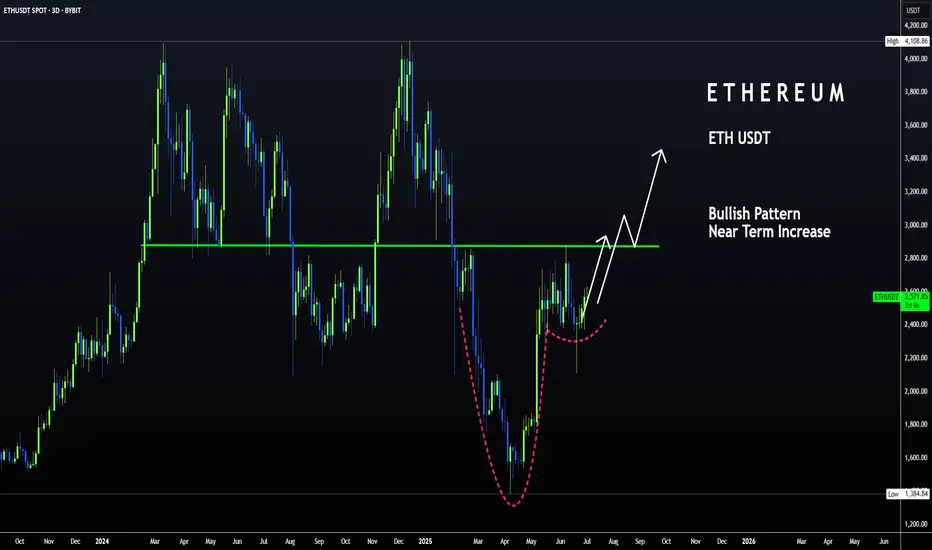
ETH | Bullish Pattern - Cup and Handle +15%A Bullish pattern is appearing on the Ethereum chart.
From a Cup and Handle pattern, we can easily expect atleast a 15% increase. This is true for the near term. A +15% would put us here:
Just under $3K we may see heavy resistance. This is also the neckline resistance, as it was the previous support for the breakout that ultimately led to a new ETH ATH.
_______________________________
BYBIT:ETHUSDT
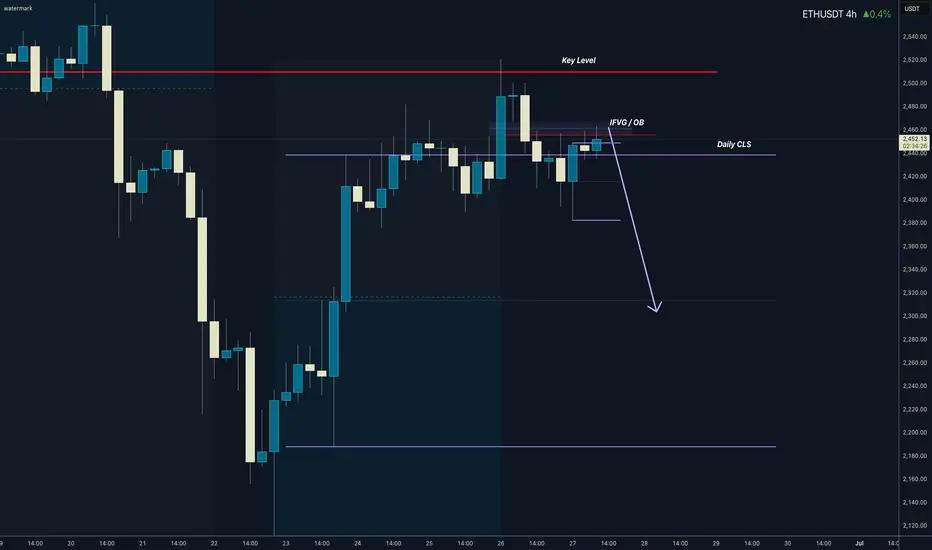
ETHUSDT.P I Daily CLS I KL OB I Model 1Yo Market Warriors ⚔️
Fresh outlook drop — if you’ve been riding with me, you already know:
🎯My system is 100% mechanical. No emotions. No trend lines. No subjective guessing. Just precision, structure, and sniper entries.
🧠 What’s CLS?
It’s the real smart money. The invisible hand behind $7T/day — banks, algos, central players.
📍Model 1:
HTF bias based on the daily and weekly candles closes,
Wait for CLS candle to be created and manipulated. Switch to correct LTF and spot CIOD. Enter and target 50% of the CLS candle.
For high probability include Dealing Ranges, Weekly Profiles and CLS Timing.
Trading is like a sport. If you consistently practice you can learn it.
“Adapt what is useful. Reject whats useless and add whats is specifically yours.”
David Perk aka Dave FX Hunter
💬 Don't hesitate to ask any questions or share your opinions
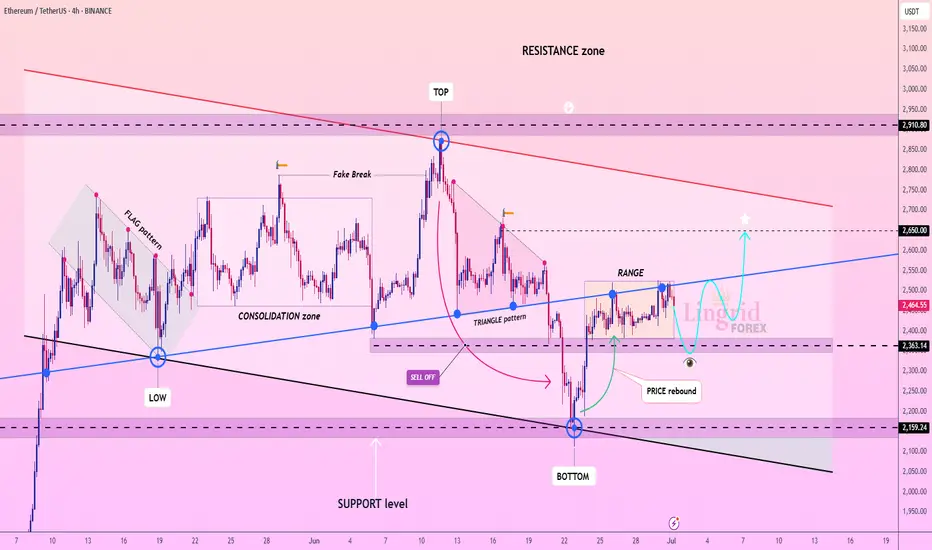
Lingrid | ETHUSDT Price Compression and Expansion PhasesBINANCE:ETHUSDT is struggling to hold gains after a rejection from the top of the range, with price retracing back toward the breakout point and key trendline support. The structure remains intact above 2,363, where bulls may attempt another rebound. A sustained move above the blue ascending trendline would open the way toward the 2,650 target, completing the projected rebound path.
📈 Key Levels
Buy zone: 2,363–2,400
Sell trigger: breakdown below 2,363
Target: 2,650
Buy trigger: breakout and retest of 2,475–2,500 with volume
💡 Risks
Failure to hold the trendline could push price toward 2,159
Weak follow-through may stall near 2,550
Bearish engulfing from current range top can trap early buyers
If this idea resonates with you or you have your own opinion, traders, hit the comments. I’m excited to read your thoughts!
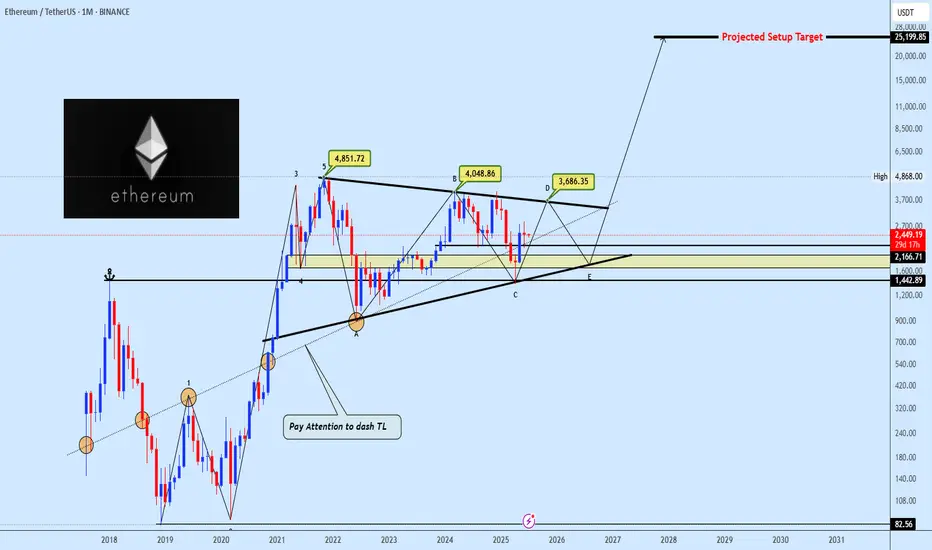
ETHUSDT Long Term Structure Signals Imminent ExpansionEthereum has been consolidating within a large-scale symmetrical pennant formation following its peak at $4,851. This macro structure, spanning several years, reflects sustained accumulation within a clearly defined corrective range, bounded by well-established trendline support and resistance.
After reaching its all-time high, ETH entered a structured correction that has unfolded into what appears to be an ABCDE wave pattern. Currently, price action is developing near point D, approaching the upper boundary of the pennant a crucial area that could define the next directional move.
In addition, the daily chart presents a developing Inverse Head and Shoulders (IH&S) pattern, with the neckline anchored around $2,855. This level is acting as a key resistance, temporarily halting ETH’s short-term upside. A confirmed breakout above the neckline would likely validate both the IH&S and the breakout from wave D, setting the stage for a potential expansion move toward the $6,000 target and beyond.
However, in the event of a temporary rejection at the neckline or pennant resistance, a retracement toward wave E becomes likely. This would bring price back into the $1,400–$1,800 support region a high-confluence demand zone that aligns with the long-term ascending trendline, previous breakout levels, and multiple historical reaction points. This zone may serve as a base for a strong bullish reversal.
Recent price behavior shows compressed volatility and increased buying interest on dips, reinforcing the possibility of an imminent directional breakout. A decisive move outside this macro structure may mark the beginning of a new phase of long-term price expansion.
Share your view with us in the comments, how do you see ETH playing out from here?
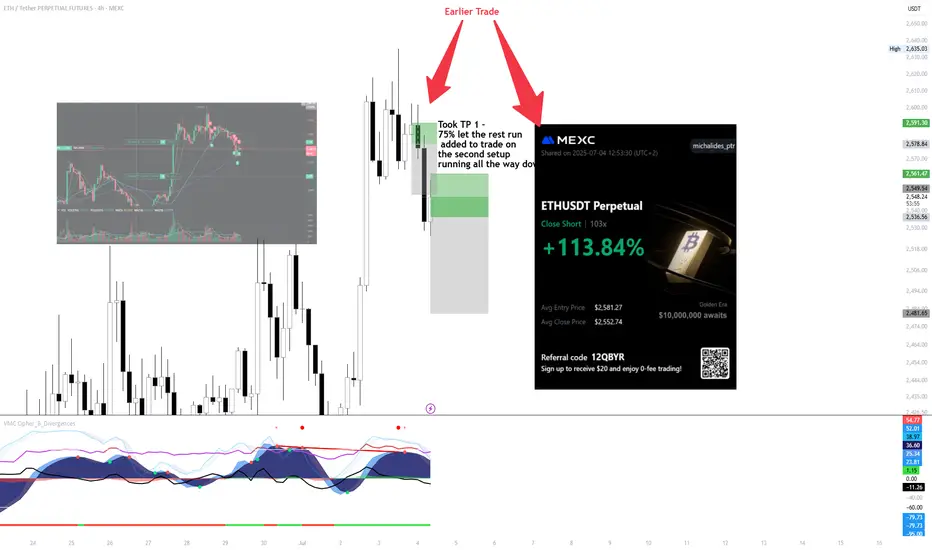
ETH SHORT SCALP ! to 2500
Executed an ETH short from the earlier setup — took 75% profit at TP1, then let the rest run.
Price pulled back into the secondary zone, added to the position with structure confirmation.
Let it roll into the next leg — clean execution, solid momentum follow-through.
+113.84% on the full move, managed with scale-out and conviction on the retest.
Patience paid. System did the work.
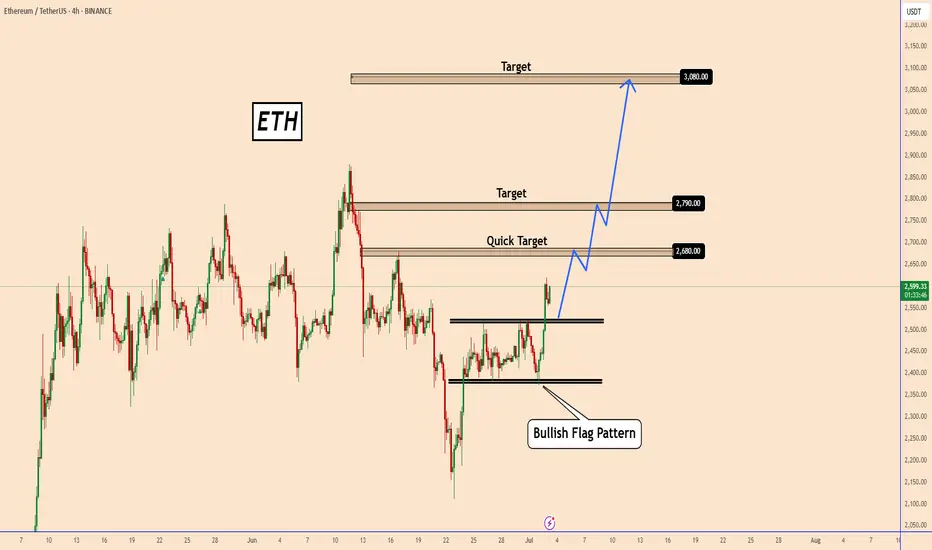
ETH Completes a Clear Bullish Flag Pattern! What’s Next?ETH Completes a Clear Bullish Flag Pattern! What’s Next?
Yesterday, Ethereum completed a bullish flag pattern.
This is a clear signal that bulls are already increasing their long positions.
If this is not a false breakout, then ETH could start from a normal bullish move to a larger one.
Today’s NFP data and the US market's preparation for a long weekend before the 4th of July could support this bullish scenario.
Key Target zones: 2680, 2790 ,and 3080
You may find more details in the chart!
Thank you and Good Luck!
PS: Please support with a like or comment if you find this analysis useful for your trading day
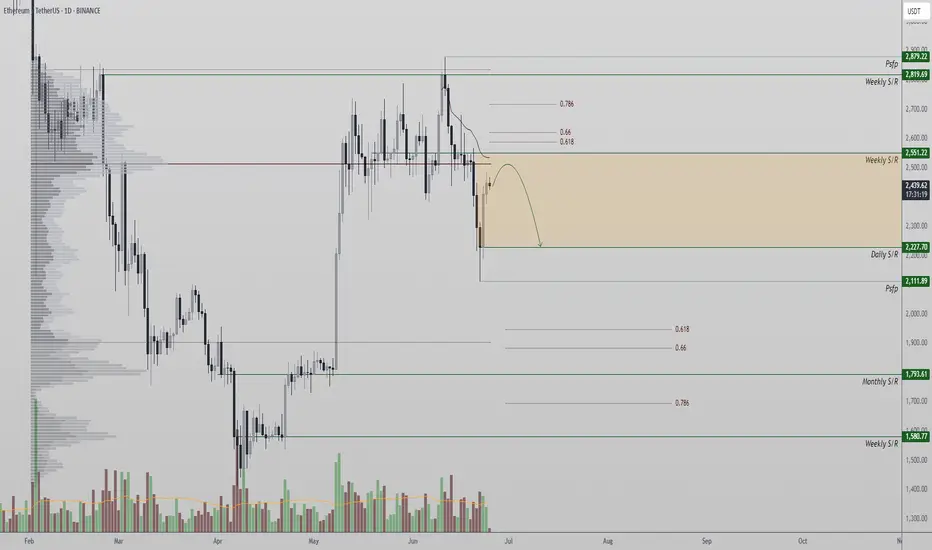
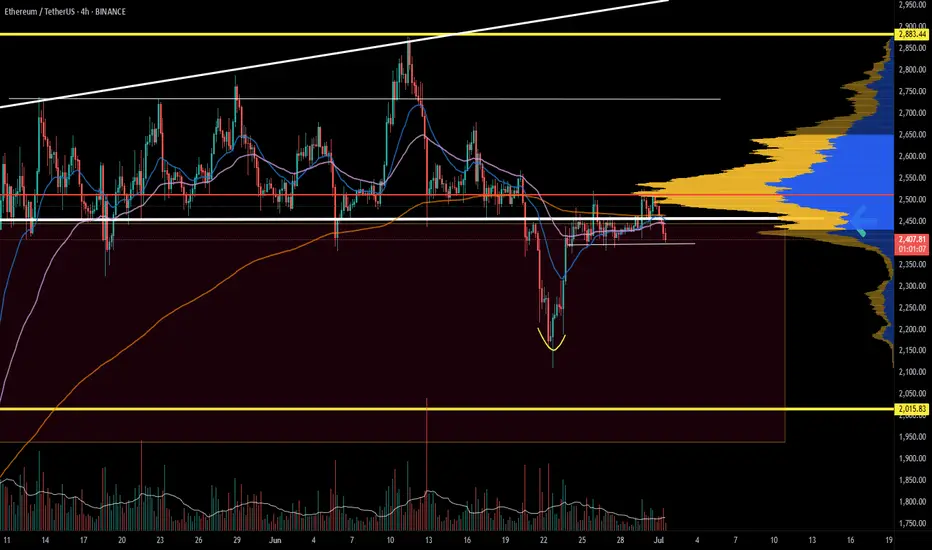
Ethereum at Key Resistance After Short Squeeze BounceEthereum recently found a local bottom at $2,111, triggering a sharp bounce that resembles a short squeeze. However, the rally has met a significant resistance zone—a former support level now flipped into resistance. This zone is technically loaded with multiple confluences: the point of control, the VWAP, the 0.618 Fibonacci retracement, and the $2,550 weak resistance area. Reclaiming this zone is essential for Ethereum to regain bullish momentum.
Structurally, the daily market structure has shifted. The previous trend of consecutive higher highs and higher lows has been broken with the recent drop, signaling a bearish structural shift unless key levels are reclaimed.
If Ethereum fails to break and hold above $2,550, the current move may confirm as a bearish retest, increasing the likelihood of a rotation back to $2,227 in the near term. A loss of $2,227 would open the door for a much deeper correction, targeting the $1,790 support zone—a critical level that acted as a base during previous consolidations.
At this point, Ethereum sits at a pivotal juncture. The reaction at current resistance will determine whether bulls can regain control or if bears will drive the next leg lower.
Why You Still Lose Money Even With Perfect AnalysisYour setup was on point, your entry was clean, your stop-loss was tight.
Everything looked perfect.
And yet, you still lost.
Maybe the real issue isn’t in your chart, maybe it’s in your head.
Hello✌
Spend 3 minutes ⏰ reading this educational material.
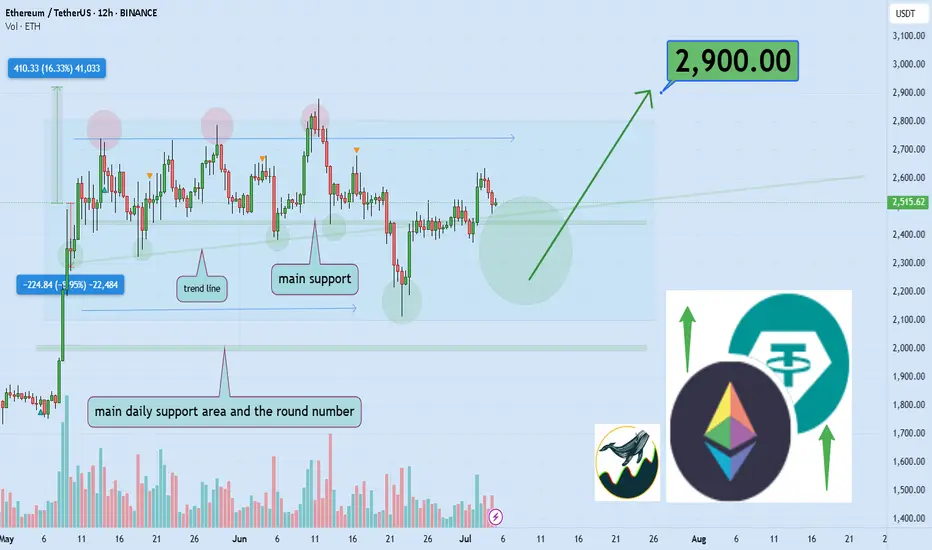
🎯 Analytical Insight on Ethereum:
BINANCE:ETHUSDT is currently trading inside a well-defined parallel channel 📈. It is approaching a key daily support level that coincides with an important ascending trendline. A breakout above this channel could lead to a bullish move, targeting at least a 16% gain with a primary resistance zone near $2900 🚀. Monitoring how price reacts around this area will be critical for confirming the next leg up.
Now , let's dive into the educational section,
🧠 Analysis Is Half the Game
Having a clean technical analysis doesn’t guarantee anything if your behavior ruins it.
Most traders change their minds mid-trade because of fear, hope, or noise from other sources.
Market psychology doesn’t always respect your Fibonacci retracement. You might be right and still lose because you couldn’t hold on to the plan.
🕒 Don’t Enter Before the Market Does
Timing is underrated. Many traders get in too early. Your analysis may predict a breakout, but price isn’t ready yet.
Zoom out. A solid setup on the 1-hour chart might need confirmation from the 4-hour or daily.
A great trade is not just where you enter, but when.
😤 It’s Not the Chart — It’s Your Mind
Many times, the chart setup is perfect. But when price wobbles a bit, you lose confidence.
Imagine this: a clean uptrend, higher highs forming, but a small retracement hits and you close the trade. Why? Fear. Not logic.
You lost not because of analysis, but because you couldn’t handle being right under pressure.
📊 TradingView Tools: More Than Just Indicators
If all you're using in TradingView are the typical RSI or MACD indicators, you're barely scratching the surface.
Tools like Bar Replay can simulate real-time reactions to past price action, not just for backtesting, but for testing your discipline under real psychological pressure.
Try this: pick a point where you lost money despite solid analysis. Use Bar Replay and “re-live” the chart without knowing what happens next. Was your entry early? Did you panic exit? Or did your stop-loss placement ignore structure zones?
Also, use the Long/Short Position Tool to visually plan your risk/reward, and adjust your bias if the chart structure doesn’t validate it.
For those wanting a deeper layer, add Volume Profile Fixed Range to identify value zones, where whales are active, and overlay it with your own trade setup.
TradingView isn’t just a charting platform. It’s a behavioral mirror. You don’t just look at the chart, it shows how you act when money’s on the line.
🎯 Your Stop-Loss is for the Chart, Not Your Emotions
If your stop-loss is placed based on what feels safe rather than key market structure, you’re not trading the chart. You’re managing anxiety.
Let structure dictate where your risk lies, not your nerves.
😬 Not Executing = Not Trading
If you don’t follow through with your own trade plan, your analysis is meaningless.
Did you cut early just because a big red candle scared you? Or because someone tweeted a bearish take?
That’s not discipline, that’s reactive trading. It has nothing to do with your original logic.
📉 Losses Are Part of Trading… But Not These Ones
There’s a difference between calculated losses and emotional mistakes.
The first is expected, even professional. The second will drain your account and confidence.
Take losses when the plan fails, not when your emotions freak out.
🔍 Reverse-Engineer Your Entry Logic
Next time you trade, take a screenshot and write down your full reasoning.
Why this entry? What did you see? How will you exit?
Later, go back and compare it to what actually happened.
This habit alone can fix more issues than a dozen trading books.
💡 Perfect Analysis ≠ Profitable Trading
Analysis opens the door, but execution and consistency keep you in the room.
Most traders think the problem is their indicator, but it’s usually the part of themselves that doesn’t listen to the indicator at the critical moment.
🧠 The Power of “Logged Experience”
The real difference between amateurs and veterans isn’t screen time. It’s tracked behavior.
Use TradingView’s built-in Note feature, place icons or comments on every trade setup, and keep a record of your actual thought process.
That feedback loop is gold. It builds self-awareness, the rarest edge in trading.
📺 Make It Visual to Make It Stick
Don't rely solely on indicators.
Use Chart Pattern Drawing Tools, head and shoulders, flags, triangles, and reinforce visual memory.
Also, by managing Visibility Settings, you can keep your charts clean while viewing different structures across timeframes.
The result? You start to see the story behind price, not just numbers.
🔚 Final Thought
If you're still losing money with accurate analysis, maybe it’s time to analyze your reactions instead.
TradingView gives you the tools, but the real upgrade is learning to trust your system under stress.
✨ Need a little love!
We put so much love and time into bringing you useful content & your support truly keeps us going. don’t be shy—drop a comment below. We’d love to hear from you! 💛
Big thanks , Mad Whale 🐋
📜Please remember to do your own research before making any investment decisions. Also, don’t forget to check the disclaimer at the bottom of each post for more details.
When does Bolran start?Read carefullyhello friends👋
💰Many of you are asking when Bolran will start or if it will start at all, we decided to explain it to you in a full post.
Well, you can see the Ethereum chart moving in a channel, and with a drop, it created a big fear that a fall is coming, and meanwhile, the buyers returned the price to above 2000 dollars with a strong and unexpected return.
✅️Now the price is stuck in the specified box between 2200 and 2500, and if this range is maintained, the price will easily move up to the range of 3200 in the first wave, and if it fails to maintain this range, the price will fall below 1500 dollars.
🧐Now, in our opinion, due to the rapid return of the price from the channel, this failure is a fake channel and the range will be maintained, and we are likely to see Ethereum rise in the coming weeks.
🤔You know that Ethereum is the leader of altcoins, and if it grows, important altcoins will grow, which is the beginning of Bolran, and there are important altcoins that can be used for good profit.
🌟You can join us if you like.🌟
🔥Follow us for more signals🔥
*Trade safely with us*

ETH/USDT High winning scalping signals in 15 minutes are as foll- Signal: LONG
- Admission: 2,436 ~ 2,442
- Take Profit: 2,462, 2,478

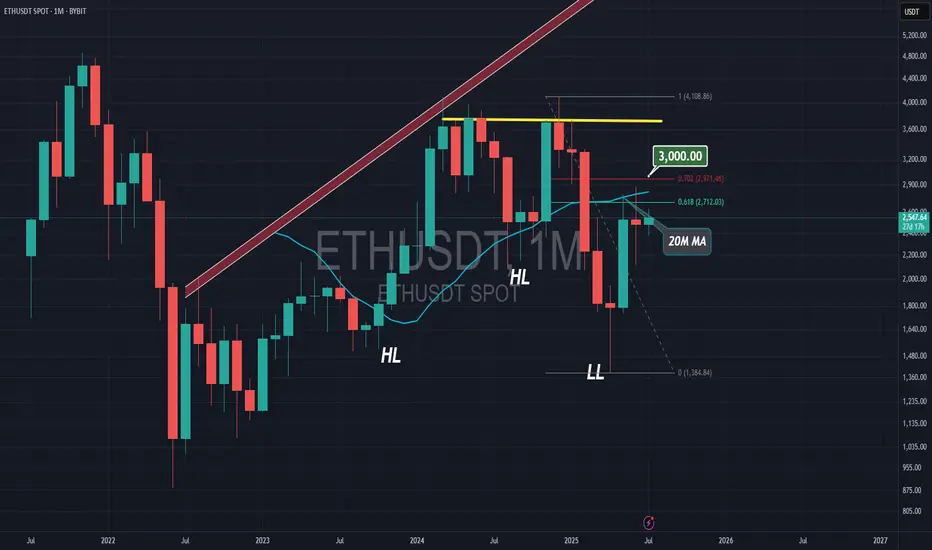
Ethereum in JULYEthereum should close above $3000 by the end of July to stay in the bull run, Monthly candle is so important now.
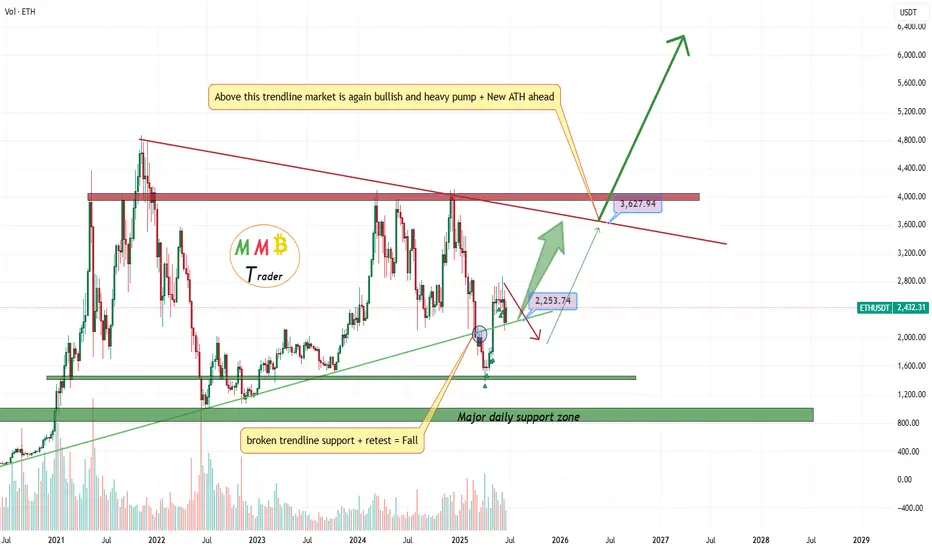
ETHusdt soon above 3K$Two major weekly supports now are 2200$ and 2000$ and we can expect more pump and heavy rise to start from these area first target is near red trendline resistance and then after breaking that here we can expect new high and more rise.
DISCLAIMER: ((trade based on your own decision))
<<press like👍 if you enjoy💚
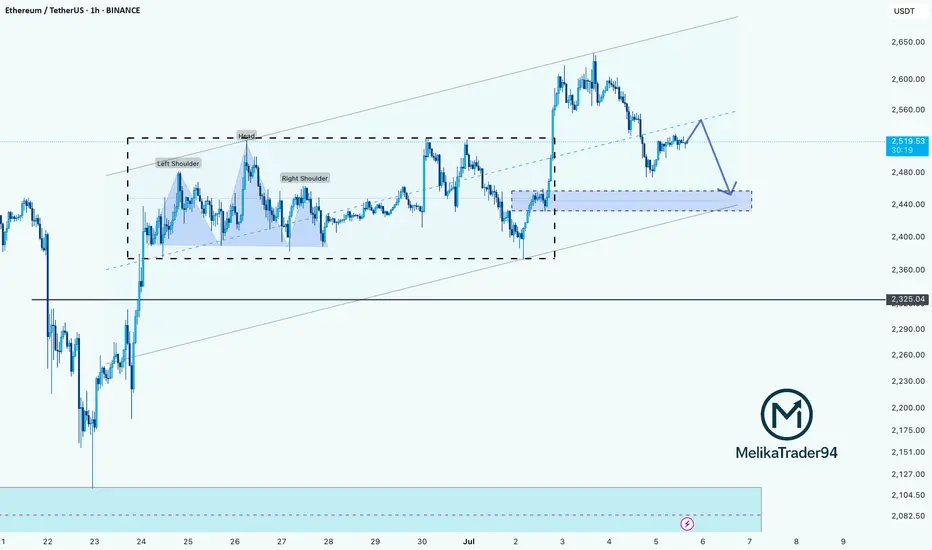
Ethereum Faces Key Resistance: Potential Pullback AheadHello Guys!
What I see:
Head and Shoulders Pattern:
Left Shoulder: Formed
Head: Peak, followed by a drop.
Right Shoulder: Formed.
The neckline break around $2,450 initiated a downside move, confirming the bearish setup.
Current Price Action:
ETH is currently trading near $2,519, attempting to reclaim the broken neckline zone, which now acts as resistance.
The price action is showing lower highs, hinting at weakening bullish momentum.
Bearish Retest in Progress:
The chart shows an anticipated bearish retest of the support-resistance flip zone ($2,530–$2,550), with a probable rejection leading ETH back down toward the $2,440–$2,450 support zone.
Demand Zone:
A strong demand area is visible between $2,420–$2,450. Price may revisit this zone before making the next major move.
Trend Channel:
ETH is moving within an ascending channel, and the lower bound coincides with the highlighted demand zone.
________________________
Let's check this deja vu:
You can see that previously the price formed an H&S and after that did a hunting of the head! And after that price experienced a drop there! Same scenario here!
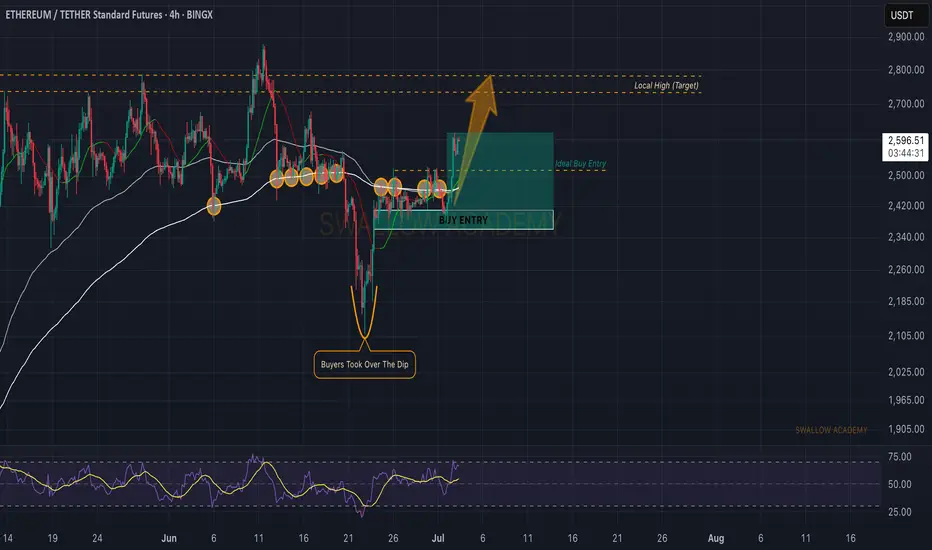
Ethereum (ETH): Buyers Above The EMAs | Looking For $2800Buyers are back in control where they secured the lines of EMAs, which means that we are expecting the $2800 to be reached this week.
Now, despite us currently seeing some kind of weakness in markets, we think that EMAs will still be holding it's ground so as long as we are above them, we are bullish here!
Swallow Academy


ETH needs support now. ETH is holding up by a thread. There are signs of weakness in the market, and if the Ethereum price breaks below support, it is likely we will see follow-through.
Full TA: Link in the BIO
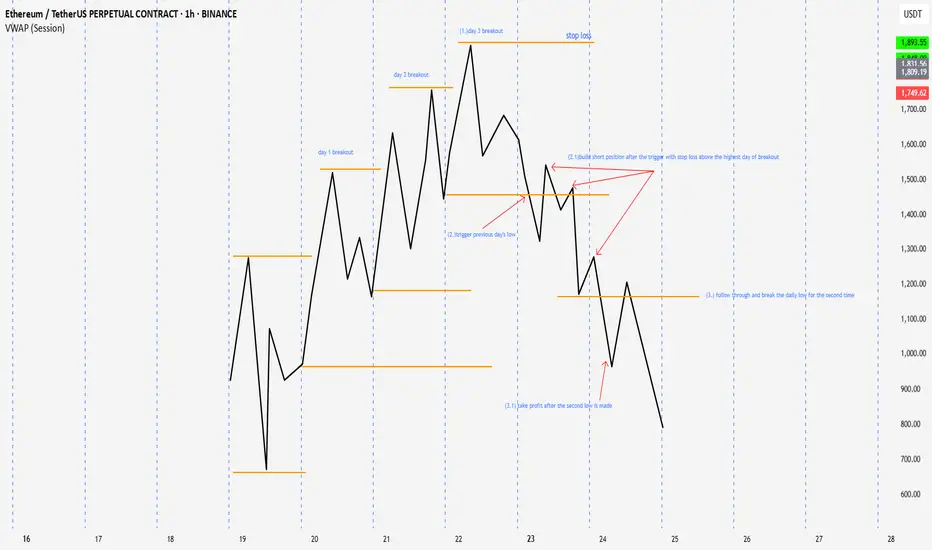
doing the homeworktesting 3days of breakout, frd,fgd, day one false break with the break of daily level as trigger to start to build position. for entry . buy if it dip below daily vwap during the sessions. stop is above the high or the low of the signal day. targeting the second push. for inside day, trying to capture the false break back to the other side or daily high or low 90% winrate. let see when I apply it in real time

FRD/FGDFRD happen when there is a red day after 2 or more breaks of daily high to the up side. after the trigger to the downside, it will be highly likely to continue to breakdown
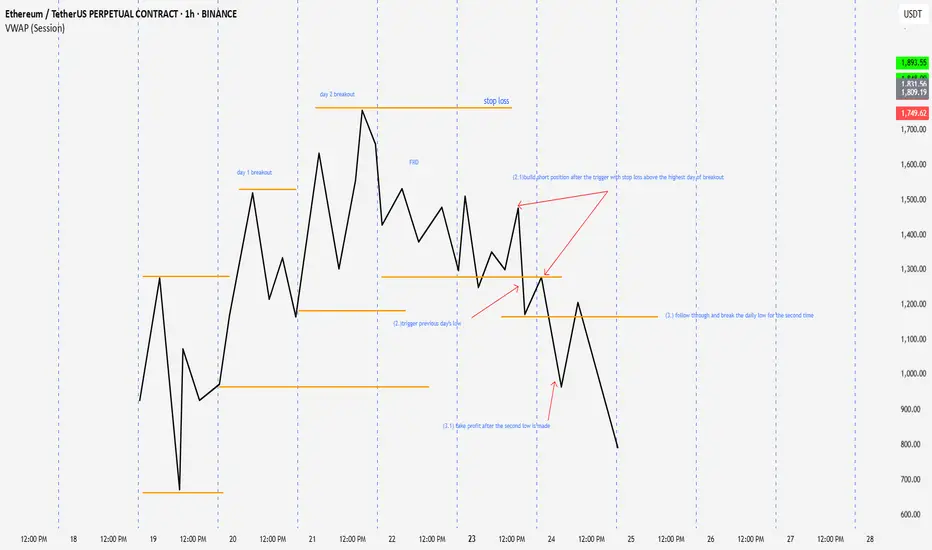
false break set upafter 2 higher highs or more has been made then a day trades above the previous day's high but close back inside the range, it is D1. after the break of previous day low, it is high probable that it will continue the reversal
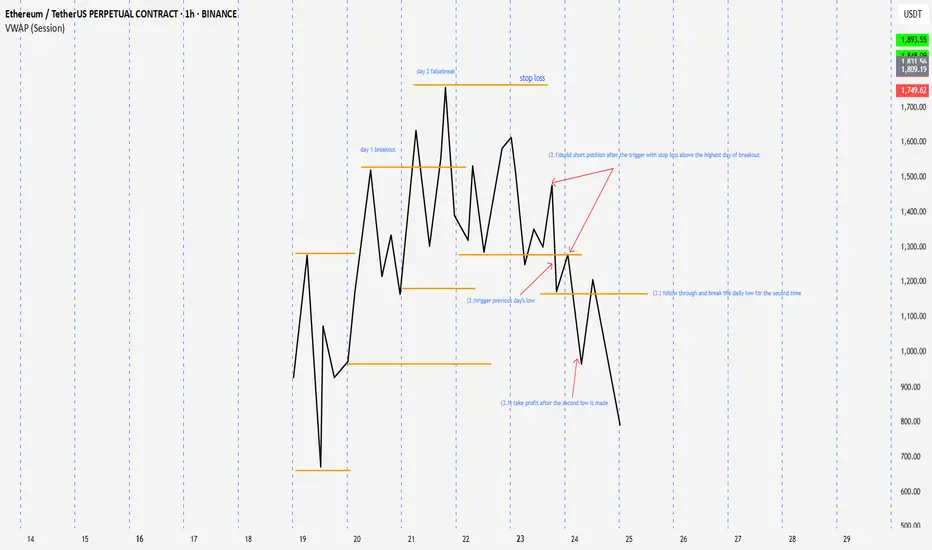
3 days of breakoutafter three days of break out and a break of daily level to the opposite side. it high probable that it will continue the break
ETH, hinting of a monster RISE from 2.4k to 4k... SEED NOW!ETH has been the most stubborn pair in comparison to BTC. Its price behavior is almost opposite that of BTCs with unstable volatility the last 2 years -- and thats an understatement.
But from what we know based on its historical movement -- ETH, when it gets into the zone, theres no stopping this sleeping giant to capturing new heights. And that's what we're sensing now with initial hint of BIG SHIFT transpiring this month based on its latest long term metrics.
From our diagram above. Here is what we observed.
LONG TERM MOMENTUM BEAR CLERANCE SHIFT.
FIRST ONE IN 2.5 YEARS! LAST TIME WAS JANUARY 2 2023
Lower highs momentum baselines conveying intense build up ascend pressure.
Precise 78.6 FIB LEVEL TAP. This is where most buyers converge before a BULL SEASON.
From this metric changes, something is definitely evolving. This shift doesnt happen often. It took ETH 2.5 years to repeat this signal, and we got one this month. This is special and it is BIG.
SEED NOW while you can. See you up there at 4k era soon and beyond.
Spotted at 2400
Mid/Long term Target 4k++
Trade Safely. Market is Market.
Not financial advice.
TAYOR.

Ethereum (ETH): Good Bounce | $2800 IncomingWe had a rather sharp but clean breakout recently where price has shown us that buyers are dominating currently, pushing the price toward the local high at $2800. This is our current target and so far ETH had been perfoming more than well.
Swallow Academy