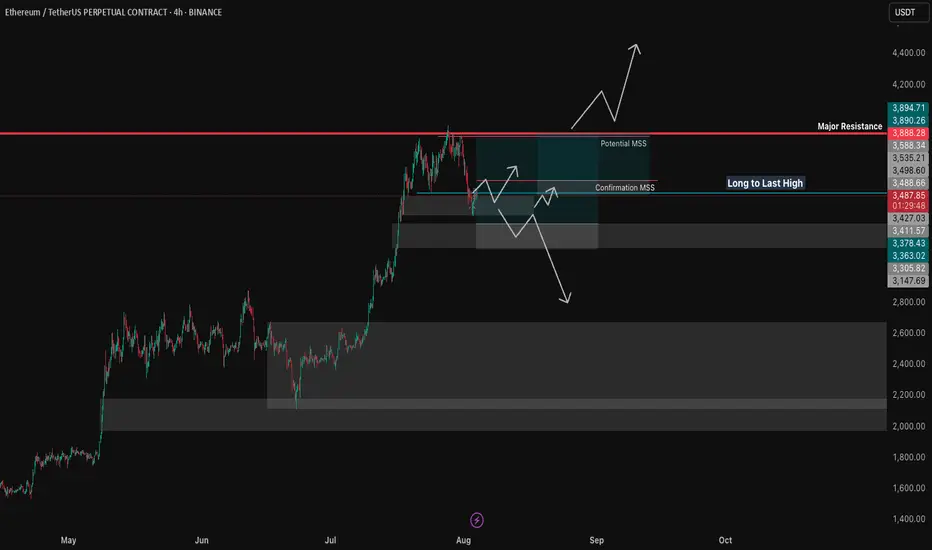
Aug 4, 2025 -- ETHUSDT.PMarket can expand after this retracement. If it doesn't give any indication to move higher we can expect deeper retracement or reversal. If it expands now, it has a strong resistance around 4000 level. If that breaks, way up. If not, we at least get long till the major resistance. Currently, price is in a sensitive zone, if we get Daily/4H indication of running lower, we short. If it displaces upwards on Daily/4H we long. On any side here, we wait for the first expansion move.
ETHUSDT.P trade ideas
Combining a "cup and handle" pattern with a long position on ETHCombining a "cup and handle" pattern with a long position on ETH/USDT is a classic bullish technical analysis strategy. Let's break down what this pattern signifies and how to approach it for a long trade.
Understanding the Cup and Handle Pattern
The cup and handle is a bullish continuation pattern popularized by William J. O'Neil. It suggests a period of consolidation followed by a breakout to the upside, signaling a likely continuation of the prior uptrend.
Disclaimer: Technical analysis patterns like the cup and handle are tools, not guarantees. Always combine them with sound risk management and your overall trading strategy. Past performance is not indicative of future results.

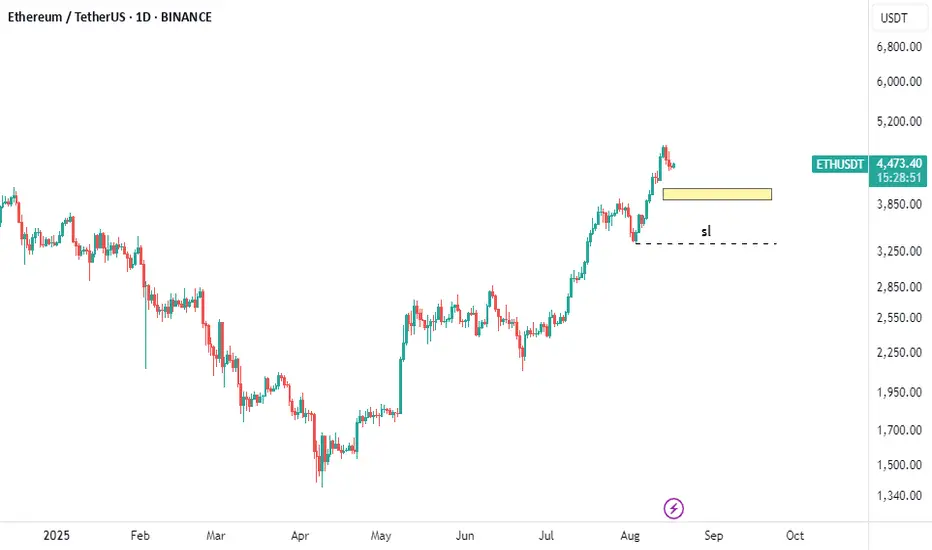
ETHstop loss and a zone for buying (yellow zone)
if you have Eth so use the sl line
if you have not Eth so use the yellow zone for buying and sl line

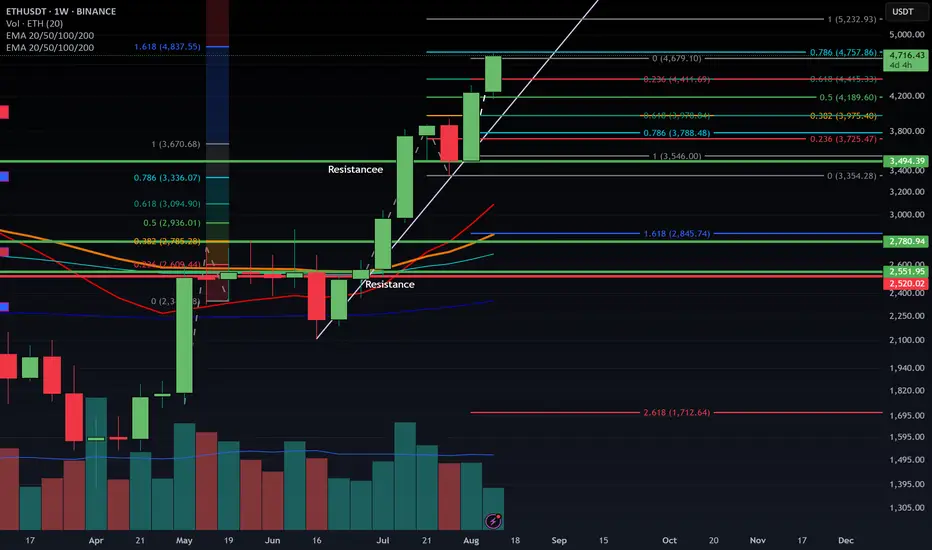
ETH 1W – Testing ATH Resistance at 4.8K–5.3KEthereum has rallied strongly into the 4.8K–5.3K resistance zone — the same level that capped price during the 2021 bull cycle. This region is historically significant and is now the final barrier before potential all-time highs.
If ETH rejects here, traders should watch for support retests around 3.6K and deeper at 1.6K–1.8K. However, a confirmed weekly close above 5.3K would signal a breakout and likely continuation toward price discovery, with upside momentum favoring higher valuations.
This zone is critical — ETH is either setting up for a major breakout or forming another macro double top.

ETHEREUM Potential Bullish BreakoutEthereum price seems to exhibit signs of overall potential Bullish momentum if the price action forms a prominent Higher High with multiple confluences through key Fibonacci and Support levels which presents us with a potential long opportunity.
Trade Plan:
Entry : 2950
Stop Loss : 2200
TP 1 : 3700

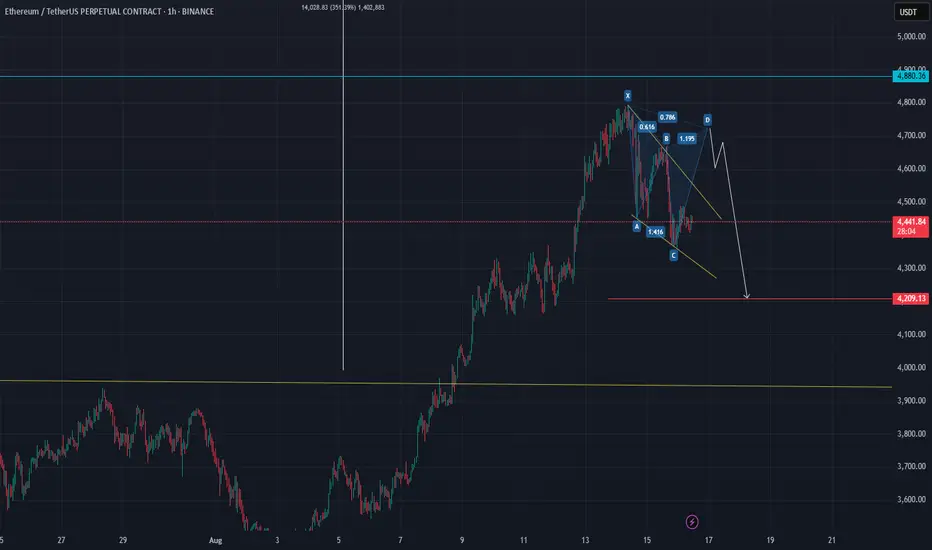
ETH/USDT | 1H Analysis & Key TargetsOverview:
Ethereum is currently showing a corrective pattern after hitting recent highs near $4,880. Price action indicates a potential bearish continuation within a descending channel. The chart highlights a possible ABCD harmonic formation that may lead to further downside movement.
Key Observations:
Current Price: $4,445
Pattern: ABCD correction (potential reversal at D)
Resistance Zones: $4,600 – $4,700
Support Zones / Targets:
Target 1: $4,200
Target 2: $3,900
Target 3: $3,700
Target 4: $3,200
Notes:
Price may attempt a short-term pullback towards the D point before continuing downward.
Watch for confirmation at the descending channel’s upper trendline for potential short entries.
Target levels are based on previous support zones and Fibonacci projections.
Risk management is crucial—set stop-loss above the $4,600–$4,700 resistance area.
Trading Plan:
Consider scaling into short positions on rejection at resistance or after confirming the bearish continuation.
Partial profit-taking at each target zone to manage risk and lock in gains.
Summary:
ETH/USDT is showing early signs of a wave 4 correction in a bearish sequence. Keep an eye on the descending channel and ABCD completion for optimal entry and exit points.
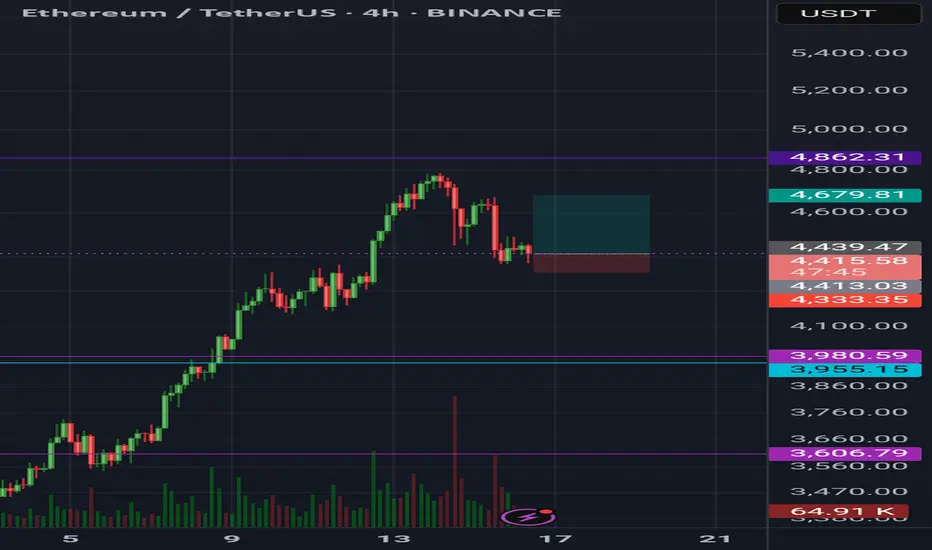
ETH 2H – Trendline & Support ConfluenceETH is pulling back into a confluence of ascending trendline support and prior resistance now acting as support near $4,400. Holding this level could set up a continuation toward recent highs around $4,720. Structure remains bullish while price respects the trendline.

ETH/USDT 4H chart review1. Trend
• Direction: a downward trend, confirmed by a series of lower peaks and lower holes.
• The black line is a downward trendline - a course from a few candles reflects it down.
• The increase in volume in declines suggests that the seller is still dominating.
⸻
2. Key levels
• Resistance:
• 4 634 USDT - the last strong resistance from which the price has reflected.
• 4,527 USDT - local resistance, coincides with Trendline.
• Support:
• 4,415 USDT - the current level of support tested, the price consolidates here.
• 4,300 USDT - another strong level of support; Breaking can accelerate the inheritance.
⸻
3. Current situation
• The price has fallen below 4,527 and is currently supporting 4 415.
• The candle formation on support is mixed - small green candles after a large red impulse suggest a temporary pause or a correction attempt.
• The volume on inheritance candles is higher than on growth → Seller still stronger.
⸻
4. Scenarios
🔴 Negative (more likely if the sales volume persists)
• If 4,415 is pierced with an increased volume, the purpose of the inheritance is 4,300 USDT, and in case of further pressure even 4,200.
• The downward trend is maintained.
🟢 positive (less likely at the moment)
• If the course reflects from 4 415 and breaks Trendline + Level 4 527, then possible movement in the direction of 4 630.
• This requires an increased volume of buyers.

ETH/USDT ANALYSIS ETH has had a very strong bullish momentum and now in a corrective mood and know where there would be a great support and entry for potential LONG opportunities is very crucial. The entry level from the chart is around $4100 😘😍

ETH - Current Levels to WatchSo far everything about ETH's breakout move has played pout perfectly. We had the successful reclaim of the green trendline (from all my previous ETH posts), followed by the break of the key $4k level (multi-year resistance), then the expansion move to $4,800 (our previous ATH).
Now we are seeing a cooloff from the previous ATH so what should we expect next?
The first level we are watching as a potential support level is our yellow line. This level was old resistance before breaking above to make our move to $4,800. Therefore, can this old resistance become new support? This is the first key level we are watching on this downturn ranging from about $4,260-$4,375 with the main interest around $4,315.
The next level would be our MAIN LIQUIDITY ZONE raging from $3,800-$4,100. This was our past multi year resistance that we would love to see a retest of new support. Demand at the moment for ETH seems to be pretty high, therefore buyers should find this level very appealing if we get a dip to there. The main interest level would lie between $3,850-$3,950. If just depends if whales front run this level or not.

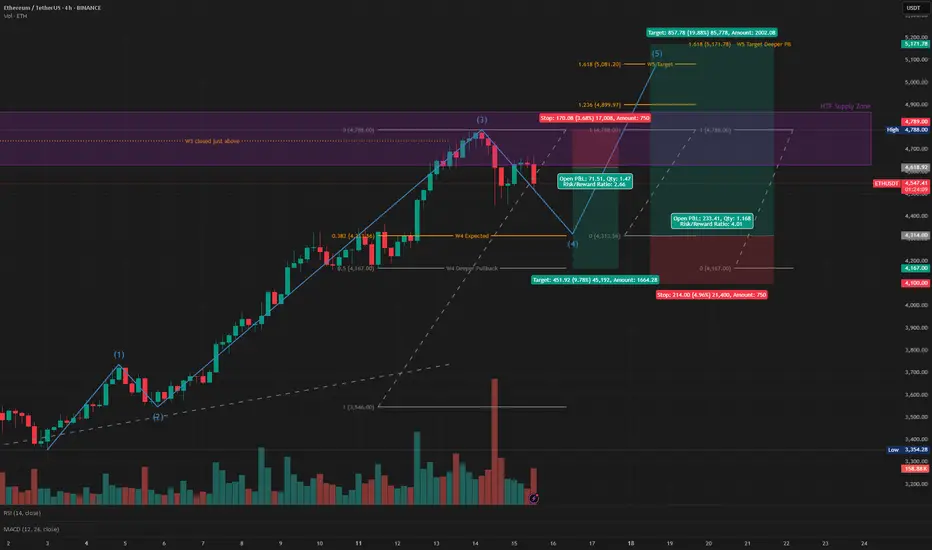
ETH Elliot Wave to Smash the BIG 5k ATHmarked out some precise Elliot Wave levels on ETH:
recently closed W3 at 4788, which gives a W4 targets 4343.56 and 4167
leading to W5 breaking the big 5k mark with targets 5081.20 or 5171.78 (with deeper pullback in W4).
this gives a nice short opportunity entering just below the HTF supply zone at 4618.92 (divergence suggests another small bounce)
followed by an epic long to new ATH entering at 4313.56 (and 4167 on a deeper W4) with TPs at 4899 and 5081


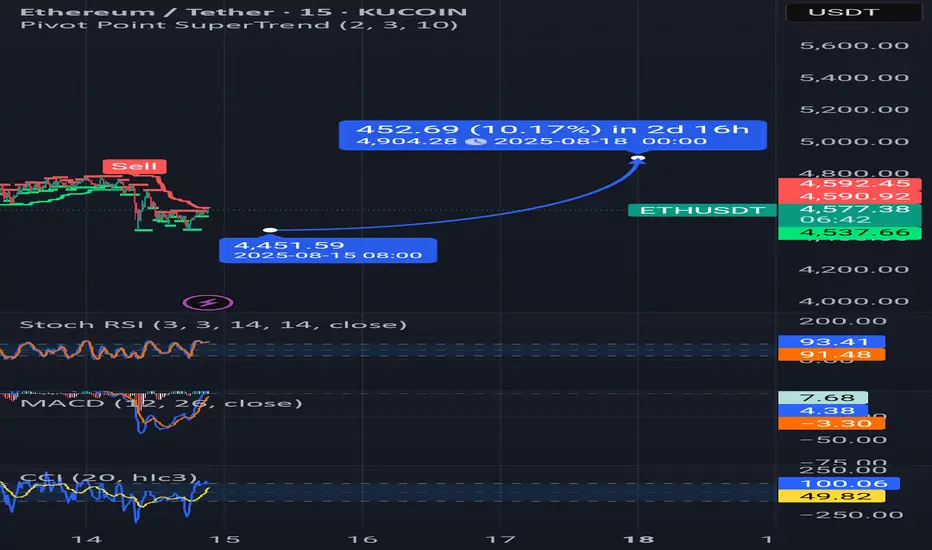
Ethereum (ETH): $4800 Incoming | Time To Shine!Ethereum is cooking, where the price recently broke our local resistance zone like nothing and now is heading towards the ATH zone.
Now it is not a secret that we are looking for proper upside movement from here, even after the breakout so that's the game plan—currently aiming for the $4800 zone and after that we will be looking for a BREAKOUT!
Swallow Academy

A Cup and Handle chart pattern incoming ETHERUM Has regained the momentum, a potential cup and handle chart pattern is forming. So far 4H RSI and CCI is oversold, So buyers are stepping in. I am Standing with my target of Ath around 4900.
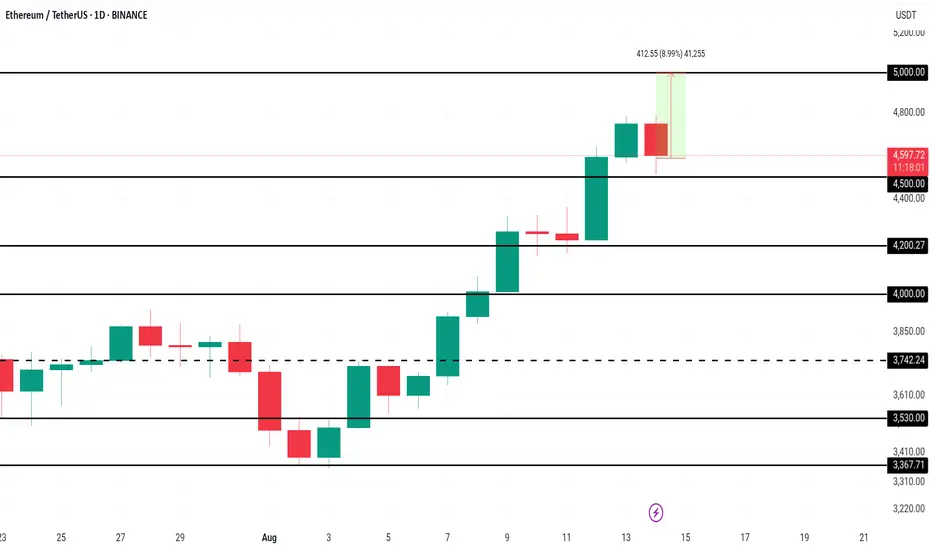
Ethereum Price Nears $5,000 After 3.5 Years; Will It Succeed?Ethereum is currently trading at $4,723, just 5.8% away from the $5,000 milestone. The asset has secured $4,500 as a solid support level, further strengthening its bullish outlook. This three-and-a-half-year high is energizing buyers, who see $5,000 as the next key target.
With robust whale accumulation, record futures interest, and positive funding rates, Ethereum’s path toward $5,000 appears intact. Once this level is breached, momentum could carry the price even higher, potentially targeting $5,500 in the following weeks.
However, the bullish scenario hinges on investor sentiment holding firm. If traders pivot to profit-taking, ETH could drop below the $4,500 support. A sustained move under this level might push prices toward $4,200, undermining the current uptrend and delaying further gains.
break the ressitanceif eth break 4800 resistance its possible to jump to 6800 or 700 in 2 days what do you think its is possible or not?? i wana buy eth please help me
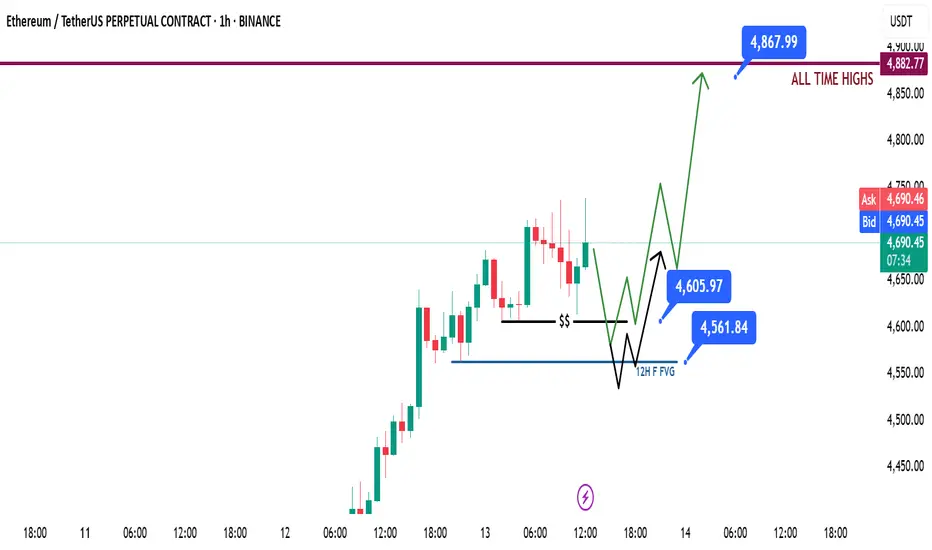
ETH | Long Idea - All time highs soonETH | Long Idea
📊 Market Sentiment
Overall sentiment remains bullish, supported by expectations of a 0.25% rate cut in the upcoming FOMC meeting. A weakening USD and increasing global risk appetite are creating favorable conditions for further upside in crypto assets.
Ethereum is approaching all-time highs, fueled by a $1B single-day ETF inflow. Additionally, rumors of potential SEC approval for Ethereum staking policy could directly boost ETH’s utility — strengthening the long bias.
📈 Technical Analysis
Price is climbing steadily after sweeping LTF liquidity.
Retracements have been shallow due to strong momentum and market hype.
All-time highs are now clearly an institutional / smart money target.
📌 Game Plan
Watch for a sweep of 1H swing lows / equal lows at $4,605 followed by a bullish rejection.
Alternatively, 12H FVG at $4,561 could be taken before rejection — both liquidity runs are valid watchpoints.
🎯 Setup Trigger
Look for a 1H break of structure after liquidity grabs at the mentioned levels.
📋 Trade Management
Stoploss: 1H swing low that confirms the break of structure.
Target: Direct move towards all-time highs at $4,868.
💬 Like, follow, and comment if you find this setup valuable!
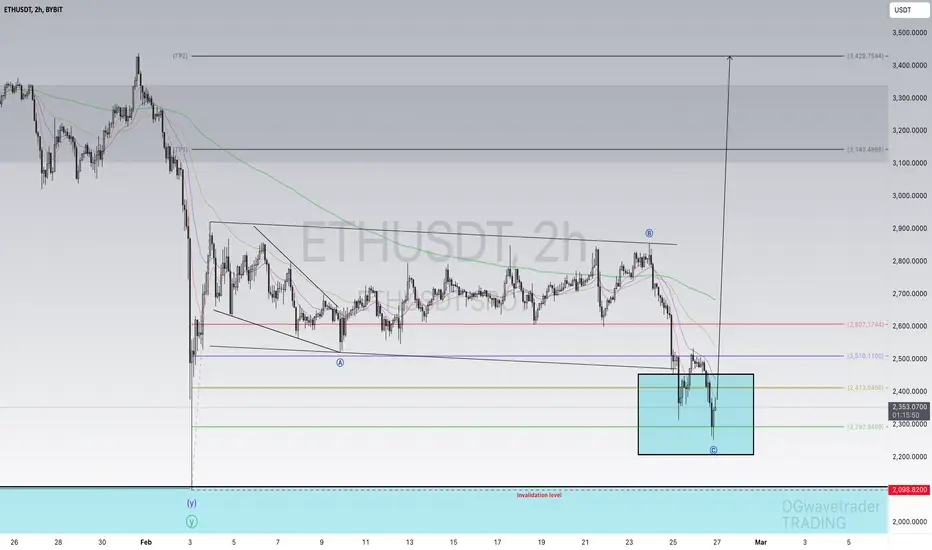
ETHUSDT, Is it time for the biggest Altcoin?Hi fellow traders, ETHUSDT will be ready to make a move higher from the blue box after it completes the flag correction in ABC formation. Target will be 3429.75. Good luck and trade safe!
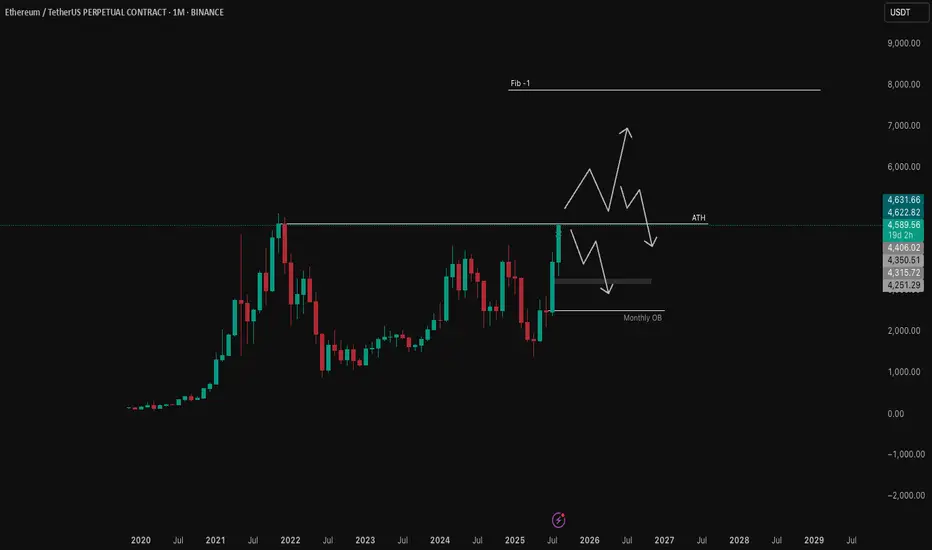
ETHUSDT.P -- Monthly Analysis -- Aug 13 2025ETH is nearing it's ATH. This could mean either of scenarios:
- We break ATH, move from expansion to consolidation, we trade LTF without a higher level bias,
- We break ATH, retrace and expand higher, we look for FVGs/OBs,
- We break ATH, reverse,
- We break ATH and reach higher,
- We don't break ATH.
Now any of these scenarios could play out.
Zooming out, it seems that after the last ATH in November 2021, market reversed, expanded a bit higher to consolidate -- Accumulation. From December 2024, it made a move lower that took out sell stops, gathered liquidity to move higher -- Manipulation. Now, it is expanding after this consolidation move. This expansion lasts where sellers are willing to step in to take large order buy orders.
This is crypto market and there is a lot of hype about it. We are hearing alt season everywhere. Now, whatever that is, there is coming a time, where there would be enough euphoria to convince many people to try their luck at crypto. To flip a $1000 → $5000. A lot of these retailers will become exit liquidity. Smart ones will take timely exits. Some will get stuck. But the smart ones -- "Smart Money" -- are the whales that have bought the coins, and are waiting for their exit time a.k.a Alt season.
Now, just the point of all this seemingly unstructured talk is to say that we don't really know for sure what is going to happen. There is no possible way to know. But we see what the price is trying to do. Currently, it is expanding and can go to one of the possible scenarios listed above. We see what is currently happening on the Monthly timeframe. If it is bullish, we can expect a bullish month. We are in a bullish month, and we trade longs on LTF as the monthly chart develops.
new long order on etheth backtest-ed, eth/btc looking good to move, btc reached new all time high.
Good to go ? ./.
