ETHUSDT.P trade ideas
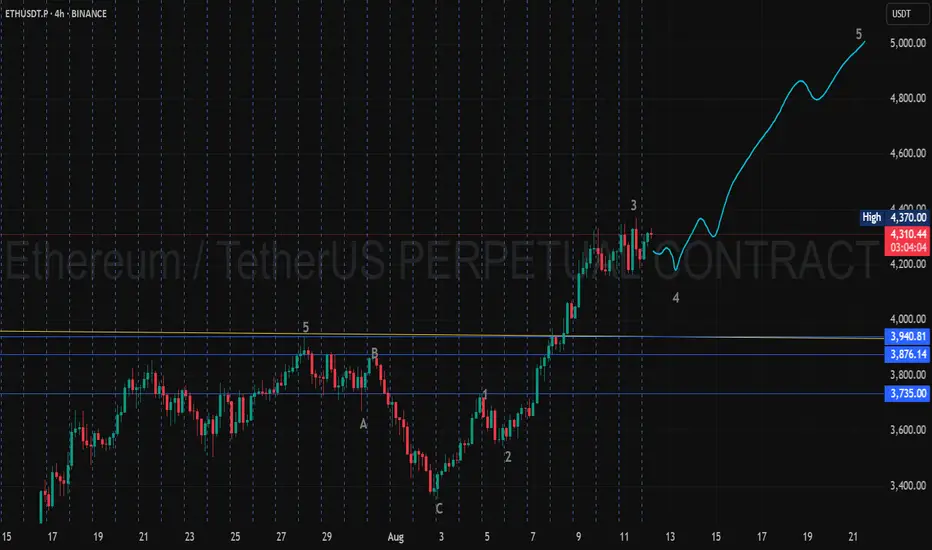
ETH next move!Ethereum appears to be completing its 3rd Elliott Wave, with a 4th wave retracement anticipated before initiating the 5th wave, which could drive prices beyond the previous all-time high near $5,000.
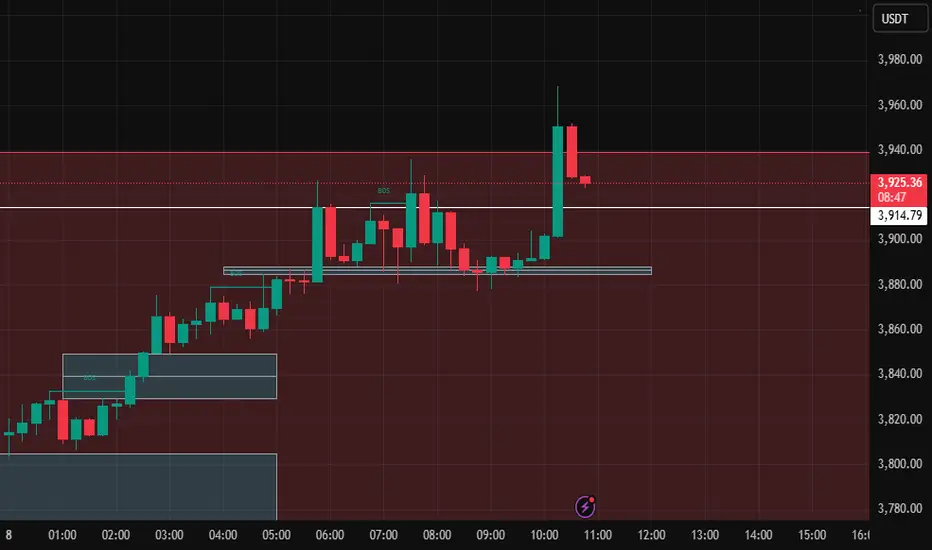
ETH LONG OR RANGE?Since we have left the earlier self claimed range on 5H and consolidate above the significant highs and previous swing high, I wonder which scenario we see, if the blue rectangle gets touched by the candles wick and we do not inverse it, its a good bullish scenario, however, if we inverse the marked fvg and get to the inefficiencies below we can expect more of a choppy price action or favored earlier range idea
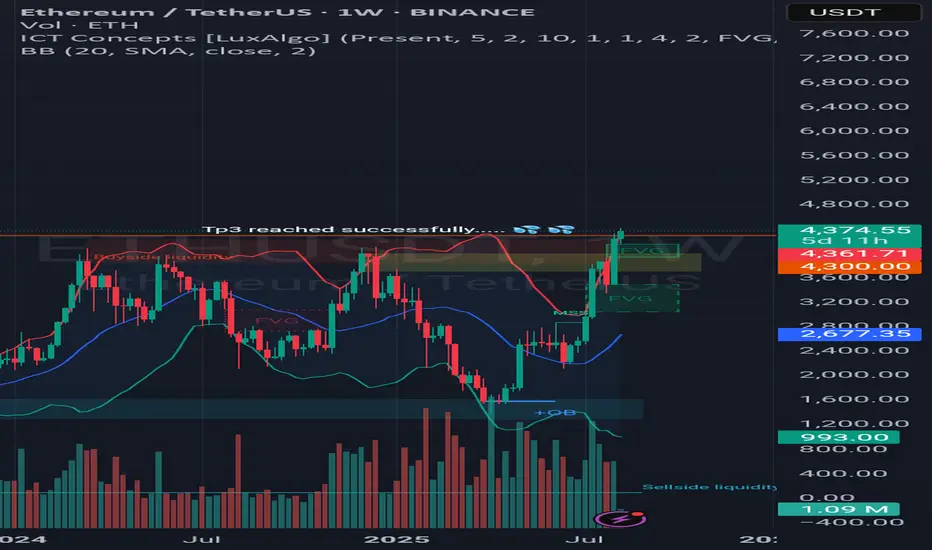
Weekly trading plan for EthereumLast week, BINANCE:ETHUSDT reached all the planned targets, moving according to the bullish scenario
Locally, we can see a support zone — as long as the price stays above it, there’s a strong chance to see a new ATH this week
If the local support breaks, there’s a higher probability of breaking the weekly pivot point and reaching 3,933 , after which we could see a new ATH
If the price fails to climb back above the weekly reversal level, a drop toward the 3,700–3,500 area becomes possible
More details are in the idea video.

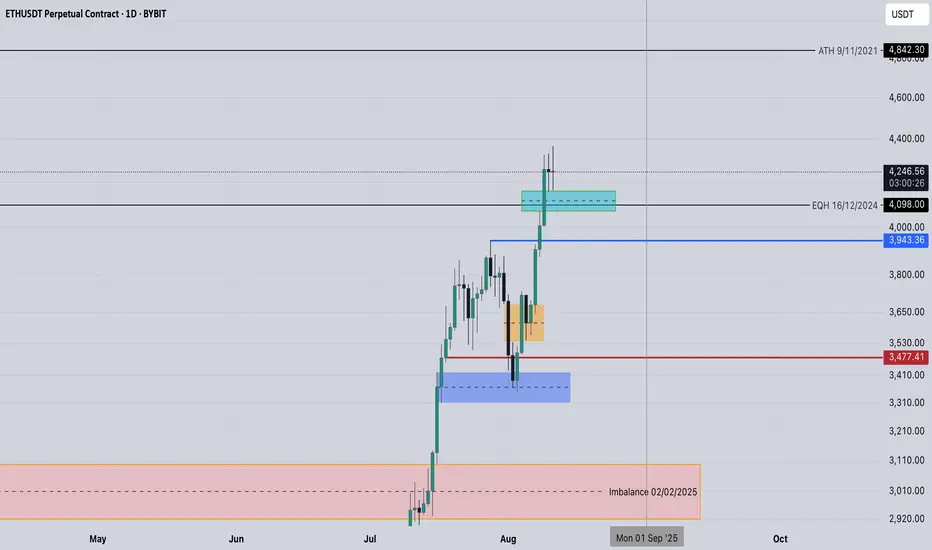
ETH 1D Breakout to New Highs, Can Bulls Sustain Momentum?Ethereum has rallied sharply after flipping the $2.8K resistance into support, pushing to fresh yearly highs above $4.3K. The breakout was fueled by strong momentum after holding a major base around $1.4K earlier in the year. Stoch RSI is trending upward, showing continued buying strength, but overextended conditions could lead to a pullback toward the breakout zone. Sustaining above $4K would keep the bullish structure intact, while a failure to hold could trigger a retest of lower supports

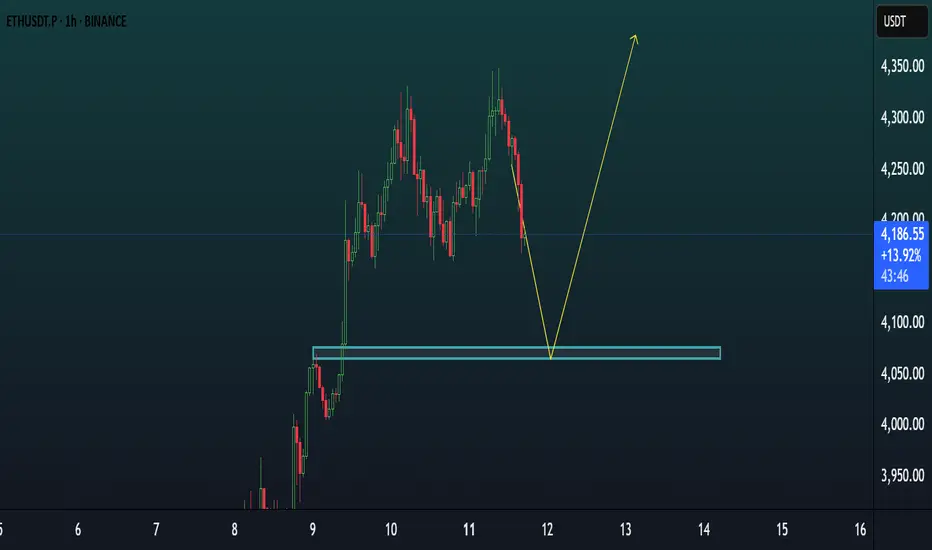
ETH NEXT BULLISH MOVE.🟢 ETHUSDT | 1H Bullish Setup
✅ Price broke structure and is in bullish order flow.
✅ Clear POI (Point of Interest) zone at 4,060 – 4,080.
🔍 Price is retracing from highs, yet to tap into POI.
📌 Trade Idea: Wait for price to retrace into POI zone and look for bullish confirmation before entry.
🎯 Potential bounce toward 4,350+ after liquidity sweep and POI mitigation.
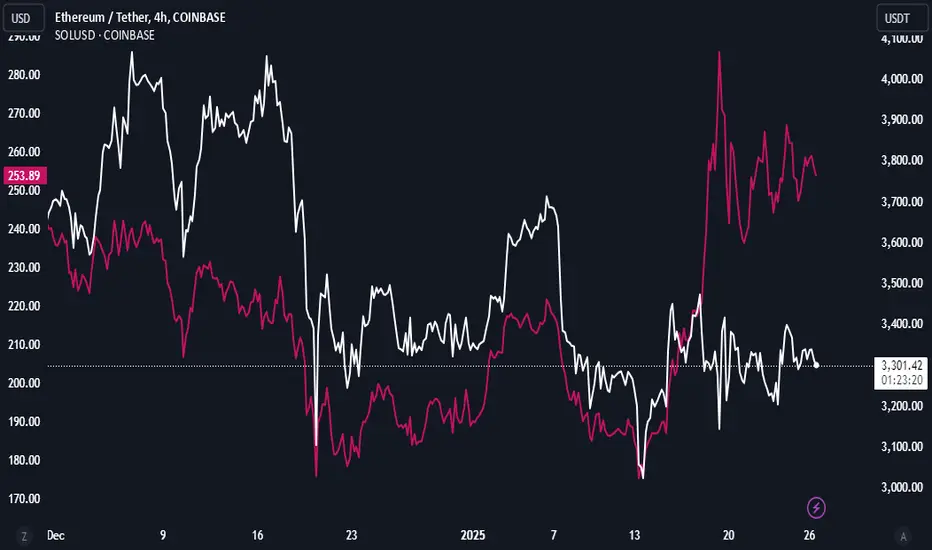
ETHUSDT - SOLANAThe digital currencies Ethereum and Solana have not grown much due to the increase in the prices of other major currencies. Since both currencies include strong networks and are considered the leading cryptocurrency, long-term price increases can be expected for these two currencies and they are considered good investment options.
Sasha Charkhchian
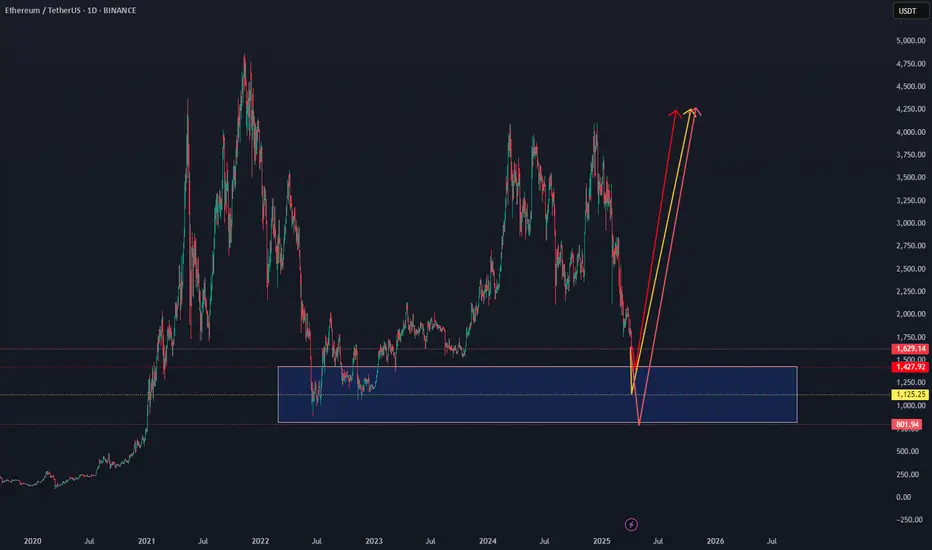
ETHUSDTEthereum will definitely return from this price range to the target of $4000, the price range is the price retracement ($1428-$1125-$802).
ETHUSDT 12H chart uptrend1. Breaking out of the downward channel
• Black lines show an earlier inheritance channel.
• The course struck the mountain and it is quite dynamically, which is a strong upward signal.
2. Current price
• ETH is around USD 4,274, just below the resistance at USD 4,304.
• Another resistance is 4,484 USD (potential target if the upward trend persists).
3. Support
• The next support: 4,048 USD - if the course is corrected, then there may be the first "test".
• stronger support below: USD 3,930, $ 3,709, $ 3,487.
4. Indicators
• MacD: MacD line strongly above the signal, the histogram is growing - confirms the upward trend.
• RSI: around 75 - close to the purchase zone, which can mean a short -term correction, but with a strong RSI trend can stay high for a long time.
5. Scenarios
• Bull: Punction and maintenance above USD 4,304 can open the road to 4,484 USD and possibly higher.
• Bear: rejection from USD 4,304 and a descent below 4,048 USD may cause a deeper correction in the direction of $ 3,930 or even $ 3,709.
📌 The short -term market is warmed up, so a small pullback is possible, but the structure looks very bullshit after this burst from the downward channel.

ETH to 17.000USD if it hits the 4.236 fib! Shocking! If I draw the fibbs to measure how high it can go I can't believe my eyes!!!
Firstly, we all thought it was over with ETH in the beginning of the year.
Secondly, we broke out today!!!
Off to 17k!!! Yay!

ETHUSDT- Signal: LONG
- Entry: ETHUSDT 4,012.8 ~ 4,014.2
- Take Profit: 4,019.6 / Stop Loss: 4,010.1

ETH/USDT 12h chart1. Punction of the downward trend
• The black inheritance trend line has been broken up - this is a strong signal of Bycza.
• Breaking was confirmed by a strong candle movement and high growth dynamics.
⸻
2. Key levels of support and resistance
• Support:
• 3930 USDT - previous resistance, now the defensive zone with possible correction.
• 3709 USDT - deeper support.
• 3488 USDT - critical support, below which the upward trend would be negated.
• resistance:
• 4048 USDT - current local resistance (the candle touched and lightly reflected).
• 4304 USDT - another strong resistance.
• 4484 USDT - long -term resistance and potential goal when continuing to grow.
⸻
3. RSI
• RSI is around 70 - close to the purchase zone.
• suggests the possibility of a short correction or consolidation before the upward trend continues.
⸻
4. Scenarios
Bycza (continuation of growth)
• Maintenance above 3930 USDT.
• Breaking over 4048 USDT opens the road to around 4300–4480 USDT.
Bear (correction)
• Rejection to USDTT 4048 and a decrease below 3930 USDT may bring a rate to around 3709 USDT.

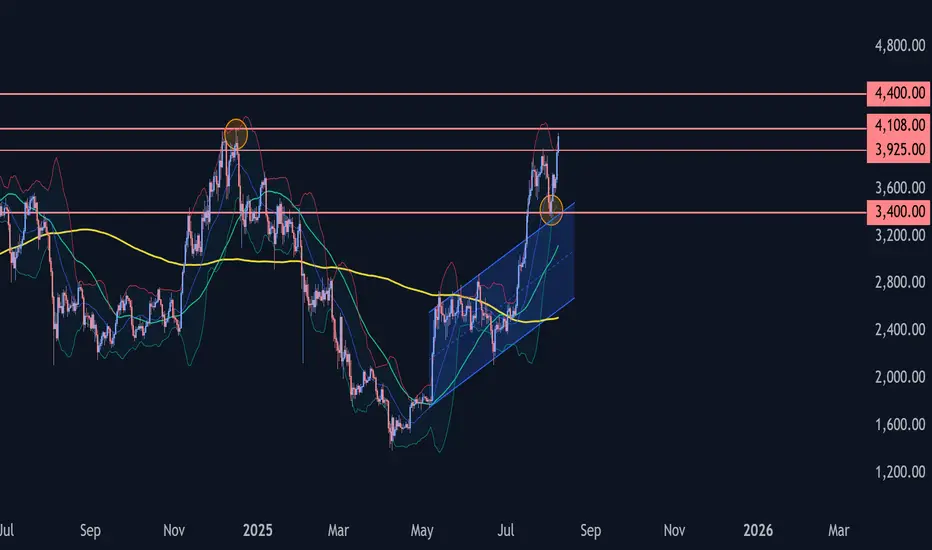
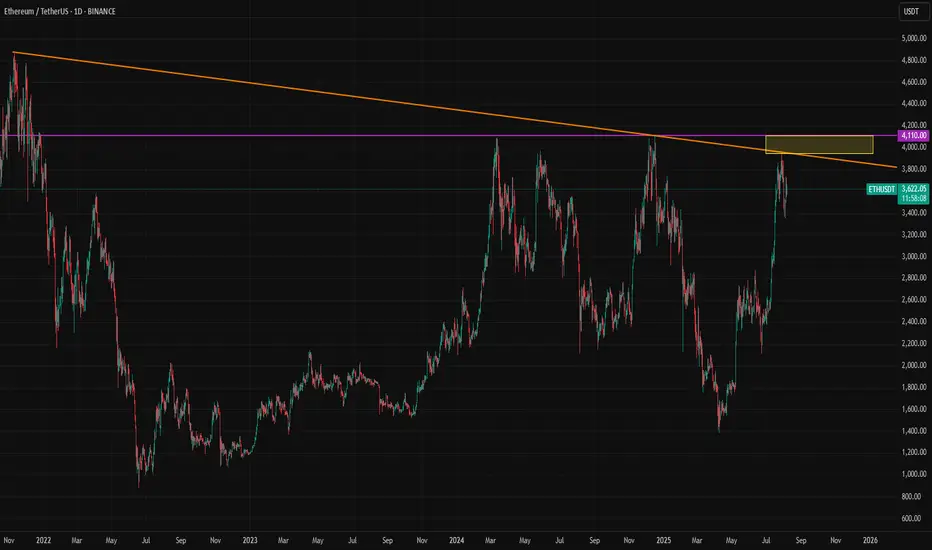
Ethereum Wave Analysis – 8 August 2025- Ethereum broke the resistance level 3925.00
- Likely to rise to resistance level 4108.00
Ethereum cryptocurrency recently broke the resistance level 3925.00 (which stopped the previous impulse wave 1 at the end of July).
The breakout of the resistance level 3925.00 continues the active impulse wave 3, which started earlier from the support zone lying at the intersection of the support level 3400.00 and the upper trendline of the daily up channel from April.
Given the clear daily uptrend, Ethereum cryptocurrency can be expected to rise to the next resistance level 4108.00 (multi-month high from December) – the breakout of which can lead to further gains toward 4400.00.
As ExpectedAs expected in the previous analysis and earlier ones, the price has been climbing toward the 4000 level.
However, it hasn't touched 4000 yet.
For now, it’s interacting with the **3,942.13** level, which could be an important support.
If the price fails to hold this level, we might see some short-term bearish movement.

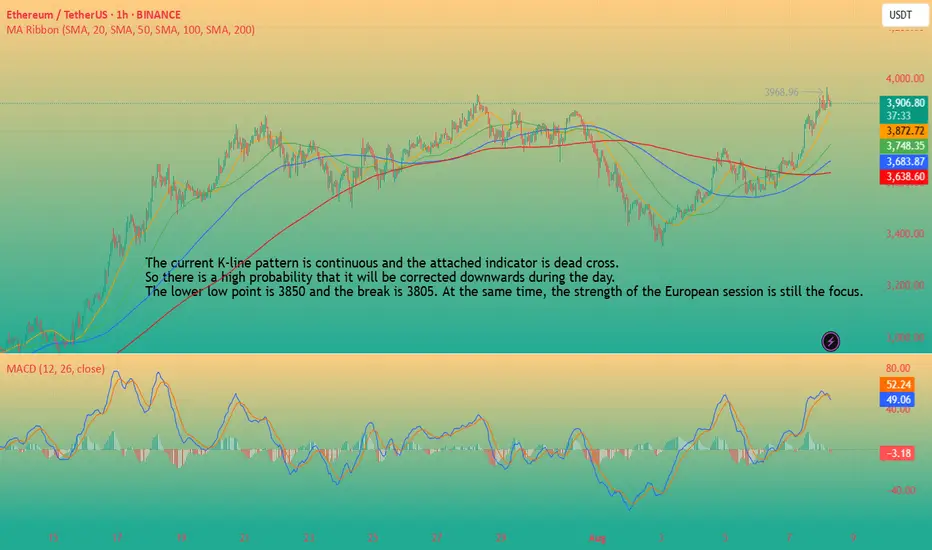
ETH-----Sell around 3905, target 3850 areaAugust 8th ETH Contract Technical Analysis:
Today, the long-term daily chart closed with a small bullish candlestick pattern, with consecutive bullish candlestick patterns and a single bearish candlestick pattern. The price is above the moving average, and the accompanying indicator shows a death cross with shrinking volume. The overall upward trend is very clear, but the current price is deviating from the moving average, so traders should be aware of the risk of a large pullback. There are also news and data stimuli. The short-term hourly chart shows a pattern of oscillating upward movement, with prices continuing to break higher. The more such a trend is, the more we need to pay attention to the support level of the pullback. This is crucial. Many friends want to sell, and that's fine, but you must not be greedy. Only short-term trading is necessary. If you can't do it, don't do it. Currently, the price is under pressure, with consecutive bearish candlestick patterns and the accompanying indicator showing a downward death cross. A pullback is also important for the day.
Today's ETH Short-Term Contract Trading Strategy:
Sell at the current price of 3905, with a stop loss at 3935 and a target of 3850.
Cracks in my systemCracks in my system
- Re entries and on weak swings.
- If stopped out, the book stipulates, Don't take a re-entry. What did this kunt do with ETH last night? He re-entered a short.
- Be content with a weekly 2%ROI objective The Leader says. What did I do? again, had more than the weekly objectives met and somehow found away to messing up.
A note to myself.
This is (July and August) the consistent I have ever been since buying my first Crypto back in December 2024, about 6 months of learning to trade. I am getting better.
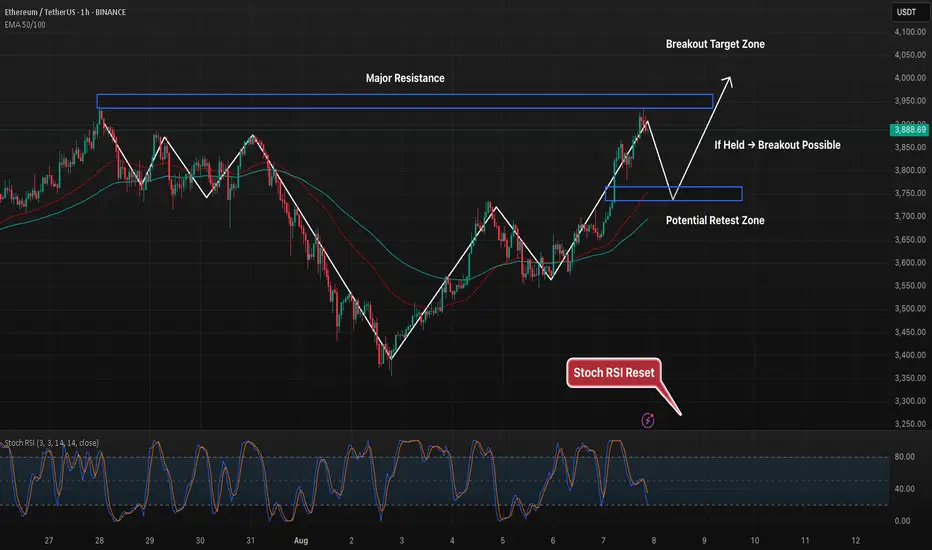
ETH 1H – Retest in Play, But Can Bulls Push Past 3.95K?Ethereum has tapped into the 3.95K resistance zone after a strong upward run, with Stoch RSI now cooling off from overbought levels. Price action suggests a potential pullback toward the 3.77K–3.78K support zone, which aligns with prior breakout structure and moving average support.
If buyers defend this retest, momentum could carry price through the 3.95K barrier and open the door for continuation toward 4K+. Failure to hold the lower zone, however, may trigger a deeper correction into the mid-3.6K range.
Key watchpoints:
– Retest of prior breakout level at 3.77K
– Stoch RSI oversold potential bounce setup
– Clear resistance overhead at 3.95K to break for further upside
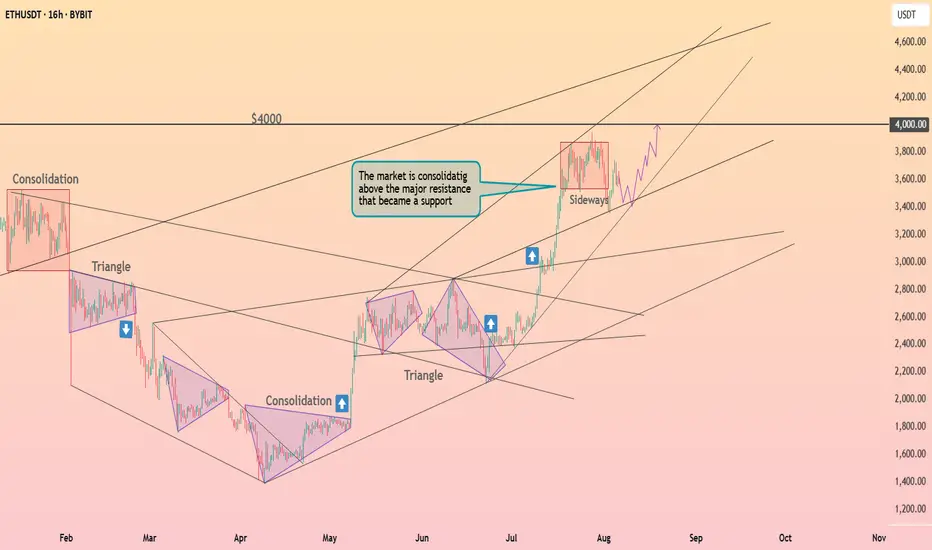
Ethereum is consolidating ┆ HolderStatBYBIT:ETHUSDT is trading within a consolidation zone just under $4000 after rallying from sub-$3000 levels. The trend remains strong with prior triangle and consolidation patterns fueling upward moves. A continuation breakout may test the $4000 barrier soon.
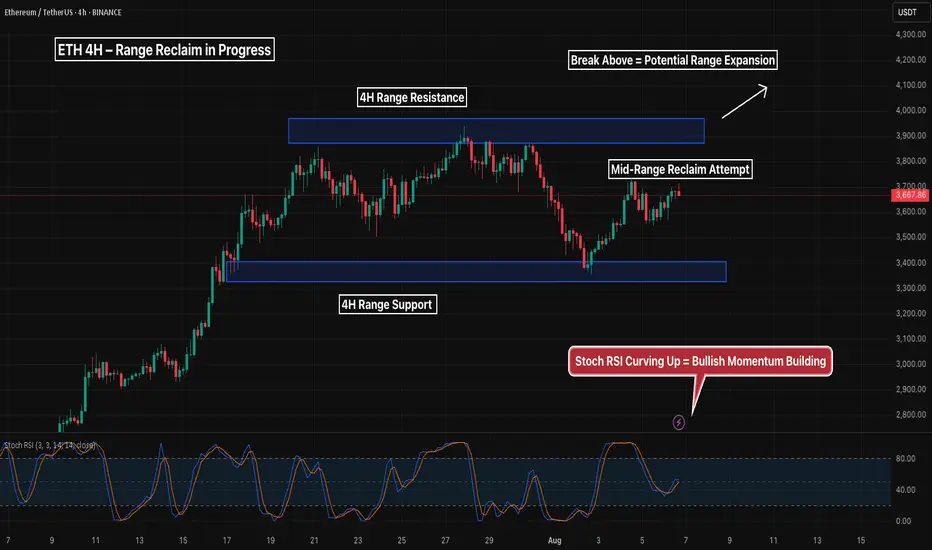
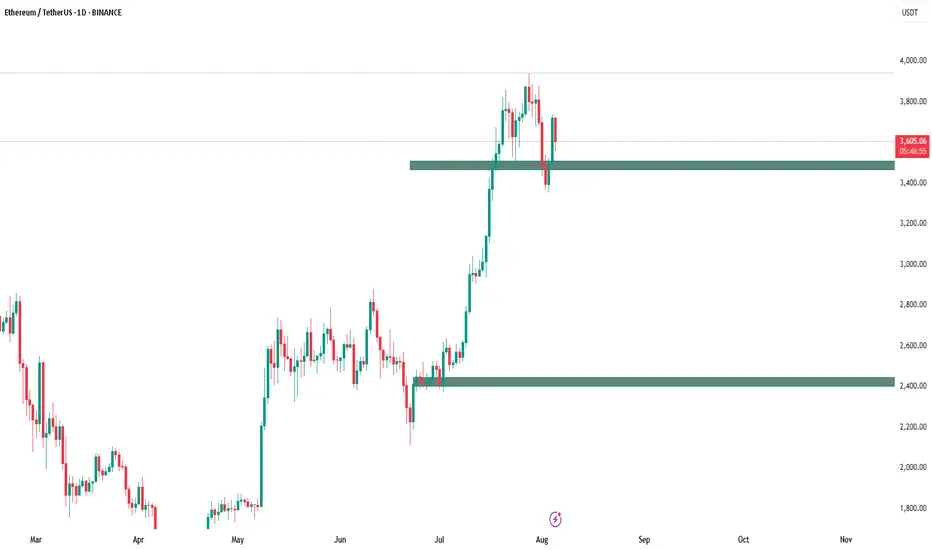
ETH 4H – Range Reclaim in Progress, But Can Bulls Break the Top?Ethereum continues to respect the clean horizontal 4H range between ~3350 (support) and ~3950 (resistance), with price now attempting a reclaim of the mid-range following a strong bounce from demand.
Stoch RSI is curling upward, suggesting building bullish momentum — but the real test lies in the upper supply zone, where price has failed several times before.
If price can flip mid-range into support and reclaim the highs with volume, this opens the door for potential range expansion and trend continuation.
Key points:
– Strong bounce from range support
– Mid-range reclaim attempt underway
– Watch for reaction at 3950 resistance
– Stoch RSI rising from bottom = bullish confluence
Until the top breaks cleanly, this remains a range-bound environment — so be prepared for both scenarios. Next moves will define the weekly trend.
Ethereum Profit-Taking in Progress, Longterm Bullish Case StandsEther was unable to break above the trendline following its strong rally. In the medium term, our base case remains bullish, with expectations of over 100% return within a year. However, in the short term, some downward pressure and profit-taking are currently in play.
Two days ago, the Ethereum ETF experienced its largest single-day net outflow. If this turns into a trend, a broader selloff may begin. Should ETH approach the 3000 level, it could present a strong opportunity to re-enter from the bullish side.
There is also a chance of a trendline breakout occurring before a significant downward reaction. If that happens, it would suggest that demand for ETH is stronger than previously realized, and our base case may actually be too conservative.
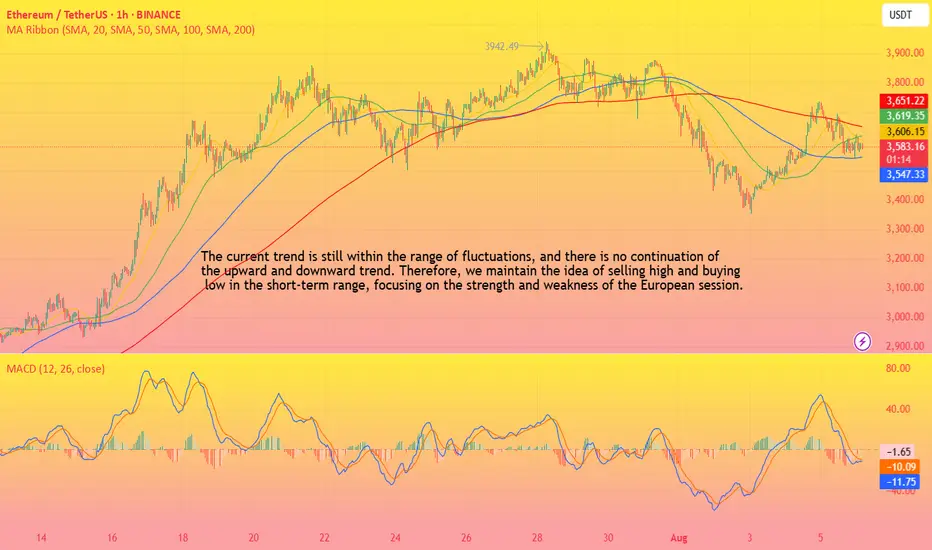
ETH(20250806) market analysis and operationAugust 6th ETH Contract Technical Analysis:
Today, the daily chart showed a small bullish candlestick pattern yesterday, with prices rising continuously. However, the accompanying indicator formed a death cross. Monday's gains were not followed by a significant pullback on Tuesday. Therefore, it is difficult for both upside and downside to continue, and the trend remains range-bound. Until a breakout occurs, maintain a short-term strategy of selling high and buying low. On the hourly chart, yesterday's US session continued the downward trend of the European session, correcting the current bearish candlestick pattern. The accompanying indicator formed a death cross with shrinking volume, suggesting a high probability of a pullback during the day. Focus on the upward pressure around the 3700 high.
Today's ETH Short-Term Contract Trading Strategy:
Buy on pullbacks to the 3590 area, with a stop loss at the 3560 area, and a target of the 3650 area. Sell on pullbacks to the 3670 area, with a stop loss at the 3701 area, and a target of the 3605 area.
ETHERIUMTHE RESULT
Follow for more Simple And accurate swing analysis on Indices, Currency, Commodities.
Ethereum is approaching the key level ┆ HolderStatKUCOIN:ETHUSDT is consolidating between $3,368 and $3,866 following a strong impulse move. Sideways range formation and trendline support hint at bullish continuation. Breakout above $3,866 may resume the upward trend toward new highs.
