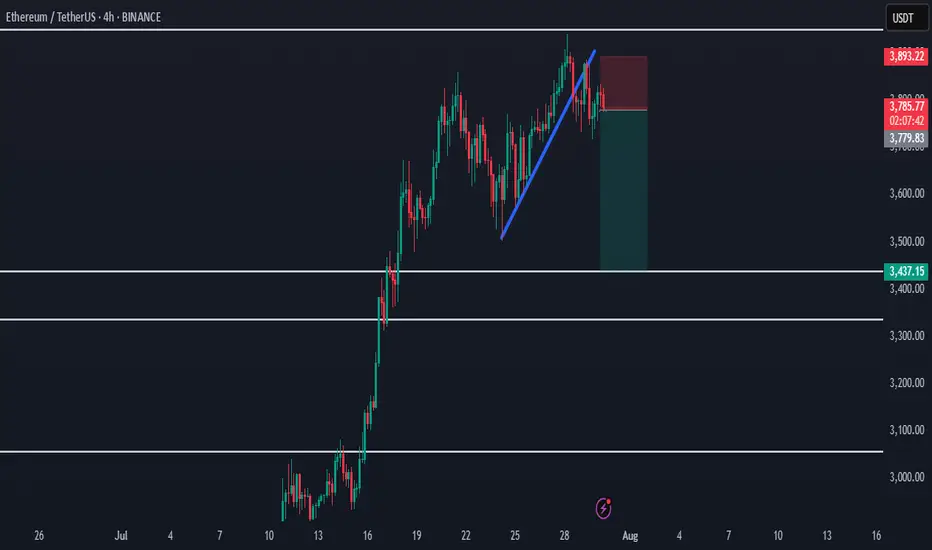
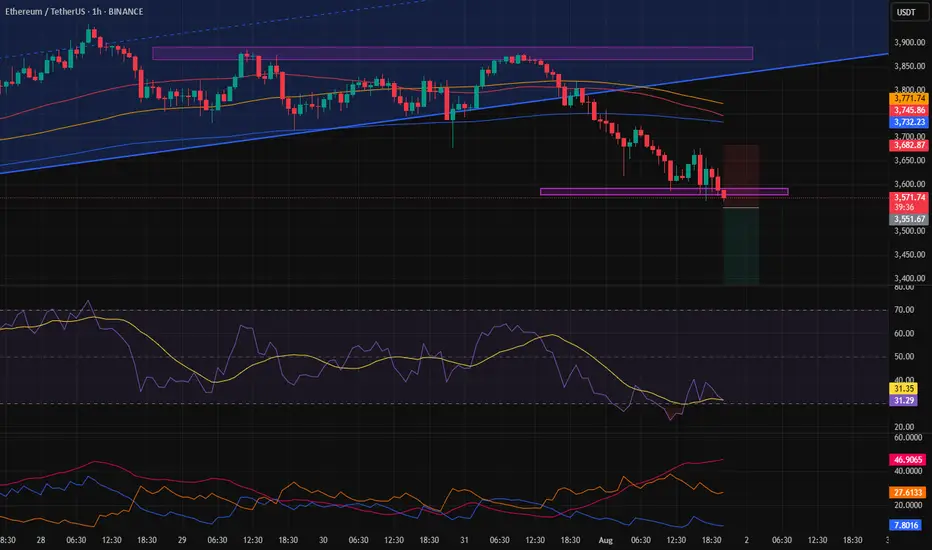
Ethereum Rejected from Supply - Bearish Shift in ProgressHello everybody!
Price has been rejected from a supply area.
The bullish trend has slowed down, and the market structure is slightly shifting bearish.
A polished upward trendline has been broken on the 1H timeframe.
We’re aiming for a target around the first untouched demand zone: 3437.
Manage your risk and trade safe!
ETHUSDT.P trade ideas
Update on the previous analysis.Our analysis hasn’t changed much since yesterday — we still believe the price will reach the $3,330 zone unless buying volume increases significantly and this area turns out to be a fakeout.
#ETH Update #6 – Aug 02, 2025#ETH Update #6 – Aug 02, 2025
Although Ethereum may seem like it has dropped significantly, it still hasn’t completed the correction of its last impulsive move. If we are to say a proper correction is happening, Ethereum must pull back to the $3,300 zone. If it continues upward without reaching this level, the risk of a deeper retracement increases. That’s why it would be much healthier for Ethereum to extend this pullback and complete the correction around $3,300.
If this correction is completed, the next target will be around $4,450. There is also an imbalance zone around $3,300, and since the price is already close, it might aim to fill that as well — possibly even reaching down to the $3,200 level. Contrary to much of the current market sentiment, Ethereum is heading toward a correction in a very healthy manner, and I believe completing this move would be the best scenario.
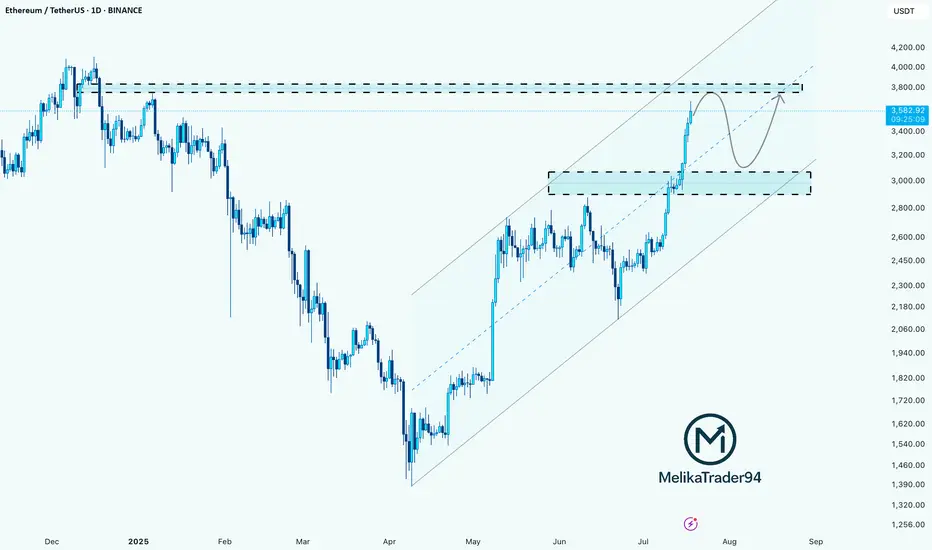
ETH Approaching Major Resistance – Expecting Pullback Hello guys!
Ethereum has been rallying strongly within a well-respected ascending channel, pushing past key levels and now approaching a major resistance zone around $3,900–$4,000.
According to the chart structure, it looks like price could soon react from this resistance, leading to a pullback into the $3,000–$3,200 demand zone, which aligns with the midline of the channel.
This would be a healthy correction before potentially continuing the bullish trend and attempting a clean breakout toward new highs.
ETH is still bullish, but it may need to retest support before continuation.
Watch for a bounce from the $3,000–$3,200 zone for a high-probability long opportunity.
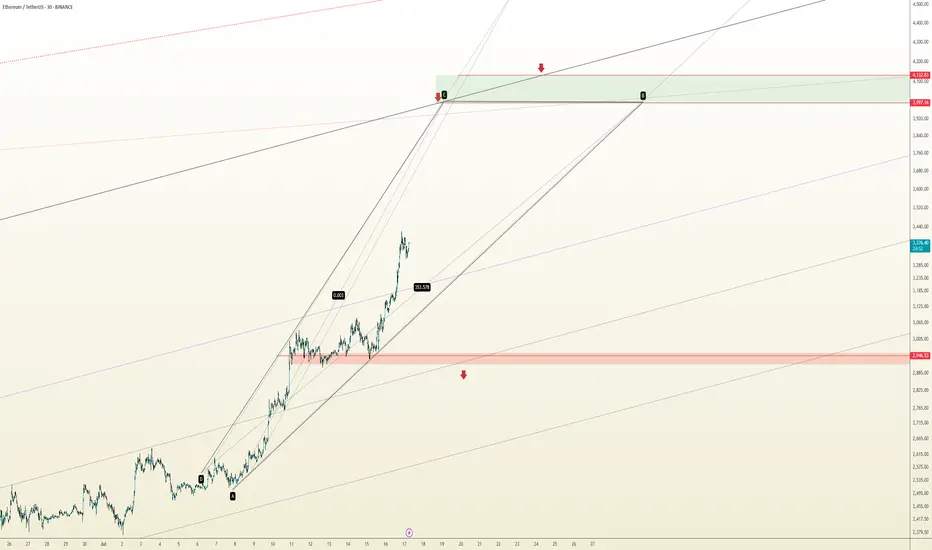
The Loudmouth Pattern: It Yells, We Trade!
On the 30-minute chart, ETH is forming a classic Broadening Formation – or as some traders like to call it, “The Big Mouth Pattern” 😄. It’s noisy, unpredictable at first glance, but when it speaks, you’d better listen.
Right now, price is moving through the bullish leg of this setup, and if momentum holds, we’re eyeing the $4,000 psychological level, followed by the $4,120 – $4,170 supply zone.
🔹 Bullish Scenario (our expected outlook):
🎯 Target 1: $4,000
🟩 Main Resistance: $4,120 – $4,170
❌ Invalidation: Confirmed close below $2,946
If price breaks and holds below that red support zone, this setup gets thrown out the window.
📊 Risk Management:
Scale in on pullbacks – if structure remains valid
No chasing without confirmation
Keep risk under 1% of total capital
📈 The market’s big mouth is open – and until it closes below $2,946, we’re listening for bullish signals. 🤑
ETHUSDTPossible short on ETH, as we know this might be a news dump that caused this blood in the market and might recover very soon, but we broke a key support level, this is the 4HR chart and we will have a better idea what's on the table when weekly close.

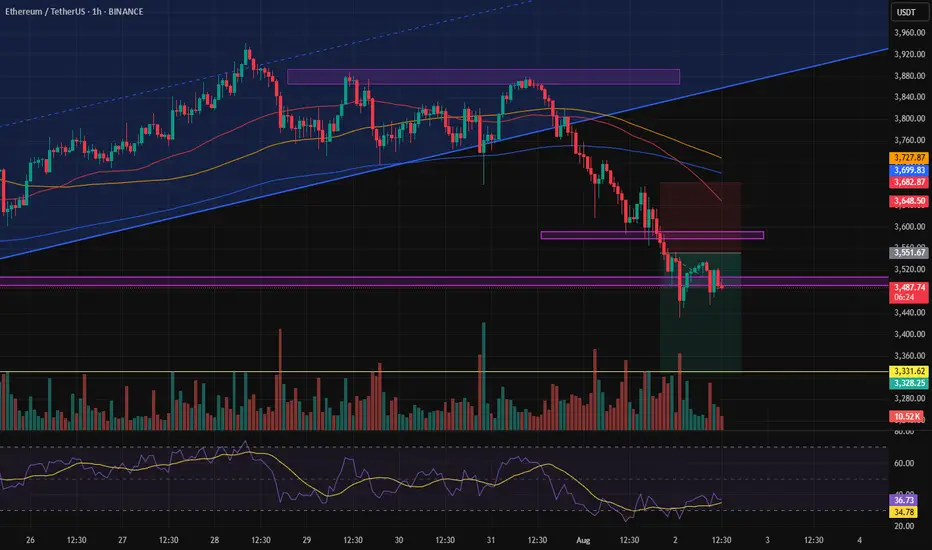
Ethereum: Smart Money Reversal After Stop Hunt?In the previous update, we warned that Ethereum might drop lower before any meaningful bounce — especially if it failed to hold the midline of the ascending channel. That scenario played out exactly as anticipated.
🟡 Price action summary:
ETH broke below the midline of the weak ascending channel, hunted the liquidity below recent lows, and tapped into the key bullish order block near $3,490 – $3,520. Price is now reacting to this zone with early signs of a reversal.
📌 Key observation:
Midlines of weak or low-momentum channels often act as liquidity traps in smart money models. Buying at these levels can be extremely risky — especially during corrective or distribution phases.
⸻
📚 Educational Note:
Never enter long positions solely at the midline of a weak ascending channel, especially when there’s a high probability of liquidity sweep below. Smart entries usually occur at order blocks formed after stop hunts.
⸻
🎯 Next steps:
Wait for confirmation (such as internal BOS or FVG closure) before entering longs. The structure suggests a potential move back toward the upper boundary of the channel if this OB holds.
⸻
🔗 Save this analysis and share it with fellow traders.
💬 Thoughts? Drop your view in the comments.
#eth idea of short im already in it dyoreth/usd idea of short im already in it DYOR
wht im seeing eth give potentially much gains in this quarter
so its time to fill the remaining below and fullfill them
well im not financial advisor but here u can see to other dimention of digital silver
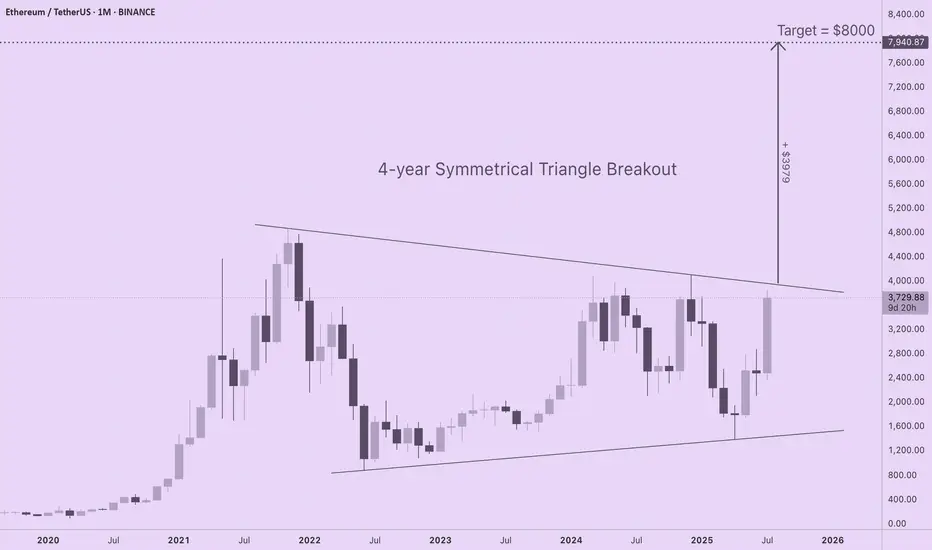
ETH Targets $8000 with 4-Year Symmetrical Triangle BreakoutIf you are seeking realistic ETH price targets based upon solid long-term market structure, check out this 4-year symmetrical triangle forming on the ETH/USD monthly chart. ETH is coiling for a major move to $8000, yet none of the CT "influencers" I follow are talking about this. I am new to technical analysis, so I am interested in learning your thoughts about this pattern and which tools or indicators you prefer for setting price discovery targets.
For those of you new to technical analysis, symmetrical triangle patterns can form on long timeframes (weeks, months, or years), indicating indecision between bulls and bears as price compresses within a continually narrowing range. A breakout from a symmetrical triangle typically follows the direction that preceded their formation, and the longer the consolidation period, the stronger the move.
The chart shows a strong euphoric phase in 2021 followed by a bear market low. Subsequent failure to reach previous ATHs is balanced by a pattern of higher lows. Since ETH was in an uptrend prior to triangle formation, odds are this is a continuation pattern, especially given profound shifts in capital flows and sentiment for the asset over the last several weeks.
With trendlines set at the price extremes, the height of the triangle is roughly $3980. If a breakout occurs at a price of $3960, ETH will target a price of $7940 (height of triangle + breakout price). A more conservative price target of $7000 is obtained by resetting the trendlines at the monthly opening and closing prices (omitting the wicks).
Regardless of the specific method for drawing the triangle, ETH is primed for a major move to the upside that has been four years in the making.
Possibility of Ethereum moving toward the \$3,330 price range.Considering the breakout of the 4-hour channel and confirmation of the downtrend, reaching the \$3,330 level is not out of the question.
This target was derived using a pattern-based projection from the channel breakout.
I’ve personally taken this position, but I’m not recommending it — just sharing for informational purposes.
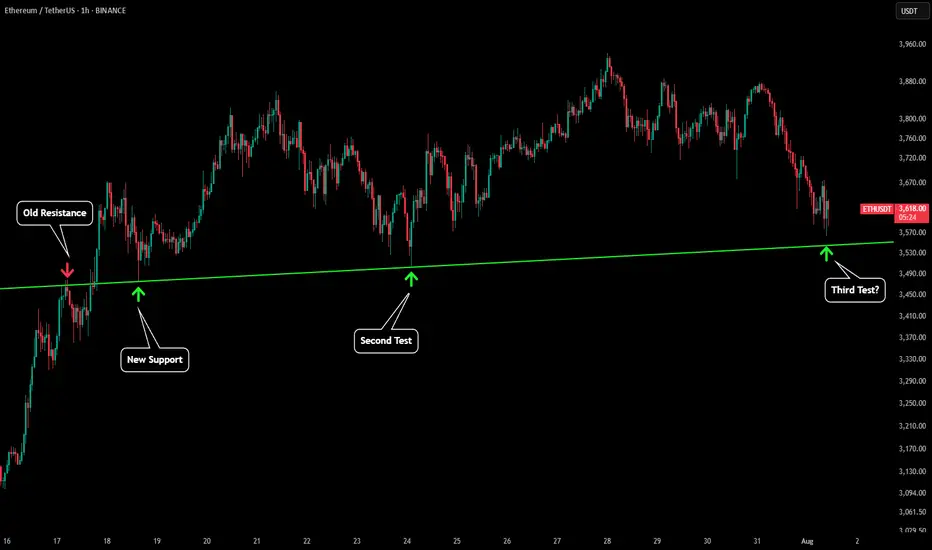
ETH - Still Respecting Important LinesPlease refer to our previous post:
Eth looks to be going for a third test of our green trendline. This would price around $3,550 which is also the 1D 21 MA. Therefore continuing to close daily candles above that price level will keep the uptrend in tact.
Ethereum will fix above the $2450 ┆ HolderStatBINANCE:ETHUSDT is stabilizing above $3,450 after a strong parabolic move. A minor dip beneath local lows is possible, but the structure remains bullish. If the level holds, expect continuation toward $4,200 as momentum builds.
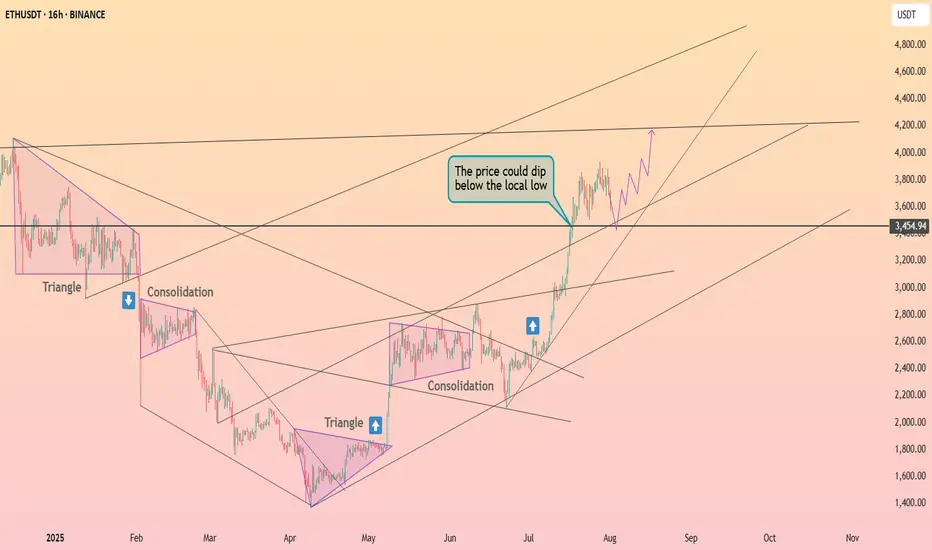
Range again $ETHDue to typical ETH behavior we can form a range
Can be identified without any lines where I suppose will stay for a month or so consolidating

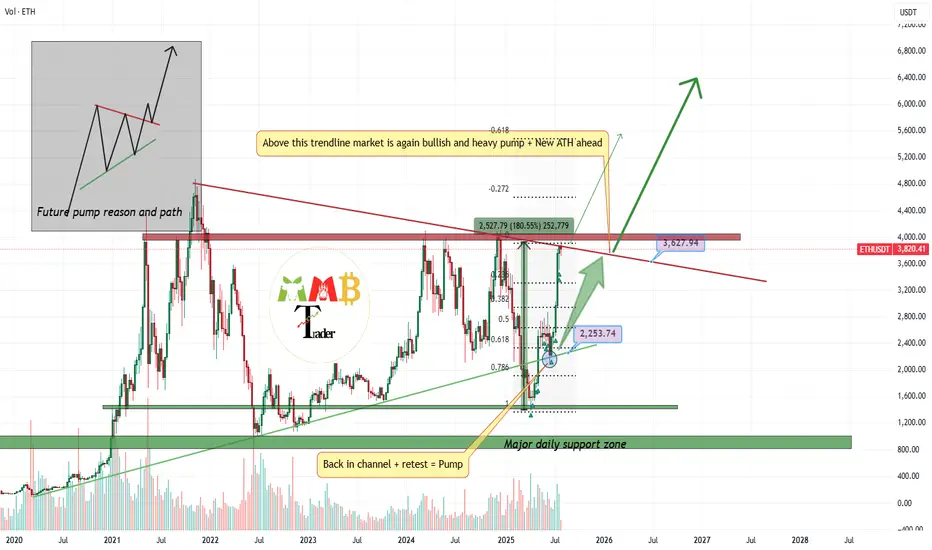
4000$ is last resistance left Ready for breakout and pump?market is still bullish and i am looking for breakout here to the upside for sure But we should consider this factor that major resistance now is touching and we may have first short-term fall.
so for now we may have correction and dump to the targets like 3300$ which is first support of 0.23 Fibonacci level.
and after this healthy correction or without it we can expect more pump and breakout of 4K$ and heavy pump to the targets like 7K$.
DISCLAIMER: ((trade based on your own decision))
<<press like👍 if you enjoy💚
ETHUSDT - FUTURES SIGNAL FUTURES SIGNAL
Coin: ETH
Direction: LONG
🟢Input range: market/3578
✔️ТР: 3726/3902
❌SL: 3501
We work from the order block zone, in which I expect a price reversal.

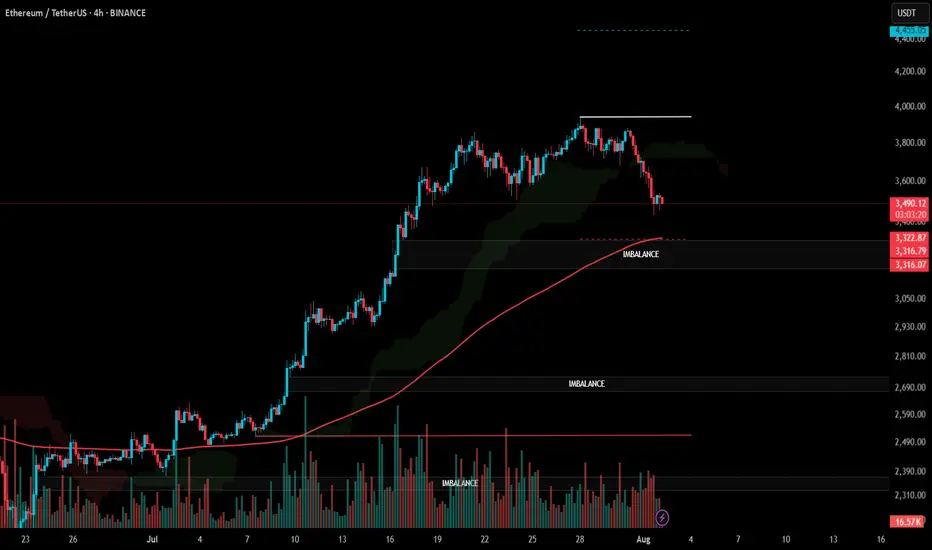
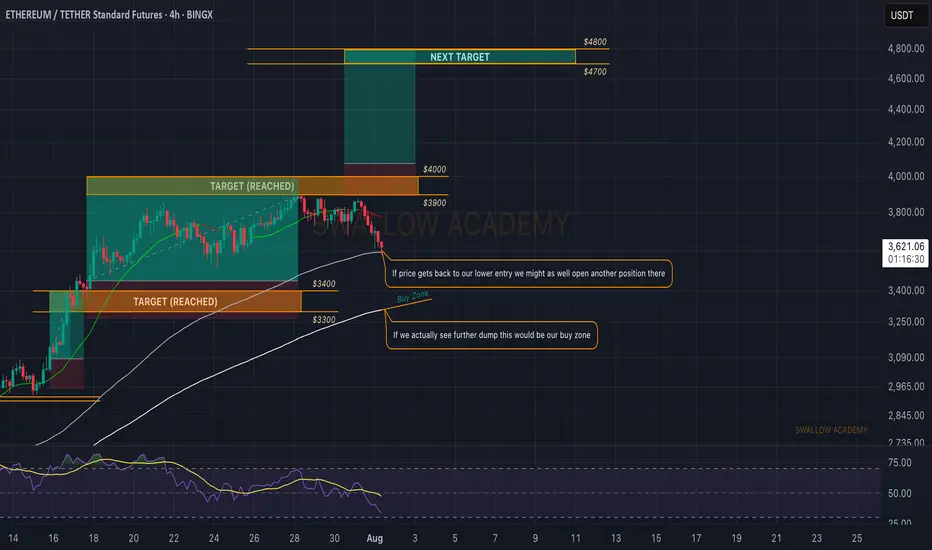
Ethereum (ETH): Bloody End of Week & Start of Month | We Wait!Well, we were close to breaking out of the $4000 area and now we are back on the lower side of the area, where sellers are showing strong pressure to coin.
As we approached the 100 EMA, we waited. Waiting is the worst part of trading, but that's what we do here. The 200 EMA is one key zone for us for another buying opportunity so if we keep on falling, that's the zone we are aiming for.
The second point of interest is the current 100 EMA, where if we see MSB to form, there might be a smaller scalp opportunity.
And last but not least, the zone above $4000.
Swallow Academy
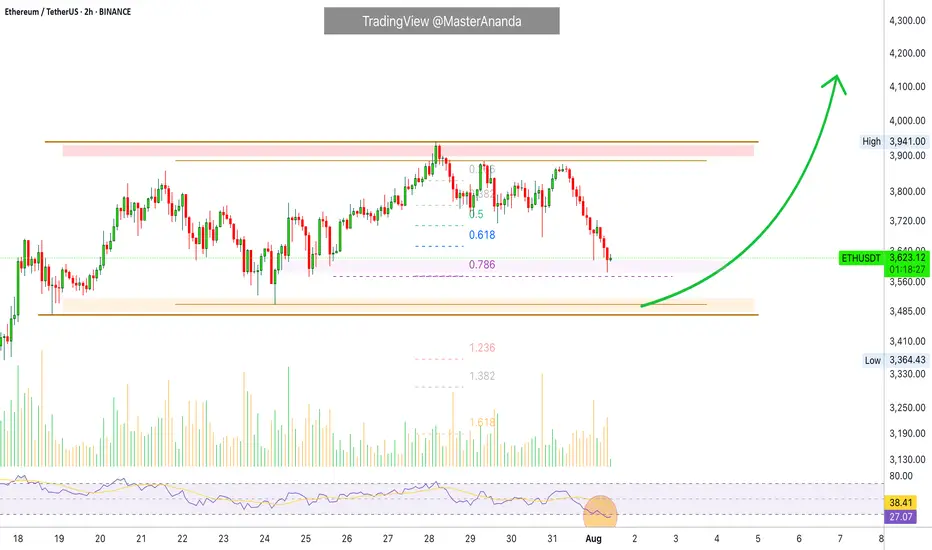
Ethereum Short-Term · Trading within Bullish RangeI am looking at Ethereum short-term using the same timeframe I used for Bitcoin, 2h. We have some interesting signals.
Here ETHUSDT is trading within higher lows. This is interesting because Bitcoin produced a lower low recently. The same volume signal is present here, ETHUSDT has been producing lower bearish volume since last month.
The RSI produced a lower low while ETHUSDT produced a higher low. This is called a hidden bullish divergence. Ethereum's bears did not only fail to take out the last low 24-July but also the previous one, and this clearly reveals bullish support.
The RSI being oversold is also a positive condition and can signal a reversal happening soon. Not truly a reversal because we are not in a downtrend, we are still witnessing a small pause after a strong rise; consolidation near resistance. A continuation reads better.
Ethereum's price continues really strong and the short-term signals are pointing to bullish action being favored in the coming days. We can wait easily and patiently because the best is yet to come. Never SHORT in a bull market, the market will surprise you with how fast things can turn. Better wait for support and go LONG.
Namaste.
Smart Money Knows: ETH Is Gearing for a Supercycle...Hello Traders 🐺
In this idea, I wanna break down why $15K ETH isn't just a fantasy — it's a real, reachable target. So stay with me 'til the end, because this is just the beginning for Ethereum and the altcoin market.
If you’ve been following my ideas over the past year, you know I’ve been loudly calling for an incoming altseason — especially since ETH hit $1700. I kept saying: “Load up on ETH while you can,” because smart money was clearly rotating into it.
And now? We’re seeing the result.
Since then, Ethereum has nearly 2x’d, and ETH ETFs are pulling in massive inflows — but the price hasn’t exploded yet. Why? Let’s look closer.
Over the past 90 days, ETH has rallied around +180%, but in a quiet, steady climb — which is actually bullish. A strong move with low hype = accumulation. That’s how smart money moves.
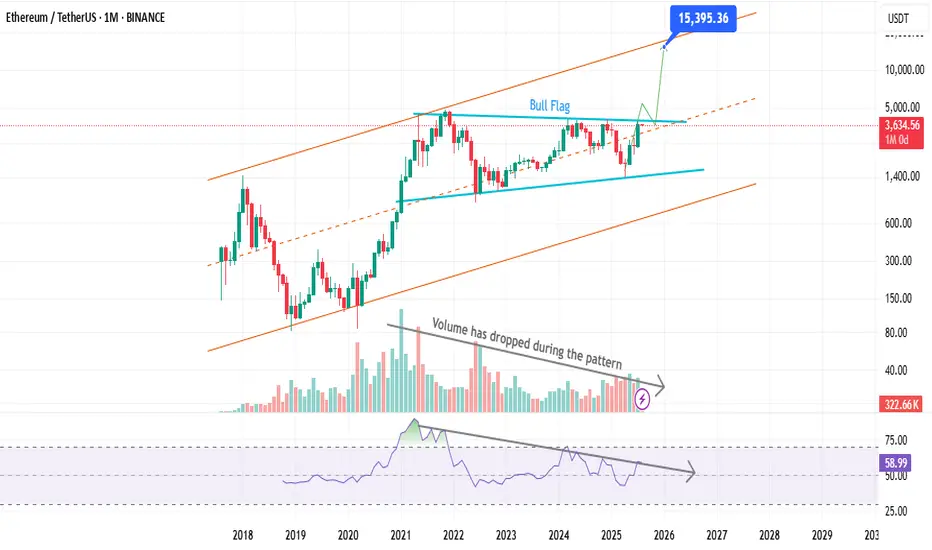
📊 Monthly Chart Breakdown:
ETH is moving inside a perfect ascending channel, with clean touches on both support and resistance. Right now, price is forming a bullish flag pattern at the upper range — a classic continuation structure.
Volume has dropped during this flag, which is a textbook sign of accumulation. Add to that: RSI is sloping downward, signaling that large players are shaking out weak hands while loading up quietly.
So yes — ETH has already done +180% during this consolidation phase, which tells us something big is brewing.
🔁 The current pullback on the daily? In my opinion, it’s just a technical reaction to the flag resistance. RSI is also trying to break above its own trendline. If both confirm, the next wave begins.
🎯 Targets?
First target: All-Time High around $4870.
After that? There's nothing but air until we hit the top of the monthly channel near $15,000.
That breakout above ATH is where the real FOMO begins — not just for ETH, but for the entire altcoin market.
Let’s not miss what’s coming.
And as always, remember our golden rule:
🐺 Discipline is rarely enjoyable, but almost always profitable. 🐺
🐺 KIU_COIN 🐺
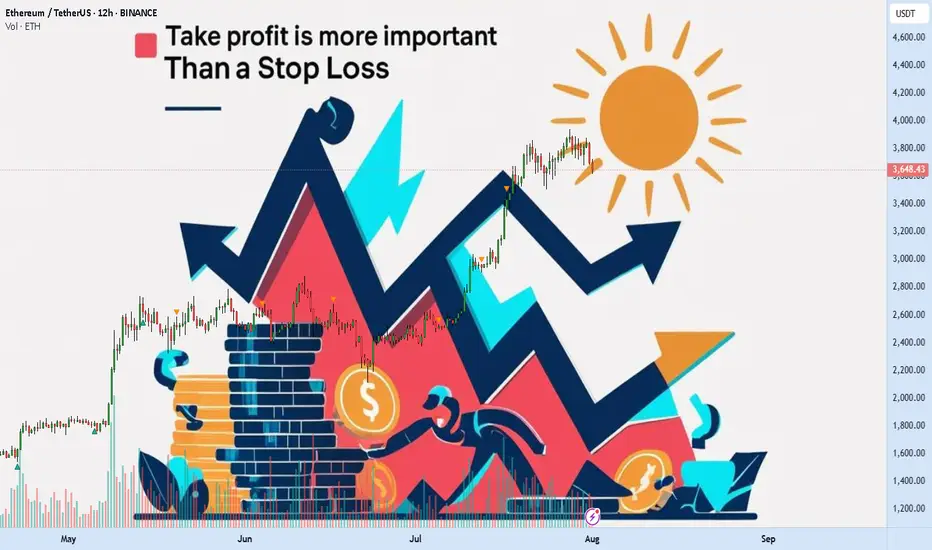
Take profit is more important than a stop lossAre you actually in profit, or just delaying your next loss?
How many times have you watched your gains vanish because you wanted more?
Maybe it's time to stop fearing losses and start planning exits.
Hello✌️
Spend 3 minutes ⏰ reading this educational material.
💸 Why Most Traders Lose Profits They Already Had
Most traders obsess over stop losses but never define where they'll take profits. Imagine entering a great trade, watching the price go up, then suddenly it pulls back and you're out with nothing. That happens because you didn’t define your win.
A well-placed take profit acts like a contract with your future self. It secures your gain before the market decides otherwise.
📉 No Take Profit? Say Hello to Unnecessary Losses
Failing to set a take profit is basically handing the market a free ticket to reverse your gains. Especially in the highly volatile crypto space, a missed exit often turns into a regretful stop out. So while everyone is talking about stop losses, you should focus on where the money is actually made.
🧮 A Clear Profit Target Creates a Clear Mind
Having a defined profit target gives your mind a place to rest. It brings structure and removes hesitation. This peace of mind is something new traders lack, which often leads them to close early or hold too long.
🧠 Greed Is the Real Enemy of Your Gains
Greed whispers "Wait, it might go higher"
But when you don't have a take profit plan, that whisper becomes your worst advisor. Pro traders map their exits before entering, while amateurs dream of riding forever.
🛡 True Capital Protection Begins with Profit Protection
If you're aiming for safe capital in crypto, it's not just about minimizing losses. It's about securing wins. Beginners often build their whole plan around stop loss. But advanced traders fear losing profits more than they fear taking a hit.
🎯 Take Profit Is Your Emergency Exit Plan
Setting a profit target is like having an escape route during a fire. Without it, you’ll panic when things turn. Crypto markets are full of pump traps. Your profit is only real when you actually take it.
🚪 Exit Strategy Matters More Than Entry
Everyone talks about entries, but it's your exit that defines whether your trade ends in green or red. Many traders nail the perfect entry but without a clear exit plan, they hand back their profits. Prioritizing your take profit is not optional. It’s essential.
🔁 Managing Gains Is Managing Emotions
Without a defined exit, every candle can shake your decision-making. But when your take profit is set in advance, emotions can’t hijack your strategy. You’re following a plan, not a feeling.
📊 TradingView Tools to Manage Take Profits Effectively
In the world of trading, the right tool means the right decision. TradingView offers powerful tools that help you manage not just your stop loss but more importantly, your take profit targets. With tools like Price Range and Long/Short Position, you can easily visualize where you entered and where you need to exit before greed pulls you deeper.
The Fibonacci Extension tool is especially valuable during bullish runs. It allows you to map out realistic and strategic profit levels like TP1, TP2, and TP3. These targets can then be paired with horizontal lines or alerts within TradingView’s chart system.
Even if you're using a free TradingView account, a simple custom Pine Script can help set alerts when your percentage targets are hit so you can scale out or lock in profits instead of emotionally reacting to price movement.
Using these tools practically empowers traders to build real-world strategies and take control of their exits, not just their entries. That’s the real edge.
📌 Final Takeaway
A clear, well-placed take profit protects both your money and your mind. Don’t let your wins dissolve into losses. With the right tools and the right mindset, you don’t just survive the market, you beat it. Start managing your profits today, not just your losses.
✨ Need a little love!
We pour love into every post your support keeps us inspired! 💛 Don’t be shy, we’d love to hear from you on comments. Big thanks , Mad Whale 🐋
📜Please make sure to do your own research before investing, and review the disclaimer provided at the end of each post.
ETHUSDT.PIf you look at the chart, you will notice an uptrend that has somewhat lost its strength and we may not be able to hit higher highs like the next strength in the next move.
Support: 3.660 - 3.590 - 3.160
Resistance: 3.900 - 4.260
Entry: 3.700
SL: 3.500
TP: 4.240
Please control risk management.⚠️

ETH Still Holding Key LevelDespite the recent pullback following the FOMC meeting, Ethereum is still trading above a key daily level that previously acted as resistance ($3,865). As long as we don't see a daily close below this zone, the market structure remains intact, and my bias stays bullish.
Support holding here could set the stage for another leg up and potentially reignite altseason, going below will cause me to shy away from the idea of an altseason in the short future.
For now, I’m watching daily close closely and staying patient
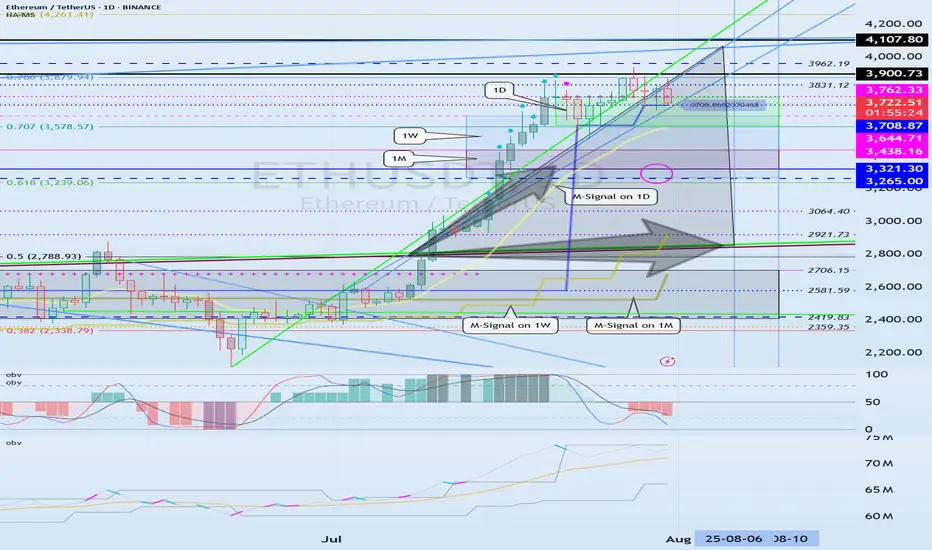
The key point to watch is whether it can rise to 3900.73-4107.80
Hello, traders. Nice to meet you.
If you "Follow," you'll always get the latest information quickly.
Have a great day.
-------------------------------------
(ETHUSDT 1D Chart)
The upward trend continues, with the M-Signal on the 1D chart > M-Signal on the 1W chart > M-Signal on the 1M chart.
Therefore, if the price holds above 3265.0-3321.30, a medium- to long-term uptrend is likely.
Currently, the HA-High ~ DOM(60) range is formed across the 3265.0-3762.33 range on the 1M, 1W, and 1D charts.
Therefore, the key question is whether support is found within the 3265.0-3762.33 range.
-
While the price is trending upward along the short-term trendline, if it falls below the short-term trendline and encounters resistance by falling below the M-Signal indicator on the 1D chart, a decline to the 3265.0-3321.30 range is likely.
ETH's volatility period is expected to last from August 6th to 10th.
The key point to watch is whether it can rise above the 3900.73-4107.80 range after this volatility period.
-
Since the StochRSI indicator has entered an oversold zone, the downside is likely to be limited.
Since the OBV indicator of the Low Line ~ High Line channel remains OBV > OBVEMA, a significant decline is unlikely.
However, since the TC (Trend Check) indicator is below zero, selling pressure is dominant.
Therefore, a decline below 3708.87 could lead to further declines. However, as previously mentioned, the decline is likely to be limited, so a significant decline is not expected.
Once the M-Signal indicator on the 1D chart is encountered, the trend is expected to re-establish itself.
-
Thank you for reading to the end.
I wish you successful trading.
--------------------------------------------------
- This is an explanation of the big picture.
(3-year bull market, 1-year bear market pattern)
I will explain in more detail when the bear market begins.
------------------------------------------------------
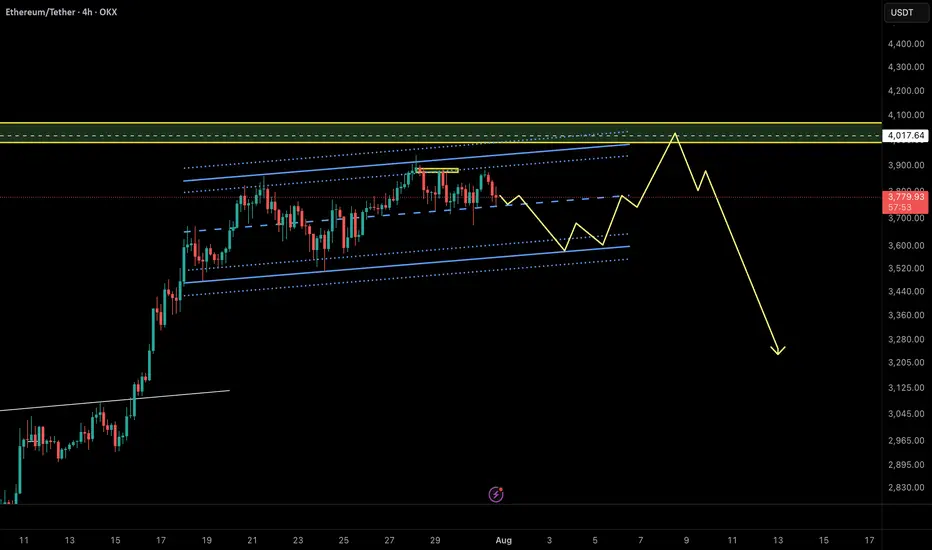
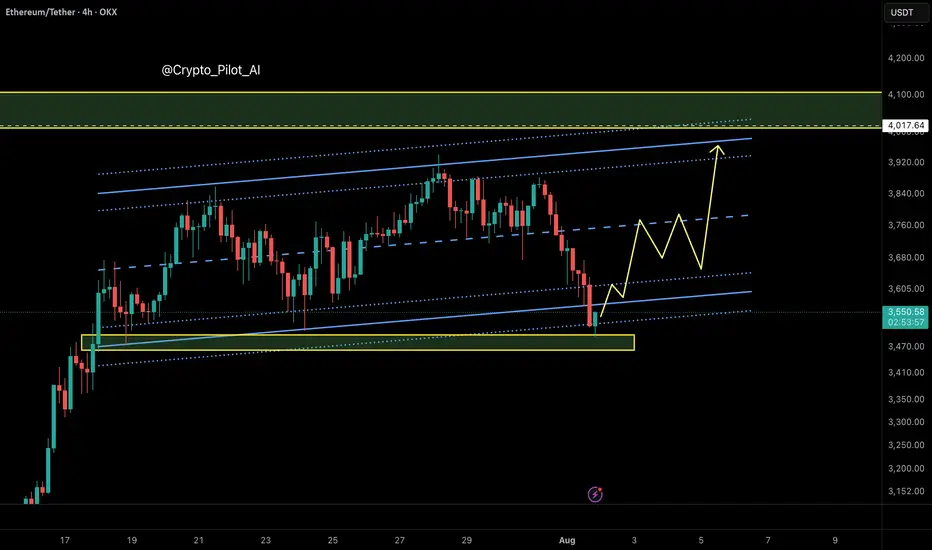
Ethereum Quick Outlook – Potential Trap Before Drop?ETH is moving within a rising channel, but momentum is fading. Price failed to break above the midline and is now testing lower support.
A fakeout to the upside toward the $4,015–$4,050 supply zone is possible before a deeper drop. The projected path suggests a short-term bounce, final liquidity sweep, then potential reversal.
🟡 Key Resistance: $4,015
🔻 Breakdown trigger: Below $3,620
🎯 Bearish Targets: $3,250 → $3,100
Structure hints at a possible Ending Diagonal (Neowave), or a Trap-Wave E inside a Complex Correction.
⚠️ Watch for manipulation near highs – confirmation needed for short entry.