The key point to watch is whether it can rise to 3900.73-4107.80
Hello, traders. Nice to meet you.
If you "Follow," you'll always get the latest information quickly.
Have a great day.
-------------------------------------
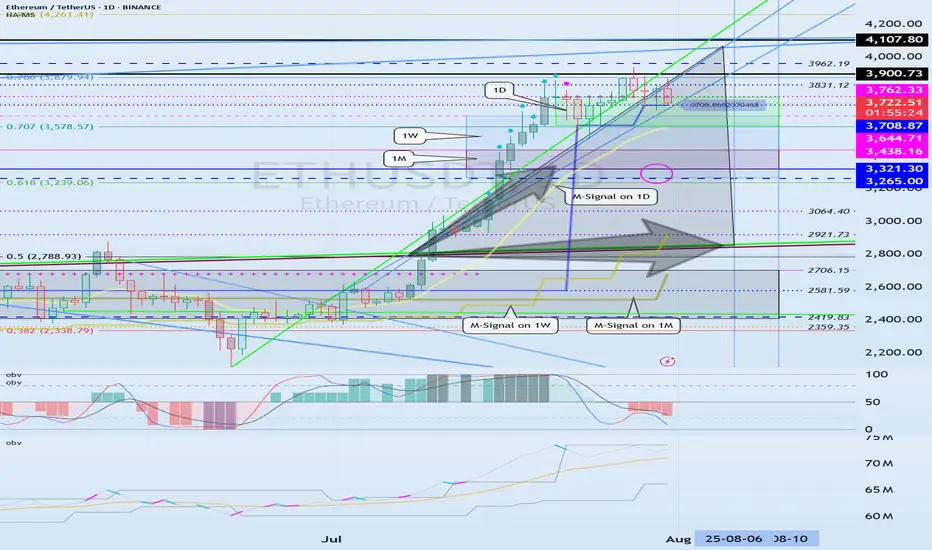
(ETHUSDT 1D Chart)
The upward trend continues, with the M-Signal on the 1D chart > M-Signal on the 1W chart > M-Signal on the 1M chart.
Therefore, if the price holds above 3265.0-3321.30, a medium- to long-term uptrend is likely.
Currently, the HA-High ~ DOM(60) range is formed across the 3265.0-3762.33 range on the 1M, 1W, and 1D charts.
Therefore, the key question is whether support is found within the 3265.0-3762.33 range.
-
While the price is trending upward along the short-term trendline, if it falls below the short-term trendline and encounters resistance by falling below the M-Signal indicator on the 1D chart, a decline to the 3265.0-3321.30 range is likely.
ETH's volatility period is expected to last from August 6th to 10th.
The key point to watch is whether it can rise above the 3900.73-4107.80 range after this volatility period.
-
Since the StochRSI indicator has entered an oversold zone, the downside is likely to be limited.
Since the OBV indicator of the Low Line ~ High Line channel remains OBV > OBVEMA, a significant decline is unlikely.
However, since the TC (Trend Check) indicator is below zero, selling pressure is dominant.
Therefore, a decline below 3708.87 could lead to further declines. However, as previously mentioned, the decline is likely to be limited, so a significant decline is not expected.
Once the M-Signal indicator on the 1D chart is encountered, the trend is expected to re-establish itself.
-
Thank you for reading to the end.
I wish you successful trading.
--------------------------------------------------
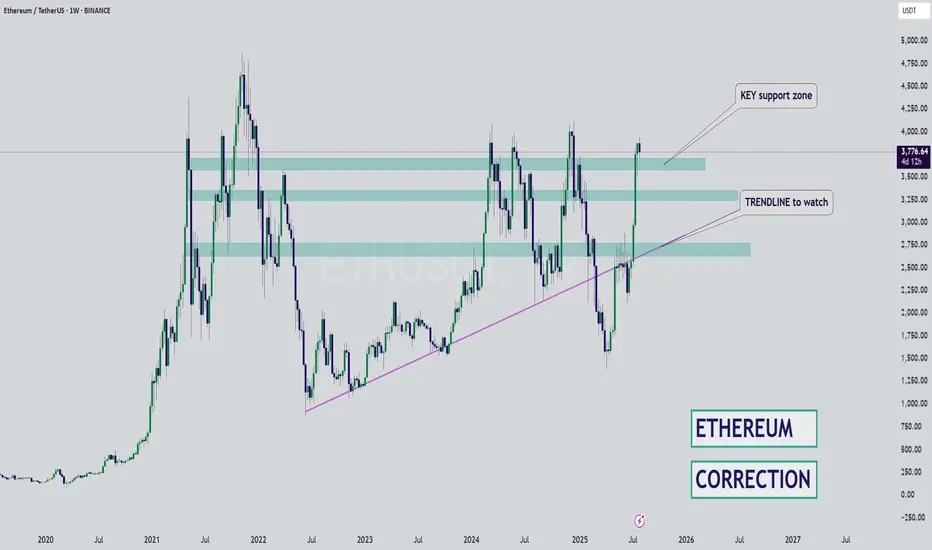
- This is an explanation of the big picture.
(3-year bull market, 1-year bear market pattern)
I will explain in more detail when the bear market begins.
------------------------------------------------------
ETHUSDT.P trade ideas
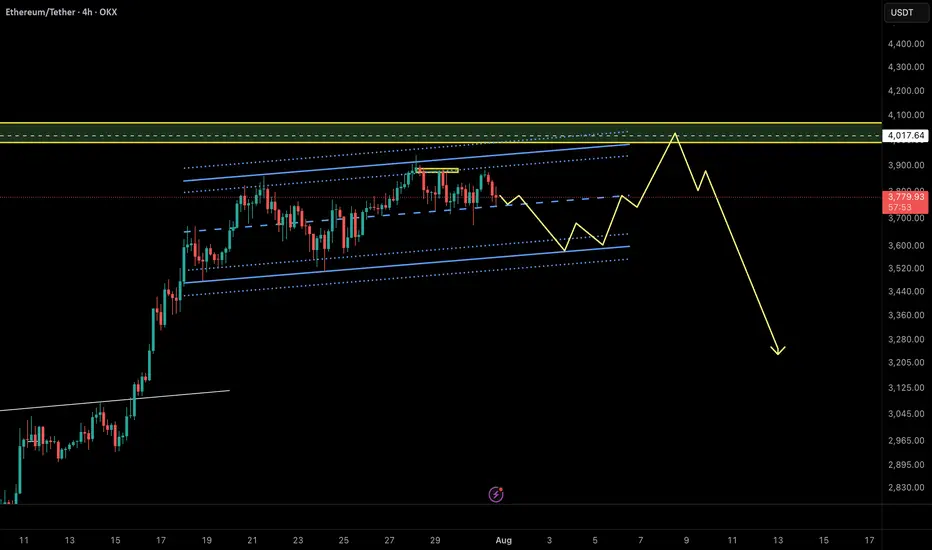
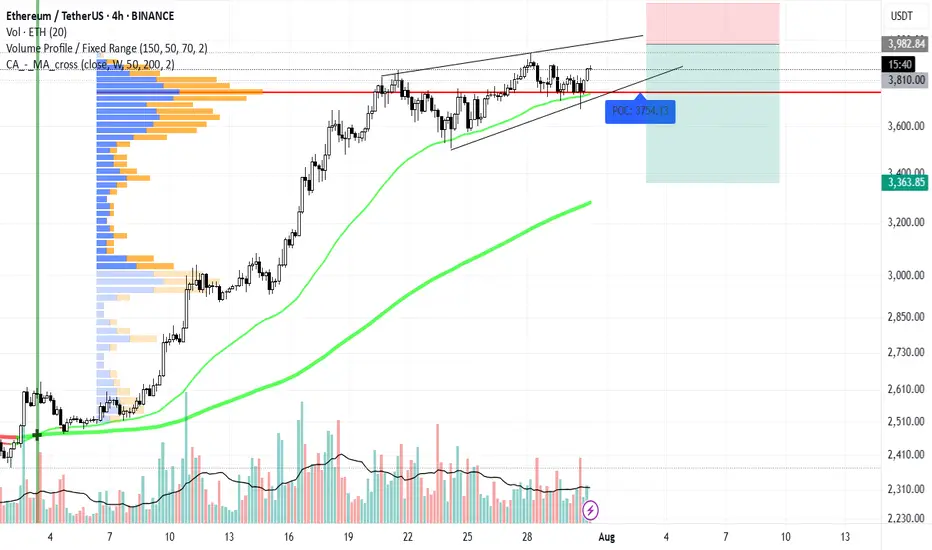
Ethereum Quick Outlook – Potential Trap Before Drop?ETH is moving within a rising channel, but momentum is fading. Price failed to break above the midline and is now testing lower support.
A fakeout to the upside toward the $4,015–$4,050 supply zone is possible before a deeper drop. The projected path suggests a short-term bounce, final liquidity sweep, then potential reversal.
🟡 Key Resistance: $4,015
🔻 Breakdown trigger: Below $3,620
🎯 Bearish Targets: $3,250 → $3,100
Structure hints at a possible Ending Diagonal (Neowave), or a Trap-Wave E inside a Complex Correction.
⚠️ Watch for manipulation near highs – confirmation needed for short entry.
Ethereum is holding the $3700 level ┆ HolderStatOKX:ETHUSDT rallied from multiple triangle breakouts to test 4,400+ before pulling back. It’s now approaching key support at 3,576, which coincides with a major horizontal and trendline intersection. If this zone holds, the next leg up may target 4,600–4,800. Structure remains bullish above 3,500.

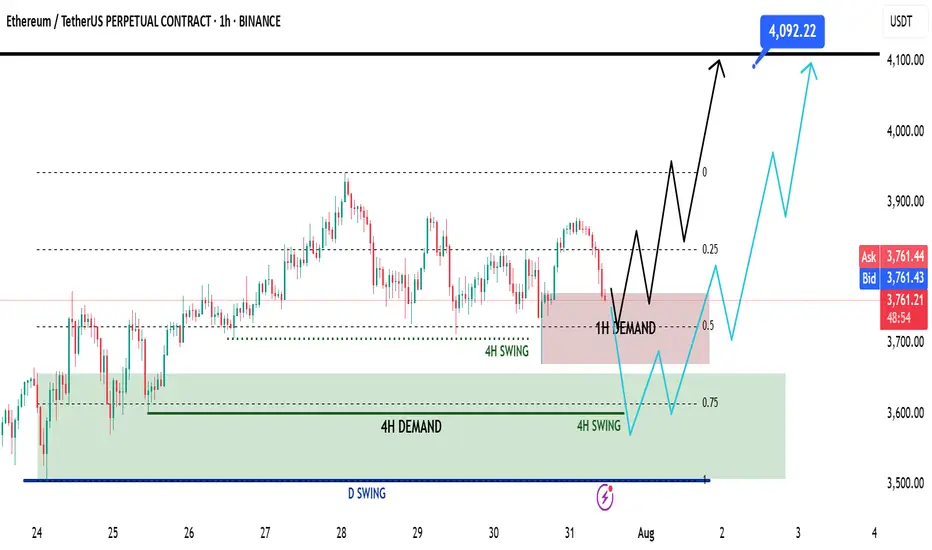
Ethereum Mid Week Update - Swing Long Idea📈 Market Context:
ETH remains in a healthy bullish structure. Despite the recent retracement, price action is still supported by strong demand zones on higher timeframes. No change in the overall sentiment from earlier this week.
🧾 Weekly Recap:
• Price rejected from the Fibonacci 0.5 EQ level — a discounted zone in my model.
• While doing so, it also ran 4H swing liquidity.
• After taking liquidity, ETH formed a 1H demand zone — a sign to look for lower timeframe confirmations for long setups.
📌 Technical Outlook:
→ Price has already tapped into the 1H demand zone.
→ From here, we have two possible scenarios:
Black scenario (ideal):
• Wait for 15M bullish break of structure (BOS).
• Enter after confirmation for long setups from 1H demand.
Blue scenario (deeper retrace):
• If no bounce from 1H demand, expect price to dip toward 0.75 Fib level (max discount).
• Watch for another liquidity run & 1H–4H demand formation.
🎯 Setup Trigger:
✅ 15M bullish BOS inside 1H or 4H demand zones
→ This would be the entry confirmation trigger for longs.
📋 Trade Management:
• Stoploss: Below the swing low of the 15M BOS
• Target: 4090$
💬 Like, follow, and drop a comment if this outlook helped — and stay tuned for more setups each week!
Ethereum's futile attempt to go up.Ethereum’s pointless push and unnecessary insistence on going up — if it really wants to hit a new ATH, it needs to drop first, both to take a breather and to let buyers with lower buy orders get into the game.
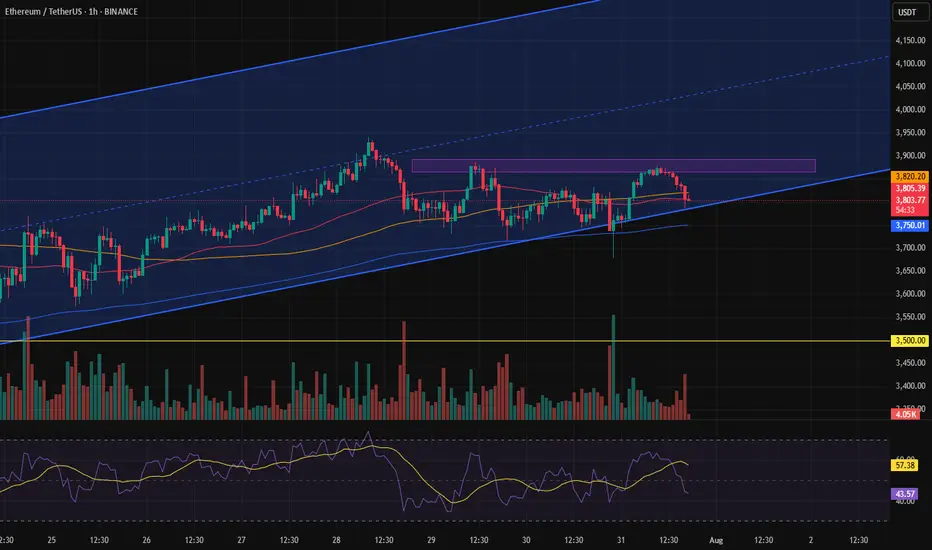
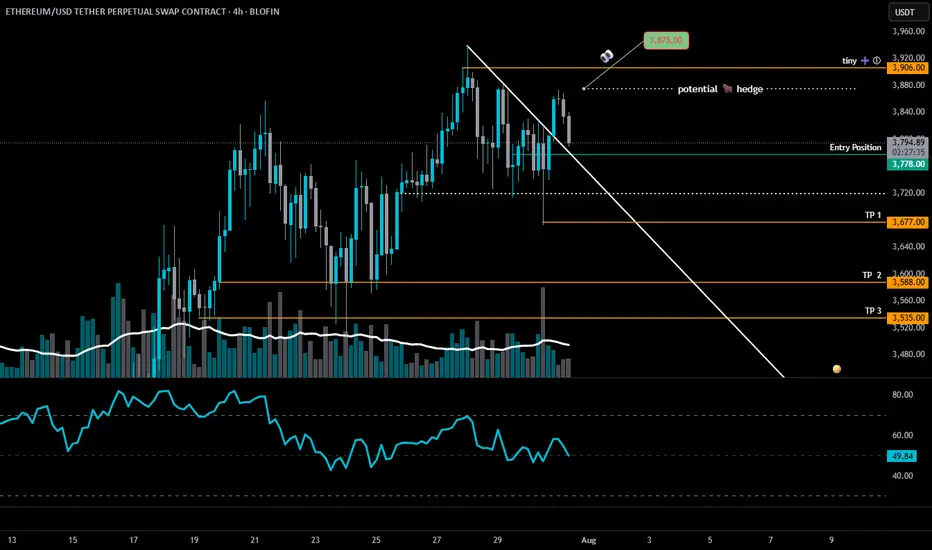
ETH is at a critical inflection pointETH 4H – Decision Time 🧠🐂🐻
Ethereum’s dancing on the edge of a blade.
📍 Entry: $3,778 (Short)
🧪 Next Add: Tiny at $3,906 (updated)
🚨 Major Add: Above $4,100 (TBD)
⚠️TP 1: $3,677 (updated)
We’ve broken the downtrend line — bullish on paper — but ETH is stalling right near resistance at $3,875. If bulls don’t show up with volume and conviction, this move fizzles out fast.
Here’s the playbook:
🔸 $3,875 = key battle zone
— Reclaim it clean (4H close + volume) = "short-term" bear bias invalid (◘reread◘)
— Failure = likely drop to $3,677 → $3,588
🔸 $3,720 = swing short confirmation if broken
🧩 If bulls win $3,875, I keep the short but hedge with a long. Because if the herd’s charging uphill, they might lead us to gra$$.
Momentum is king. No follow-through = fakeout top.
Let the chart breathe.
LOW LEVERAGE POR FAVOR!
Stay Sharp. Stay nimble. 🎯
100% not financial advice, for edutainment purposes only!
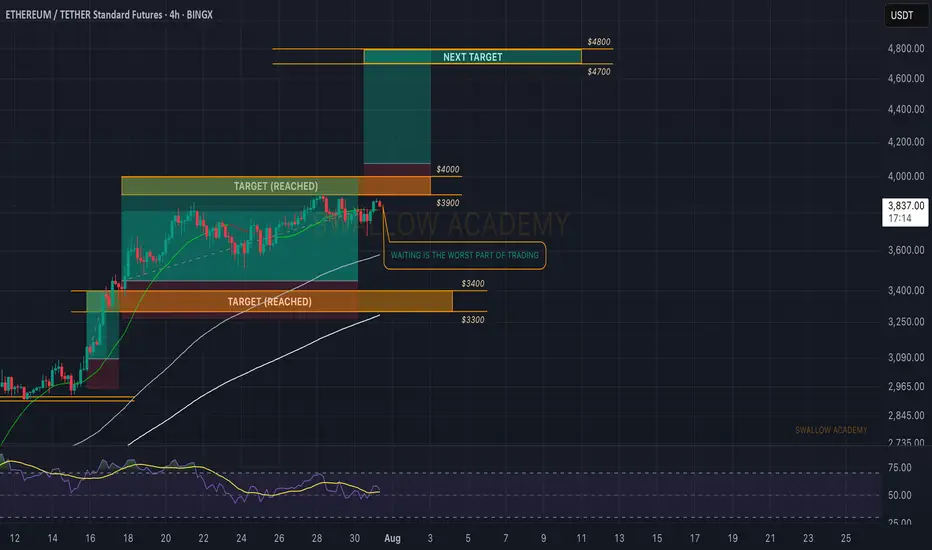
Ethereum (ETH): Waiting Is The Worst Part Of Trading | $4800ETH still looks good; we hit the target lately and now we are looking for the breakout to happen, which will give us another opportunity for a long position towards the $4800 zone.
Swallow Academy
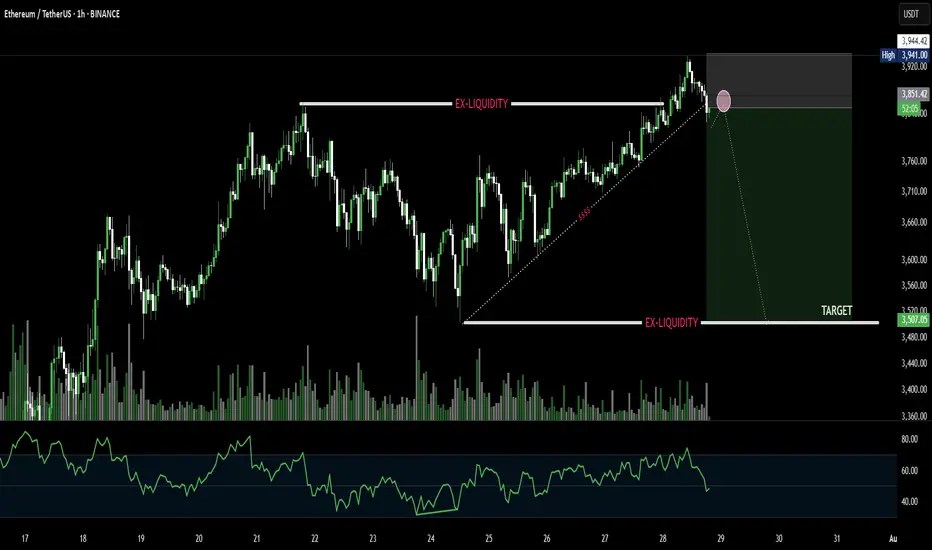
$ETH 1H Descending Channel Breakout🟩 Breakout Level: $3,770
🟩 Fib-Based Targets:
→ $3,878 (0.236)
→ $3,940 (0)
→ $4,040 (0.382)
🟥 Invalidation:
Break back inside the channel + loss of $3,678
Momentum Summary:
Perfect touchpoints across the descending channel. Final wick tagged demand with massive volume, followed by impulsive breakout and retest. Short-term structure favoring bullish continuation.

ETH ready for a Pullback.... As we can see, BINANCE:ETHUSD is forming a wedge pattern and may drop to $3,300. We're in a bullish trend, so shorting ETH could be risky—please be cautious !
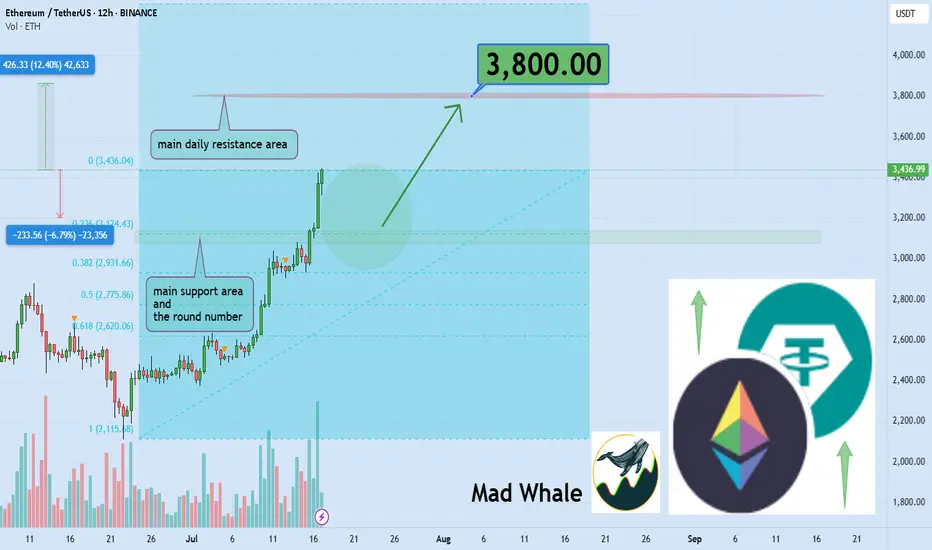
Crypto Exploded, I Missed it, What should I Buy Now?!The market suddenly exploded… green candles after green candles. Yesterday, you were hesitating to look at the chart, today everyone on social media is posting their profits. So what now? Did you miss out? It’s not too late. The main question now is: What should I buy to catch up?
If you read this analysis till the end, not only will you learn some practical TradingView tools, but you’ll also gain insight into how to act like a professional trader after big pumps not like a reactive follower.
Hello✌
Spend 3 minutes ⏰ reading this educational material.
🎯 Analytical Insight on Ethereum:
BINANCE:ETHUSDT is currently holding near the daily support and the key psychological level at $3,000, which also matches the 0.23 Fibonacci retracement. A potential upside of at least 12% is expected, targeting $3,800 close to a major daily resistance zone. Keep an eye on these levels for possible trade setups 📊⚡.
Now , let's dive into the educational section,
🧠 FOMO: The Enemy That Devours Your Profits
If you feel like you missed the boat now, don’t panic. Everyone has felt that, even top traders. It’s called "FOMO." Jumping into the market without analysis and just on emotions can burn you badly. Instead of regretting, sit calmly, analyze, and wait for the right setup. The market always offers new chances you just need to know how to hunt them.
🔍 What to Buy Now? Logic Over Emotion
There are three types of coins still offering opportunity:
Coins that haven’t broken their previous highs yet
Like a compressed spring, they can jump higher with a small push.
Altcoins lagging behind Bitcoin
When BTC pumps, alts usually follow afterward.
Coins with strong upcoming fundamental news
Networks with upcoming updates or special events that generate excitement.
Don’t forget on-chain analysis. See where money is flowing.
🌟 Look for New Stars and Strong, Established Coins
After a pump, there are two ways to hunt:
🔹 New Stars
Altcoins that are just coming out of their correction phase and haven’t had their main pump yet.
🔸 Strong and Established Coins
Assets that have shown resilience, have strong fundamentals, and tend to pump again after corrections.
Balance your portfolio with both to lower risk and maximize profit potential.
🧰 TradingView Tools to Hunt Opportunities After a Pump
To avoid missing out in the second phase of the market explosion, you must use TradingView’s analytical tools correctly. Here are three key tools you should know right now:
Volume Profile
Helps you understand where most trading volume occurred. Smart money usually buys and sells heavily at these points.
RSI (Relative Strength Index)
Tells you when the market is overbought. When it drops back to the 40 to 50 range after a peak, that could be a good re-entry point.
Fibonacci Retracement
A tool to find attractive correction zones after a pump. Especially useful if you combine multiple timeframes.
⚖️ Stop Loss Is Necessary, But Take Profit Is More Important
Always place a stop loss in the market. But many forget to set a take profit in bullish markets.
Having a take profit level ensures you lock in gains when the market hits your target and avoid greed.
Key point: Even if you expect huge pumps, take some profit on time to avoid losing it all during corrections.
🪙 The Next Pump Is Just Around the Corner
Instead of jumping into a pump mid-way, focus on spotting setups just forming. Watch for consolidation candles, rising volume, and reactions to classic zones. That’s where you can enter professionally, even before everyone knows what’s coming.
🛠 Game Plan for the Trader Who Fell Behind
Pick three coins that haven’t pumped yet
Test the tools mentioned on them
Set alerts for logical entry signals
Enter with risk management, not emotion
Most importantly analyze, don’t just follow
📌 Summary and Final Advice
If you missed the market pump, don’t worry; crypto markets always offer opportunities you just need to be prepared. A combination of analysis, professional tools, and smart choices between new and established assets can help you not only catch the next pump but ride it ahead of everyone else.
✨ Need a little love!
We pour love into every post your support keeps us inspired! 💛 Don’t be shy, we’d love to hear from you on comments. Big thanks , Mad Whale 🐋
📜Please make sure to do your own research before investing, and review the disclaimer provided at the end of each post.
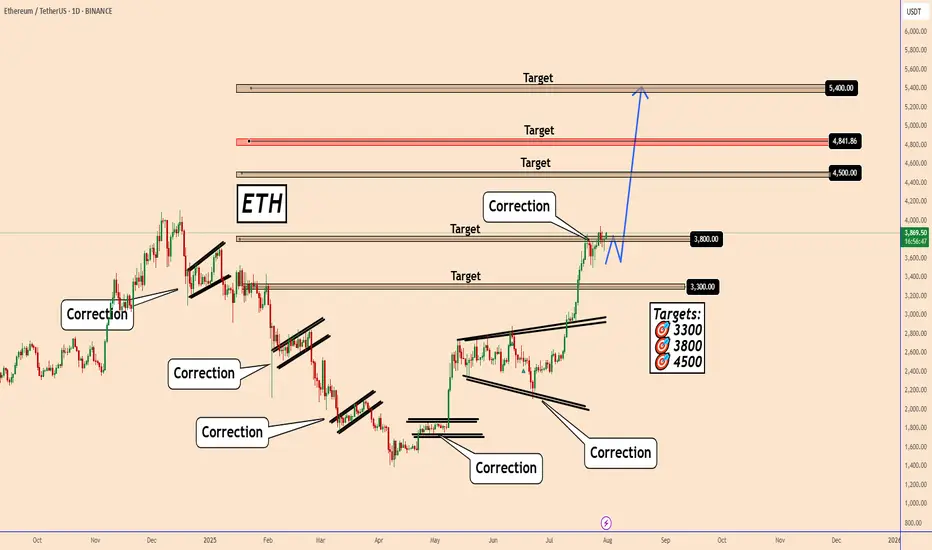
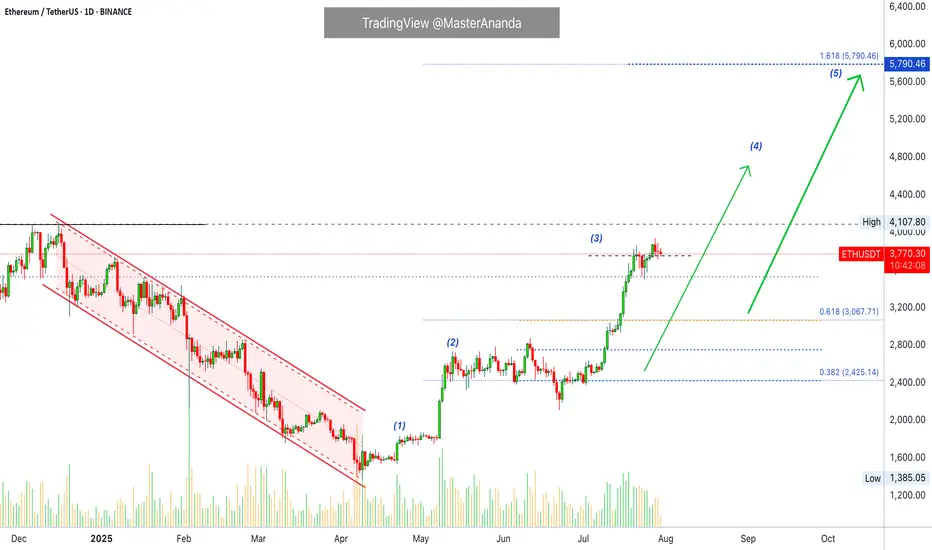
Ethereum: Bullish Momentum Recharging for the Next Leg UpEthereum: Bullish Momentum Recharging for the Next Leg Up
Daily Perspective on ETH Ethereum remains in a clear bullish trend on the daily chart. The long and consistent green waves reflect strong upward momentum over the past several days and weeks.
Looking left on the chart, ETH previously made several corrective moves during bearish phases. The current correction looks similar to those on the left side of the chart, but this time it is taking place within an uptrend.
The price is currently in a consolidation phase, likely preparing for another push higher. I’m watching three key upside targets: 4500, 4840, and 5400.
You may find more details in the chart!
Thank you and Good Luck!
PS: Please support with a like or comment if you find this analysis useful for your trading day
Bitcoin, Ethereum & Market Indexes
🔻 🚀 Bitcoin, Ethereum & Market Indexes 🔍
💎 HWC (1D) – MWC (4H) – LWC (1H) Cycle Analysis
⭕️ Structural Review: TOTAL, TOTAL2, TOTAL3, BTC.D, USDT.D
🔥 analysis Coins: BTC, ETH
📉 Strategy: Dow Theory + Fundamentals + Market Sentiment
🔥 Daily Market Analysis – July 31st 🔥
💎 Summary of Key News & Strategy:
✔️ Interest rates were officially held steady at 4.5% – as widely expected. However, Powell’s comments added slight bearish pressure to the market in the short term ❗️
✔️ It’s important to note: recent market growth happened with the same rate in place. So any positive economic news from the U.S. from now until September could trigger a Bitcoin pump 🚀
✔️ One major bullish catalyst: MicroStrategy purchased 21,000 BTC – a strong institutional support signal 💎
✔️ With the BTC monthly candle closing in a few hours, keep risk low and proceed with caution ❗️
✔️ if Volume is picking up in BTC and altcoin momentum is building. This opens up a strategic opportunity to enter long positions even before key breakouts in TOTAL, TOTAL2, and TOTAL3 🔥
♦️ BTC/USDT
Support 1: 115,000
Support 2: 111,000
Resistance: 120,000
Despite 2 days of bearish pressure, the overall BTC structure remains bullish
If the 120,000 level breaks with strong volume, we can use a stop-buy strategy to enter a long. Sellers managed to push down to 115,700, but buyers defended the level well.
⭕️ This volume near support can serve as early confirmation to enter altcoins.
🔥 Break of 120,000 is critical for sustained altcoin rallies.
♦️ BTC Dominance (BTC.D)
Watch for a breakout above 60.44 – if that happens, you should already be in altcoin positions 🔥
It still hasn’t broken the 62–62.36 zone, which remains supportive for altcoin strength ✅
♦️ TOTAL Market Cap
If we see signs of breaking 3.92, we should already be positioned 🔥
Key support: 3.71 – as long as the market holds above it, the long scenario remains valid 💎
♦️ TOTAL2
Open position should happen before a confirmed break of 1.54 ❗️
Waiting until after could lead to late and risky entries. Stay alert and responsive ✅
♦️ TOTAL3
Same logic – position before the 1.08 breakout. Entry afterward will be harder due to sharp candle and volatility ⭕️
♦️ USDT Dominance (USDT.D)
Currently attempting to break 4.40 but has not succeeded ❌ – this is good for buyers.
We should have long positions before any potential drop below 4.13 🔥
♦️ ETH / USDT
Buyers successfully defended the 3,750 support zone 💎
Given strong institutional interest, ETH has high bullish potential.
A break above 4,000 with powerful candles could kickstart the next bull run 🚀
✅ Early Entry Trigger: 3,858 – but only if ETH dips below this level first and returns back to it.
This gives us a tighter stop-loss and better risk/reward setup.
❌ If ETH blasts through 3,858 with a sharp candle, avoid chasing the move.
⭕️ Additional confirmations:
• ETH/BTC should break 0.3277 to confirm ETH strength
• ETH.D should break 12.16 for final validation
Most likely, ETH.D and ETH/BTC will give early confirmation before ETH/USDT breaks 3,858 ✔️
💥 If you found this helpful, don’t forget to FOLLOW and smash that 🚀 button for more daily insights! 💎

ETHUSDT - SCalp your day!Small scalps, extreme targets on yellow mid targets on the green, Keep in mind that a temp spike can happen for a fall, to a great extent, maybe?

A look at a CPR strategy using monthly CPRA look at a CPR strategy using monthly CPR - Using conditions to enter and move SL

ETH USDTETH - needs a breakout from this Trendline and we are targeting 4k$.
Good support 3600-3650.
Always DYOR!

Ethereum at \$3,500 — or not?As we can see, Ethereum was moving within a channel, but toward the end, it could only reach the midline of the channel before getting rejected.
This could be a signal for a drop toward the \$3,500 area.
Otherwise, it might be a fake move, followed by a return into the channel and a move back toward the channel’s midline.
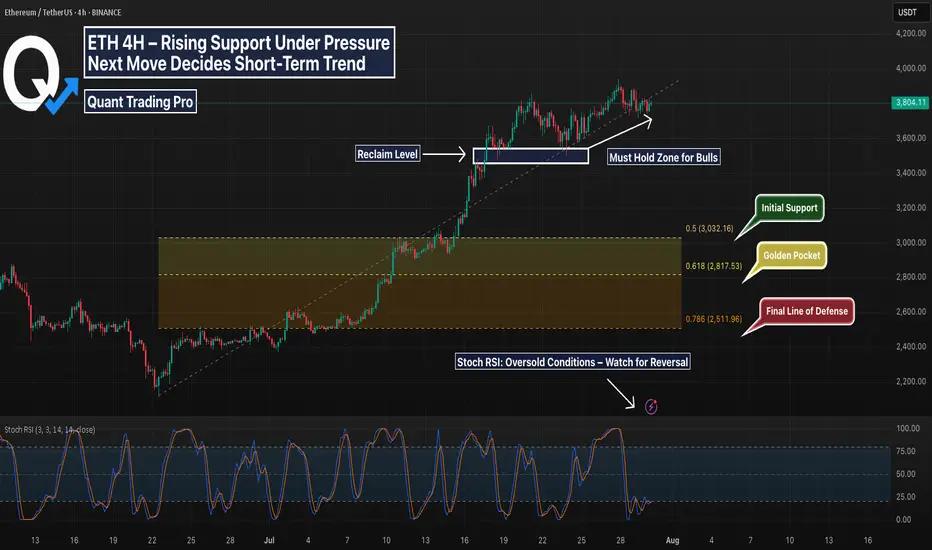
ETH 4H – Trendline Test or Trap? Golden Pocket BelowEthereum’s 4H chart shows price compressing against rising trendline support after a strong impulse move in July. While bulls have defended the key reclaim zone (white box) multiple times, momentum is fading and structure is at risk.
Price is now coiling just above the diagonal trendline — a decisive bounce here could spark continuation. However, a breakdown opens the door to deeper retracements.
Key Fib retracement levels below:
0.5 at $3,032 – Initial reaction zone
0.618 (Golden Pocket) at $2,817 – High confluence support
0.786 at $2,511 – Extreme retracement target
The Stoch RSI is deeply oversold, suggesting a bounce may be near — but confirmation is needed.
📊 Things to watch:
Reaction at trendline support
Sweep of reclaim zone followed by reclaim
Golden Pocket retest with bullish divergence
If support holds, this could be a textbook higher low. If not, expect liquidity hunts toward the fib zones. Stay nimble.
Perfect candidate for a strategy backtest or reactive plan using alerts and confirmation tools.
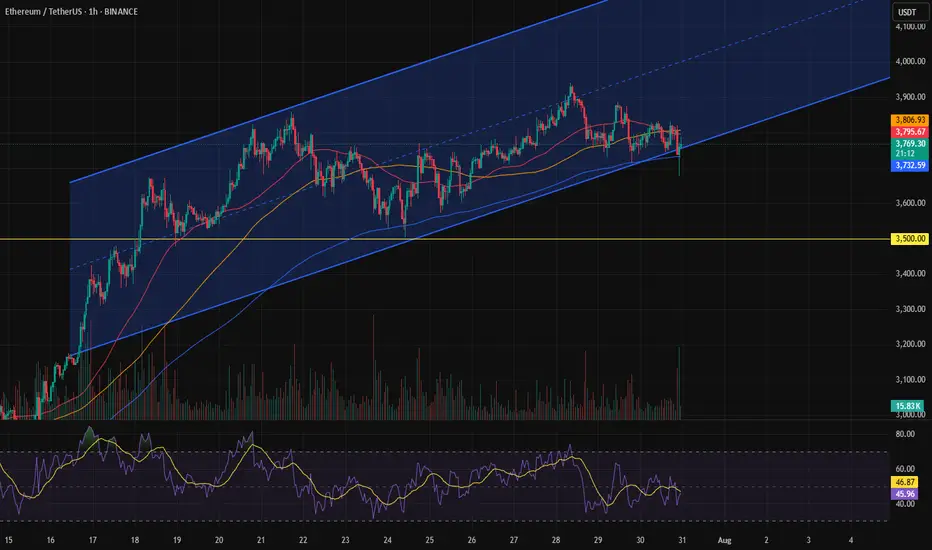
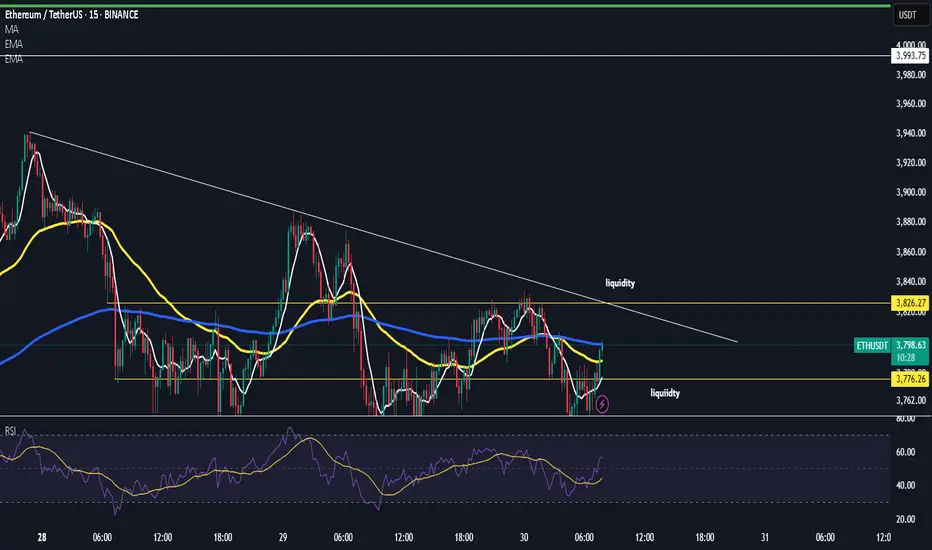
Ethereum Analysis – July 30, 2025📊 Ethereum Analysis – July 30, 2025
Ethereum is currently testing a key descending trendline (blue line).
If the price breaks above this resistance and confirms with strong candlestick closures, there's a high probability that ETH will rally toward the ascending red trendline, acting as the next dynamic resistance.
🚀 A confirmed breakout could trigger a bullish continuation, opening the door for higher targets in the short term.
However, failure to hold above this level may result in a pullback or range-bound movement.
📌 Keep both the blue and red trendlines on your chart — they’re currently the most critical zones to watch for potential entries or exits.

Ethereum (ETH): 2 Successful Trades | Targeting Now $4800Ethereum was so close to $4K that we considered it basically reading the target; now we set a new target and a new entry for us as well.
We are looking for a complete breakout to happen from the region of $4000, which then would open for us an opportunity for a bullish move towards the $4800.
Swallow Academy

Ethereum Above $4,000 Bullish Signal RevealsNo major drops and low volatility is a major bullish signal. Ether is bullish now with all sellers gone. Look at the down wave from December 2024 and see what three days red would do to Ethereum's price. Today we are on the third red day and ETH is hardly a few dollars below the most recent peak. A signal of strength. This strength also means that we are likely to see a continuation of the bullish move soon, Ether will continue growing.
Good morning my fellow Cryptocurrency trader, I hope you are having a wonderful day.
Everything seems calm now, a small pause... Sell at resistance, buy at support; right?
Well, not always. It depends on the context.
Here we have a rising trend and Ethereum has been advancing nicely. Now we reach resistance, is this the time to go SHORT? It is possible to SHORT at resistance and do good but here we have a very clear uptrend. When ETHUSDT peaked 28-July there wasn't much selling. This is telling us that the bullish move is not over, not complete.
Ethereum will produce additional growth. Seeing this, it would be unwise to sell SHORT. If prices drop, it is better to wait for support and go LONG. Trade with the trend, it reduces risk and increases your chances for success.
Namaste.
ETH - Bounce Zones - Nears the End for BULLSHello Fello's ☕
I'm watching Ethereum today and I believe it may be very close to the end of it's bullish cycle.
I think what could become likely is an extended altseason, where Bitcoin trades around the same price for some time, and Ethereum increases slightly. Afterwhich smaller altcoins (by marketcap) make random rallies before the beginning of a bearish cycle (which is due, see my previous BTC update).
There's an interesting channel here that previously determined bounce zones... I don't believe the channel itself will hold as much value going down, but this zone may be a likely bounce zone - around $3k.
Key bounce zones to watch include:
I'm not saying it will be this straightforward, but this image demonstrates the power of bounce zones for swing trades:
Next update will be when we've lost the first support zone.
Until then!