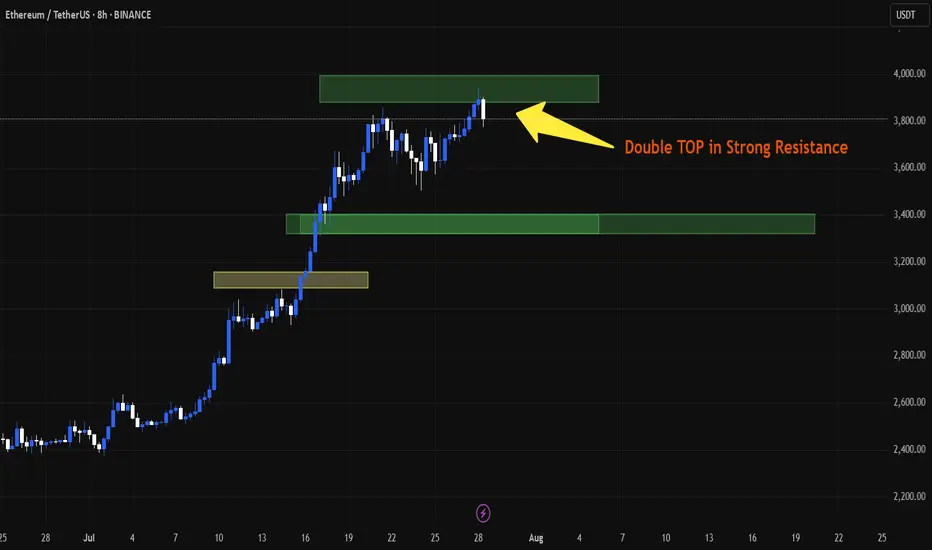
ETH may have PULL BackAs we can see, a double top has formed at around $4,000 and I guess we have a pullback to around $3,500. The new RSI is showing a pullback and strong divergence. If ETH breaks $4,000, this analysis will be rejected.
ETHUSDT.P trade ideas
ETHEREUM Long Outlook – Grand Supercycle Perspective(2025.05.21)Hello everyone,
This is SeoVereign, operator of the SeoVereign Team.
Today, I would like to share an Ethereum analysis based on the daily (1D) chart for the first time in a while.
Before reading this post, please refer to the idea I uploaded on April 18, 2025, through the link below. It will help you better understand the context:
🔗
(Clicking the image will take you to the corresponding link.)
If you look at the April 18 idea, you’ll see that I presented a bullish outlook based on the Deep Crab pattern.
This analysis is a continuation of that idea.
Through years of research, I’ve observed that when a Deep Crab pattern sees a rebound from the PRZ (Potential Reversal Zone), the trend that begins from that point tends to extend for a long time.
If you look closely at the chart, you’ll also see the 2.24 Fibonacci extension level.
Some people messaged me saying, “Since it went above 1.902 and even exceeded the 2.0 Fibonacci line, isn’t this Deep Crab invalid?”
However, I’ve studied harmonic patterns in depth for a long time and have set my own Fibonacci criteria based on that research.
In this particular Deep Crab case, I define the invalidation level as 2.24.
Therefore, I judged that the pattern is still valid, and this allowed me to forecast a long-term bullish trend.
Back to the main point,
Based on this Deep Crab pattern, I’ve consistently maintained a bullish outlook on the daily chart,
and so far, there have been no clear signals indicating a reversal into a bearish trend.
Thus, I would like to post a continuation of the bullish outlook on the daily chart.
On May 19, 2025, there was a sharp drop around the 2,587 USDT level.
At that time, our team expected the bullish trend that started from around 2,447 USDT to hold its low and continue.
However, the price broke below 2,447 USDT and made a new low.
We then closely monitored Bitcoin’s movement in response.
Typically, strong volatility occurs before a major trend begins.
Bitcoin was also showing significant volatility at the time.
So we concluded: “Let’s maintain a bullish stance, but do not be fully convinced until the previous high of 2,587 USDT is clearly broken upward.”
And by the time this post is published, we’ve confirmed that the price has indeed broken above 2,587 USDT.
Therefore, I have come to the conclusion that the bullish trend is still valid.
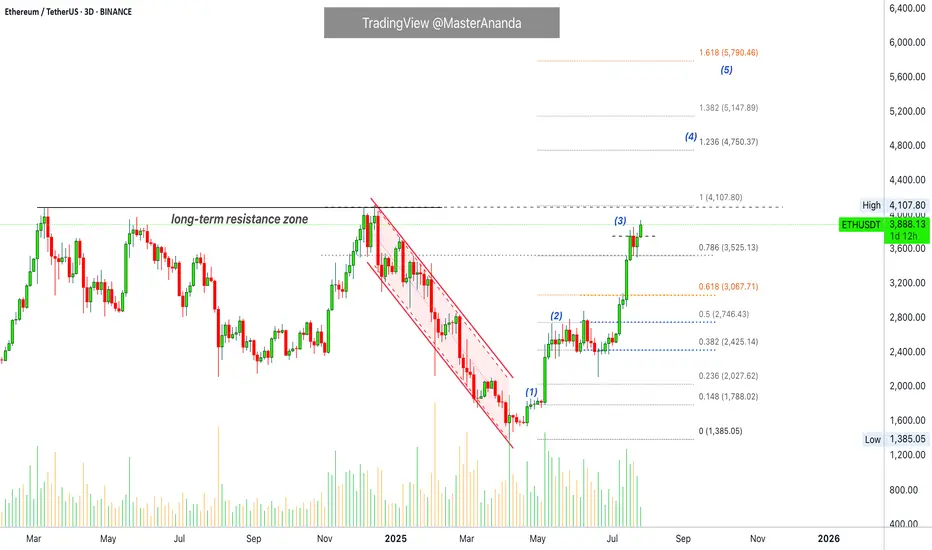
Based on this, I present the following three target levels.
🎯 SeoVereign’s Ethereum Bullish Targets
1st Target: 3,000 USDT
2nd Target: 3,400 USDT
3rd Target: 3,700 USDT
The market still shows strong volatility.
I sincerely hope you all trade wisely and calmly, achieving great returns,
and may great fortune be with you both in trading and in life.
I’ll see you again in the next daily analysis.
Thank you.
- SeoVereign

Ether Update · Accumulate, Buy & Hold · 2025 StrategyGood morning my fellow Cryptocurrency trader, I hope you are having a wonderful day.
Ethereum continues really strong and today is trading at the highest price since December 2024. Right now getting close to a long-term resistance zone that was first established in March 2024. As soon as ETHUSDT manages to break $4,100 as resistance, we can expect a major advance toward a new all-time high. Remember, sustained long-term growth, just as it is happening already. Notice the slope on the rising wave since April. It will continue just like this, prices going higher and higher until a final jump produces very high prices based on a long wick.
Market conditions have not change since our last update. Everything is extremely bullish and the chart looks even better now, the rest of the market is also looking better so the focus should be on hold and preparing a profit taking strategy. How will you profit from this trade? How do you intend to sell? How will you reduce or close your position when the time is right? You can start preparing now.
There are many ways to approach the targets but it is always wise to wait at least until a new all-time high. Since we have enough data support a new all-time high as a high probability scenario, we want to benefit as much as possible from the uptrend and thus we ignore the initial easy targets. We go for the higher targets because we are now in the 2025 bull market.
When in doubt, you don't have to be 100% right but neither 100% wrong. If you don't know how the market will behave next, instead of thinking to sell the entire position, you can sell a small portion only, say 10%. And continue like this long-term.
There are many strategies, many ways to plan and win, but for now focus on holding patiently, patience is key. Those who can wait the longer without being tempted can produce the best results. Just let it roll... The market is set to grow. Accumulation and buying now the best choice.
Namaste.
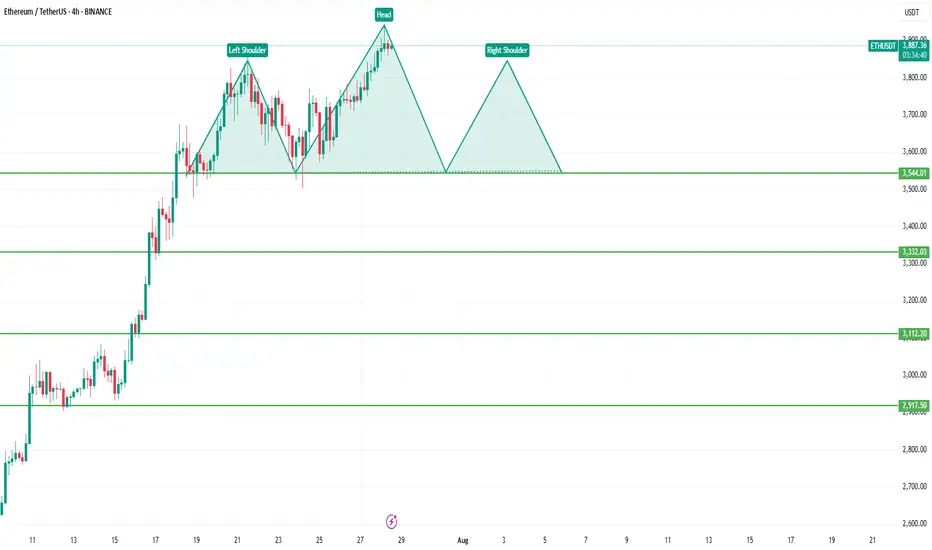
"ETH Warning Signal: Is a Bearish Breakdown Imminent?"📊 Pattern Overview: Head and Shoulders
Left Shoulder: Formed around July 24th, marked by a high near $3,800 followed by a retracement.
Head: A higher peak on July 27th, topping out near $3,888, then pulling back again.
Right Shoulder: Currently anticipated, projected to form around the same height as the left shoulder, with a potential completion near $3,800 before another decline.
Neckline: Flat support line around $3,544, acting as the crucial level that, if broken, confirms the pattern.
🧠 Interpretation
The Head and Shoulders is generally interpreted as a trend reversal pattern. In this context, Ethereum has been in a strong uptrend, but the pattern signals a potential topping out and shift toward a bearish phase.
If ETH breaks below the neckline at $3,544 with volume confirmation, it would signal that bulls are losing control, and sellers may take over.
📉 Bearish Breakdown Target
The theoretical downside target can be calculated by measuring the distance from the Head to the Neckline and projecting it downward from the neckline:
Head peak: ~$3,888
Neckline: ~$3,544
Height: ~$344
📌 Target after breakdown:
$3,544 - $344 = $3,200 (approx.), with interim support levels around:
$3,332 (horizontal support)
$3,112
$2,917
These levels might act as pause points or bounce zones if the breakdown unfolds.
🟢 Invalidation Scenario
If Ethereum invalidates the pattern by:
Breaking above the Head level ($3,888) and holding
Sustaining higher highs with strong volume
Then the bearish thesis would be invalidated, and bulls may aim for continuation toward $4,000+ levels.
🧩 Strategic Takeaways
Aggressive traders might short the neckline break at $3,544, with stops just above the right shoulder (~$3,800).
Conservative traders may wait for a retest of the neckline post-breakdown.
Risk management is key, especially in crypto markets, which are known for head fakes and false breakouts.
⏳ Final Thought
This setup doesn't guarantee a drop—it merely increases the probability of a reversal. Watch for volume on the neckline break and monitor how price reacts at key support levels.
DYOR before taking a trade
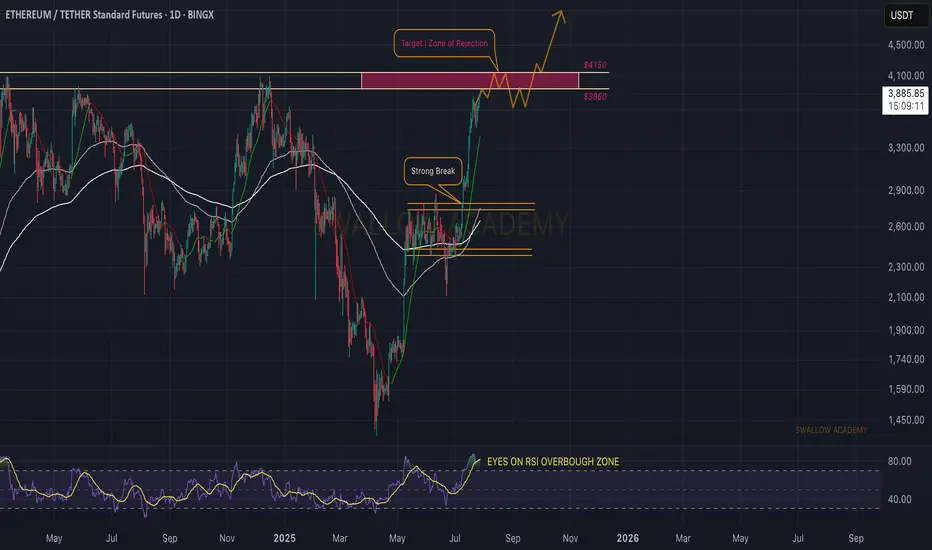
Ethereum (ETH): $4000 Incoming | Breakout or Rejection?Ethereum is not showing any remorse to sellers of the coin, and we are almost near the major resistance zone of $4000.
What we are looking for or expecting from here is either to get the proper breakout from this region or a rejection. As of now it is hard to say which one we will get so once we reach that resistance, we are going to look at further market structure development for any more signs.
Swallow Academy
EthusdNot discounting the potential for a dip into the August montly open...
Retesting the trend line break for a second time..
Then we enter etf bid war phase.. multiple companies attempting to emerge as the strategy b of ethereum.
Bitmine and sharplink are leading but there's about 10-30 companies starting to accumulate heavily..

Ethereum (ETH): Getting Closer To Our Third Target | $4000Ethereum has done really well since our entry, and we are almost at the third target. After that, we are going to expect to see the movement towards the ATH area.
As we said, money flow has to go somewhere, and as Bitcoin has had its time, now people need new projects where to get their profits from, which was of course the ETH. Still good for long, still has time to make that new ATH.
Swallow Academy

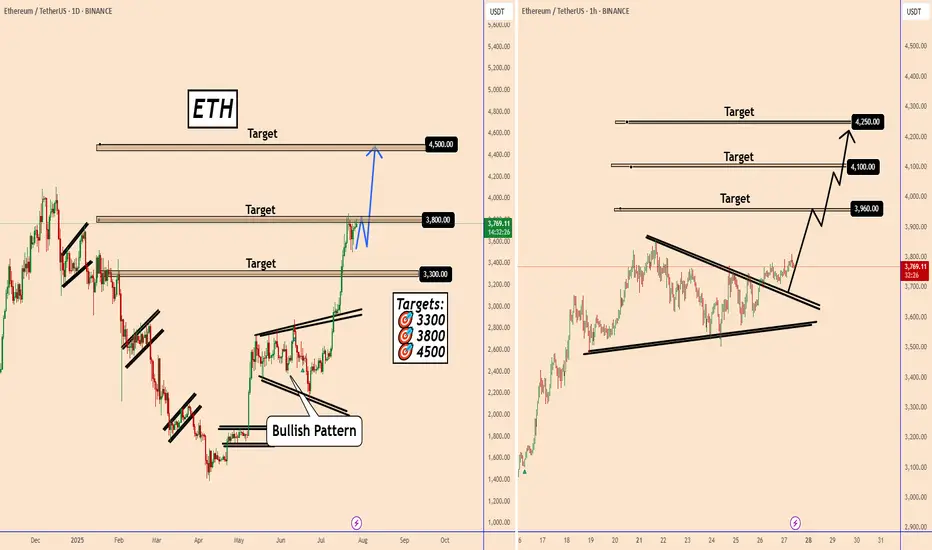
Ethereum: Multiple Time Frame AnalysisEthereum: Multiple Time Frame Analysis
From the chart, we can see that Ethereum is in a clear uptrend on all timeframes.
The daily chart is bullish and is not yet showing signs of a reversal on the May timeframe.
Yesterday, ETH also confirmed an ascending triangle pattern on a lower timeframe, indicating potential upside as shown in the chart.
Key target areas: 3960; 4100 and 4250
You may find more details in the chart!
Thank you and Good Luck!
PS: Please support with a like or comment if you find this analysis useful for your trading day
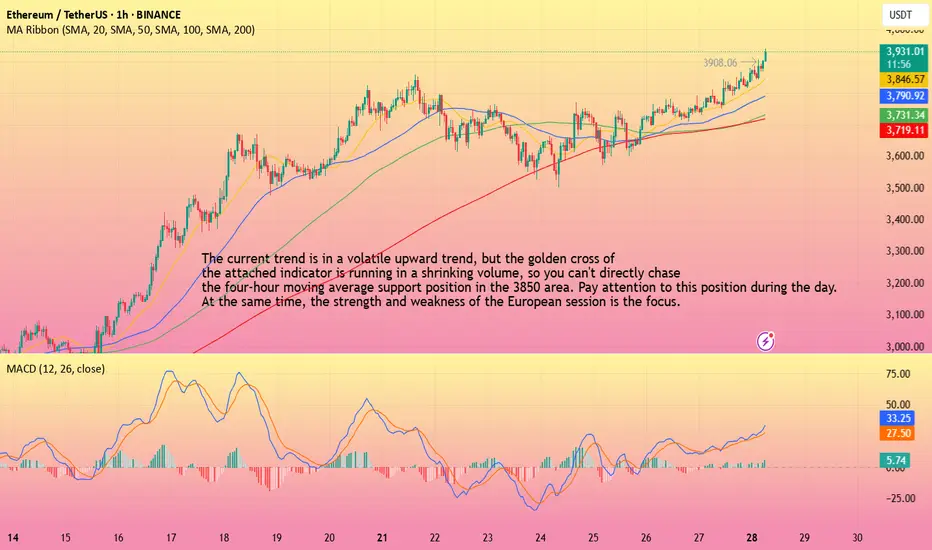
ETH-----Buy around 3850, target 3930 areaTechnical analysis of ETH contract on July 28:
Today, the large-cycle daily level closed with a small positive line yesterday, the K-line pattern continued to rise, the price was above the moving average, and the attached indicator was running in a golden cross. The general trend of rising is still very obvious. The current price has deviated from the moving average and returned to the moving average support position near the 3775 area, so you still need to pay attention to the risk trend of retracement in trading. The overall trend of the short-cycle hourly chart is in a volatile upward trend, but the price is relying on the support of the MA5 and MA10 daily moving averages to rise, and the general trend of rising is relatively obvious, so you still need to find obvious signals to enter the market during the day. The current four-hour moving average support position is near the 3850 area, and the hourly chart continues to fall.
Today's ETH short-term contract trading strategy:
Purchase at the 3850 area when retreating, stop loss at the 3820 area, and target the 3930 area;
ETH/USDT (Monthly) – Symmetrical Triangle BreakoutPattern & Technical Setup
Ethereum (ETH/USDT) is showing a textbook symmetrical triangle pattern on the monthly chart. The pattern has been developing since the 2021 high, with lower highs converging with higher lows.
The current candle has broken out above the triangle’s upper trendline, suggesting a potential bullish continuation. This breakout is significant given the long consolidation period and strong volume profile near the breakout zone.
Trade Plan
• Entry: Around $4000 on confirmed monthly close above triangle.
• Stop Loss: Below $3,500 (safe side under breakout + previous support).
• Profit Targets:
$4,800 (measured move target based on triangle height)
⸻
Risk & Reward
• Risk: ~17% downside (stop at $2,950)
• Reward: ~253% upside to $4,800
• R/R Ratio: ~14:1 (favorable for swing trade)

ETH Buy Idea📈 Setup Summary:
Ethereum (ETHUSD) is breaking out of a multi-week consolidation with rising volume and strong bullish momentum. Price has reclaimed key moving averages, and sentiment has shifted favorably across crypto markets.
📊 Entry & Risk:
• Entry Price: $3,860 - 3870
• Stop: $3,470
🧠 Macro Catalyst: Spot ETH ETFs Are Coming
• The SEC is reviewing multiple Ethereum Spot ETF applications from BlackRock, VanEck, ARK/21Shares, and others.
• Market expects approvals Q3–Q4 2025, mirroring the prior surge seen in BTC after IBIT and similar ETFs launched.
• A successful launch could unlock institutional ETH flows, driving significant upside.
🟢 Adding ETF tailwind to technical breakout = high-conviction swing trade.
🚀 Momentum Signals:
• RSI & MACD bullish cross on daily
• Increasing volume on breakout
• ETH outperforming BTC (ETHBTC ratio turning up)
• Crypto market as a whole showing risk-on tone
DISCLAIMER : The content and materials featured are for your information and education only and are not attended to address your particular personal requirements. The information does not constitute financial advice or recommendation and should not be considered as such. Risk Management is Your Shield! Always prioritise risk management. It’s your best defence against losses.
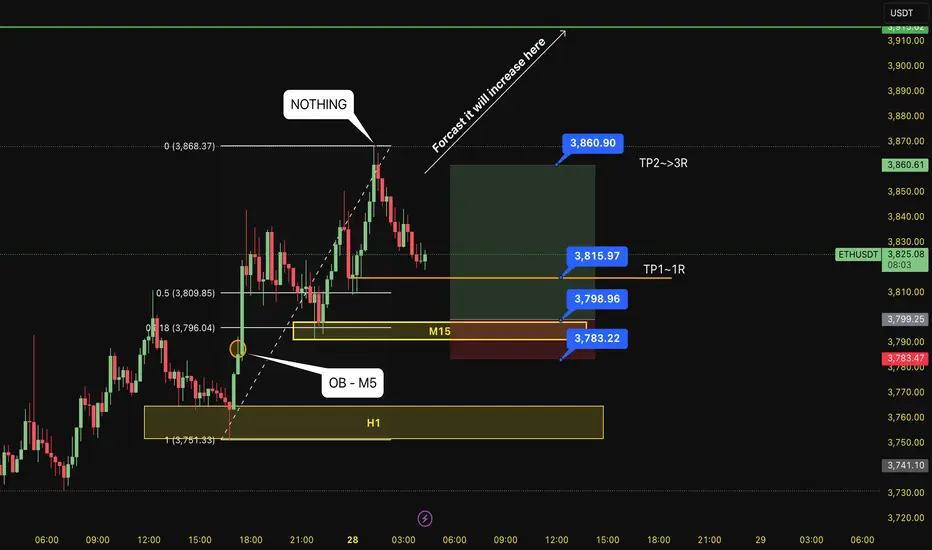
BUY ETH 28.7.2025Confluence order: BUY at M15
Type of order: Limit order
Reason:
- The current top is not touching anything, expected to rise to the H1 above.
- M15~FIBO 0,5-0,618 (same position)
Note:
- Management of money carefully at the last bottom (3,815)
Set up entry:
- Entry buy at 3,798
- SL at 3,783 (below OB NOT USED of M5)
- TP1: 3,815 (~1R)
- TP2: 3,860
Trading Method: Price action (No indicator, only trend and candles)
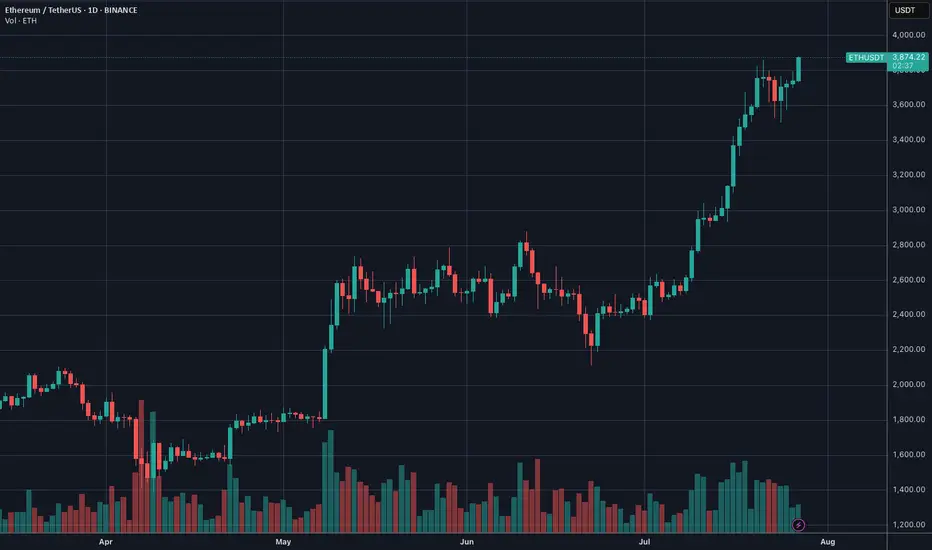
ETH/USDT 4H Chart📊 General Context
Ethereum is rising in a strong short-term uptrend, supported by a rising trendline (orange).
Current price: 3831 USDT
We are approaching a significant resistance level around 3842–3850 USDT (green line).
Technical support is located around 3760 USDT (previous consolidation level and 50/200 SMA).
🔍 Technical Levels
Resistance:
3842–3850 USDT – local high, currently being tested.
4006 USDT – key psychological level and the last local high on the chart.
Support:
3762 USDT – previous resistance, currently turned into support (may be tested in a correction).
3650 USDT – strong technical support, confirmed several times in the past.
SMA50 and SMA200 – currently just below the price, also acting as dynamic support.
📈 Technical Indicators
MACD:
The histogram is rising and positive → bullish momentum.
The MACD line crosses the signal line from below → a buy signal.
RSI (14):
Currently: around 64 → not yet overbought, but close to the overbought zone.
Slightly rising trend, but may suggest impending market overheating with further gains.
🧭 Trend
Short-term: strong uptrend (trend line, green candles, breakout from consolidation).
Medium-term: higher lows and higher highs – the uptrend is maintained.
The price is holding above the 50 and 200 SMAs – confirming bullish sentiment.
⚠️ What to watch next?
A 4-hour candle close above 3842 USDT → confirmation of a breakout, a potential attack on 4000–4010 USDT.
A break of the trend line (orange) → a possible correction to 3760 or even 3650 USDT is possible.
An RSI rise above 70 → an overbought signal, a possible pullback or consolidation.

You thinking of buying ETH ? read this first
There is a saying- "Charts NEVER lie"
And here it is
ETH USDT Weekly chart, suggesting that, right now, ETH is up against resistance that has rejected it more times than it has been support.
The RSI on this chart also suggests a pull back is coming
Again, RSI has been rejected in this range more times than it found support
Conclusion -WAIT before you buy and see if it crosses that line of resistance and tests it as support before you spend your money
Just saying

ETHUSDT Classic Cup PatternEthereum is forming a textbook Cup pattern on the 1H chart, signaling a strong bullish setup. After a rounded bottom forming the “cup,” ETH is now pushing toward the neckline resistance around $3,870. A confirmed breakout above this level could lead to a powerful upward move.
Cheers
Hexa

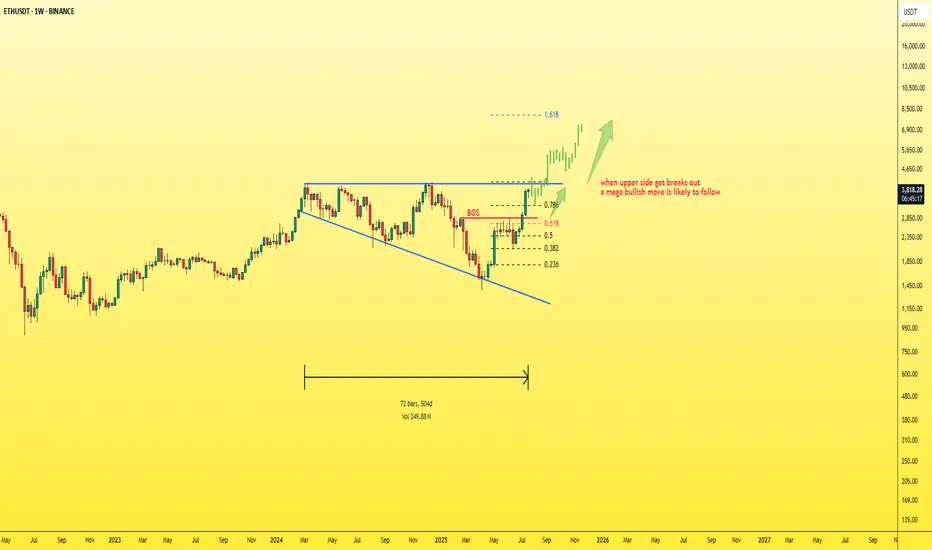
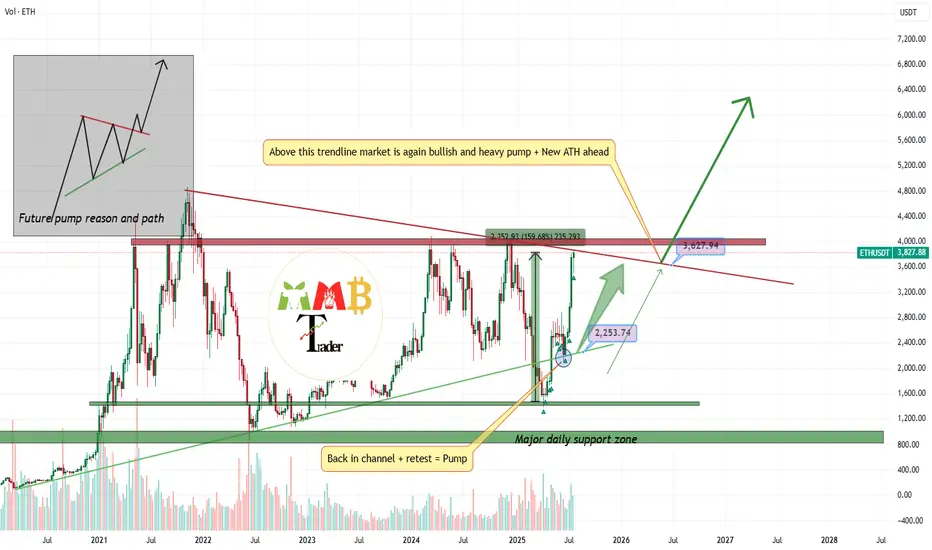
ETH - simple chart and mega moveEthereum is currently the strongest and most stable asset in the market, especially after many had lost hope in it.
Now, Ethereum is back with strength, and it’s just a few steps away from breaking out of the current pattern.
📈A breakout above the upper boundary will likely lead to a new all-time high (ATH) for ETH.
My projection: Ethereum could surpass $7,000 before the end of 2025.
Best regards:
Ceciliones🎯
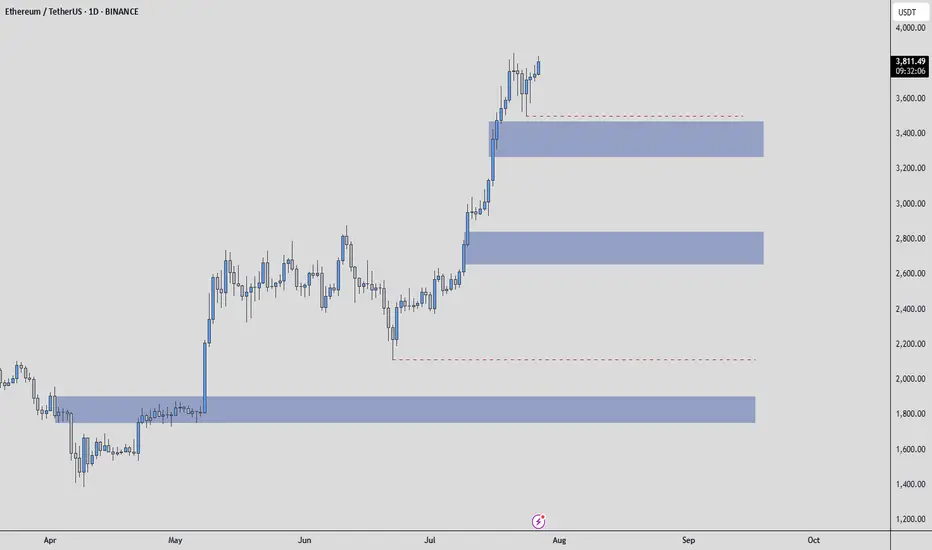
Ethereum - Possible Zones / How to use them ? Hello everyone, and special greetings to my dear friends who follow me, I hope you're happy that I helped you buy Ethereum at $2200.
Let's get to today's situation. There are many areas for Ethereum. The first blue box is the one I'd want to be the first buyer in.
I might want to be a buyer in the other blue boxes as well, but there will be increases even before these areas are reached.
I think the bottom blue box could be the one in the event of a Q3 correction.
What is a Q3 correction? All risk-on markets typically experience significant corrections in the third quarter of the year and struggle to recover from this correction until the end of the year.
The first blue box would be the first area I'd want to be in for any increases leading up to this correction.
HOW DO I GET INVOLVED!! THIS IS IMPORTANT BECAUSE SOME OF YOU LOSE MONEY WHEN BLUE BOXES ARE PULLED AWAY. THIS SHOULD NOT HAPPEN!!
When the price reaches the blue box, the transition is made to the 1-hour timeframe. Here, an upward breakout is sought, and during this breakout, the CDV is expected to be positive and rising. If these conditions are met, then RISK is taken. However, the entire amount of money isn't spent; it simply means that the conditions necessary to spend one bullet are met. One bullet is an amount that won't upset you too much; this varies for everyone.
I hope you use this analysis beneficially and profitably, because I want you to make a lot of money. Best wishes to you all, UmutTrades.
$ETH Mid-TermLooking at Ethereum from a mid-term perspective, it’s currently sitting near its price ceiling, suggesting a potential need for a correction. Of course, it’s also possible that this level could be broken, depending on overall market conditions. However, the primary scenario is that it fails to break through and pulls back, with the potential reversal zone identified based on Fibonacci levels. On the other hand, the 55 EMA is also providing solid support.
If Ethereum manages to break above this resistance, then we'll wait for either a confirmation or a pullback before entering a long position

ETHUSDT market is ready to explode and PumpAs we mentioned before Price is now near weekly resistance and range and even short-term fall here is expected but this time i am looking for breakout to the upside and huge pump after that like the green arrows on chart.
So get ready and wait for that breakout and next phase of bull run to start soon.
DISCLAIMER: ((trade based on your own decision))
<<press like👍 if you enjoy💚
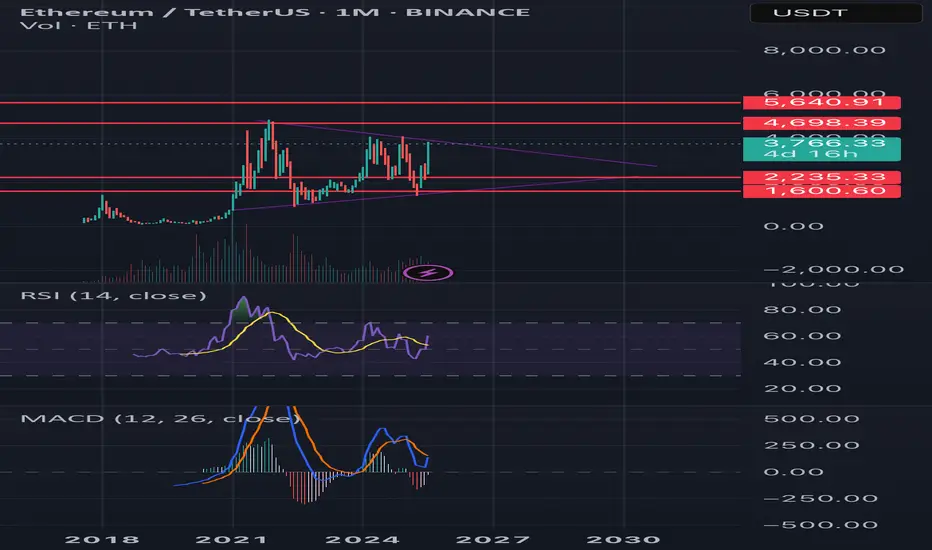
Ethereum monthly analysis Price Action & Structure:
• Ethereum is forming a symmetrical triangle, indicating a potential breakout or breakdown in the coming months.
• Key resistance levels:
• $4,698 (mid-term resistance)
• $5,640 (all-time high area)
• Key support levels:
• $2,235
• $1,600
Indicators:
• RSI (14): Currently around 50, showing neutral momentum but slightly recovering. No overbought or oversold condition.
• MACD (12,26): The blue line is attempting to cross above the orange line, a possible early bullish crossover. Histogram shows weakening bearish momentum.
• Volume: Decreasing volume inside the triangle pattern, typical before a breakout.
Outlook:
• A breakout above $4,698 with volume could target the $5,640 zone.
• A breakdown below $2,235 would open the door toward $1,600 or lower.
• Wait for a confirmed breakout from the triangle before major entries.
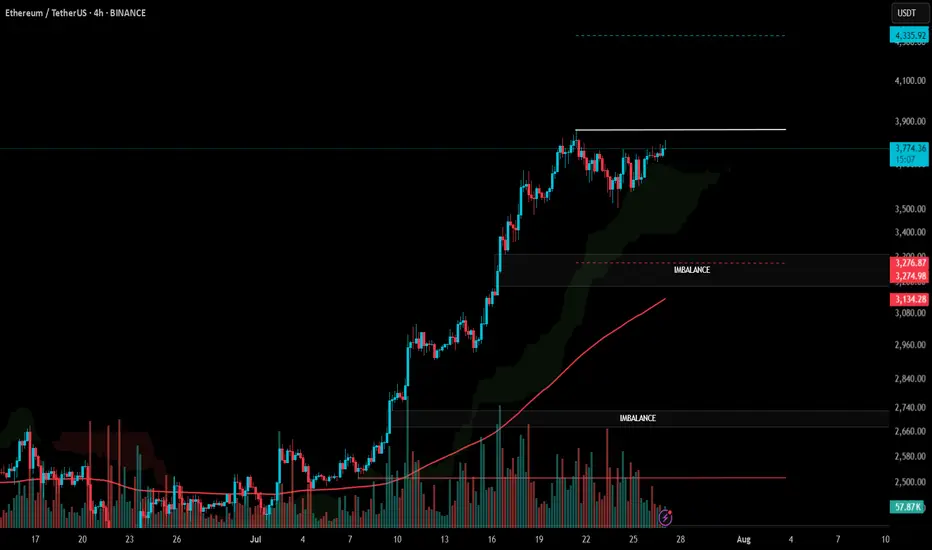
#ETH Update #5 – July 27, 2025#ETH Update #5 – July 27, 2025
Ethereum is attempting to revisit the levels of its previous impulsive move without having completed a proper correction. The fact that Ethereum has not made a retracement around 3280 and is instead pushing toward a new ATH does not seem very healthy to me. If it had completed the correction, it would have also balanced an existing imbalance in the structure.
When we look at the recent candles, we observe a lack of volume. This volume weakness is not sufficient to break the resistance at the previous high. If Ethereum breaks the 3900 dollar resistance level with a strong candle, it could move toward the 4335 dollar zone.
However, it should not be forgotten that there is still an imbalance and a correction zone around 3280 dollars. If the price decides to return to that level, it would mean an approximately 15% pullback from here. This could pose significant risk for altcoins, and we might see corrections of up to 40% in some.
Ethereum is currently one of the riskier assets for either taking a long or short position. Therefore, I do not recommend opening any position at this stage.
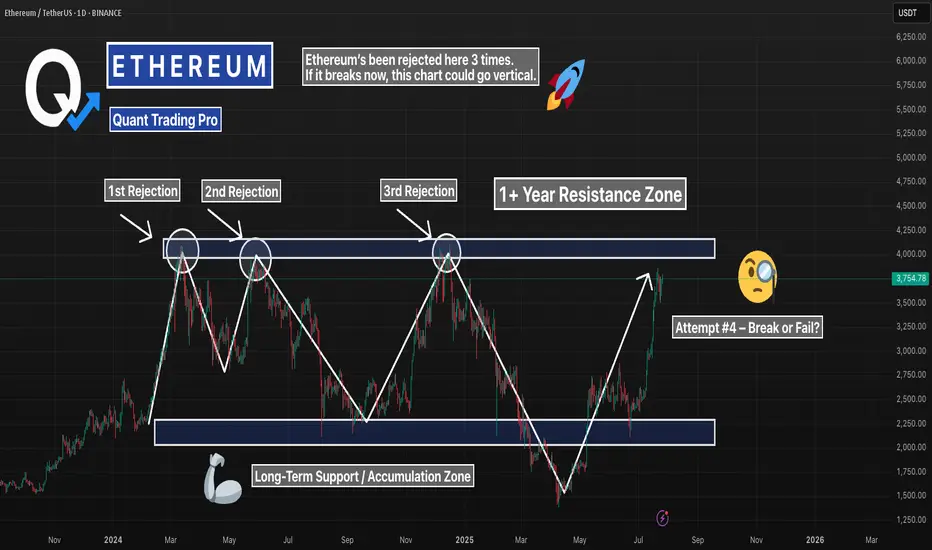
ETH Daily – Triple Rejection Zone Back in PlayEthereum’s pushing back into one of the most important resistance zones on the chart — the same level that’s caused three major rejections in the past year.
Now we’re testing it again, but this time momentum’s different. Daily structure is stronger, volume’s climbing, and bulls are showing no hesitation.
Here’s what matters:
– Triple top? If rejected again, this zone holds the trend hostage
– Break + retest? That’s the setup bulls have been waiting for
– Either way, this is a high-stakes level — and price won’t stay here long
Eyes on ETH. This zone will decide the next leg.
#ETH #Ethereum #TripleTop #ResistanceTest #CryptoTrading #DailyChart #TechnicalAnalysis #QuantTradingPro
ETHUSDT Short Trade IdeaShort ETHUSDT at $3,745.22 with a target of $3,561.34.
Reason for Short: The 4-hour chart shows a symmetrical triangle pattern with resistance around $3,745-$3,800. The price is testing this upper trendline, and a recent bearish candle suggests potential rejection. The DEMA at $3,747.75 indicates overextension, supporting a pullback.
What I See: Heavy sell pressure is forming near $3,745, with the triangle nearing a breakout/breakdown point. Support lies around $3,561, aligning with prior lows.
Stop Loss: Set at $3,802, above the recent high and triangle resistance, to avoid a bullish breakout.
Trade Rationale: A breakdown from the triangle with volume confirmation could drive the price to $3,561. The tight stop above resistance minimizes risk while targeting a key support level.
