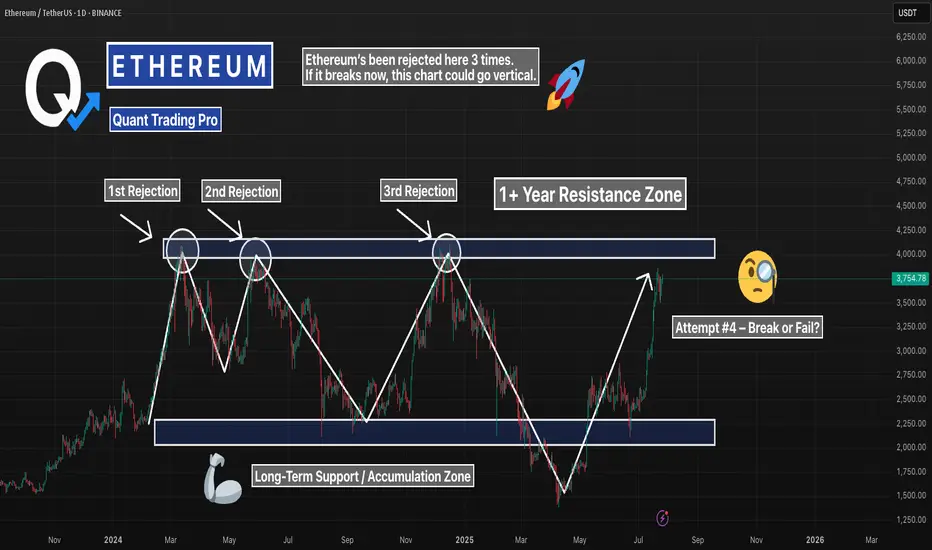
ETH Daily – Triple Rejection Zone Back in PlayEthereum’s pushing back into one of the most important resistance zones on the chart — the same level that’s caused three major rejections in the past year.
Now we’re testing it again, but this time momentum’s different. Daily structure is stronger, volume’s climbing, and bulls are showing no hesitation.
Here’s what matters:
– Triple top? If rejected again, this zone holds the trend hostage
– Break + retest? That’s the setup bulls have been waiting for
– Either way, this is a high-stakes level — and price won’t stay here long
Eyes on ETH. This zone will decide the next leg.
#ETH #Ethereum #TripleTop #ResistanceTest #CryptoTrading #DailyChart #TechnicalAnalysis #QuantTradingPro
ETHUSDT.P trade ideas
ETHUSDT Short Trade IdeaShort ETHUSDT at $3,745.22 with a target of $3,561.34.
Reason for Short: The 4-hour chart shows a symmetrical triangle pattern with resistance around $3,745-$3,800. The price is testing this upper trendline, and a recent bearish candle suggests potential rejection. The DEMA at $3,747.75 indicates overextension, supporting a pullback.
What I See: Heavy sell pressure is forming near $3,745, with the triangle nearing a breakout/breakdown point. Support lies around $3,561, aligning with prior lows.
Stop Loss: Set at $3,802, above the recent high and triangle resistance, to avoid a bullish breakout.
Trade Rationale: A breakdown from the triangle with volume confirmation could drive the price to $3,561. The tight stop above resistance minimizes risk while targeting a key support level.

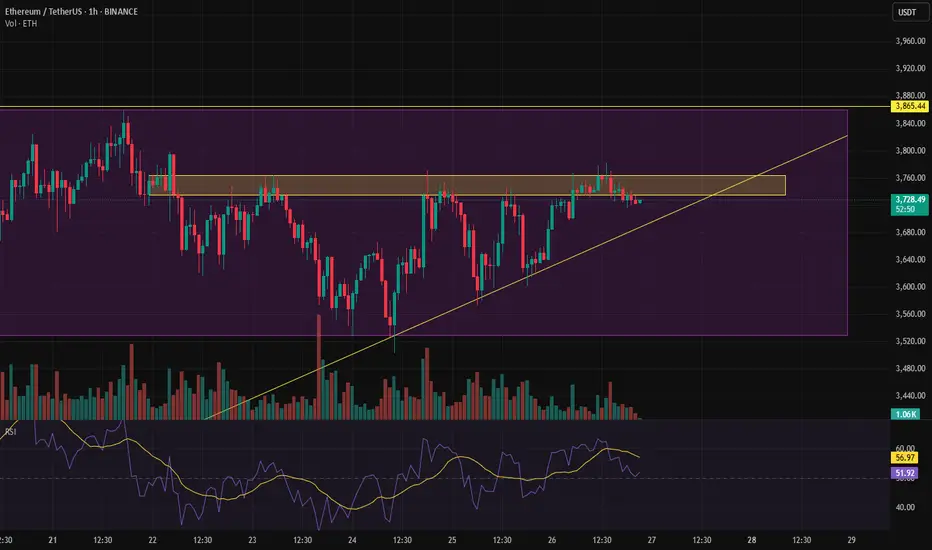
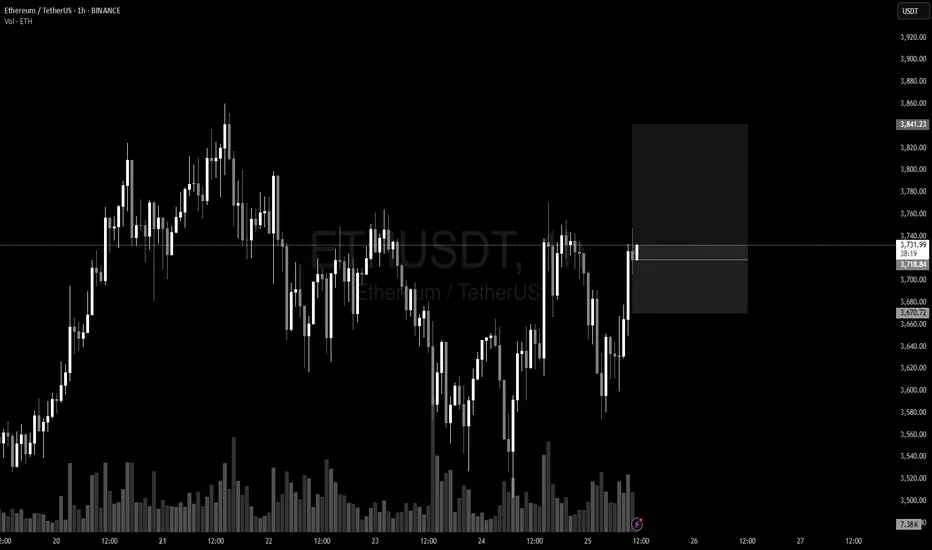
Very low volumeLow volume before momentum — something’s cooking. Let’s see if it breaks up or down. 🔍📉📈

Ethereum (ETH) AnalysisEthereum (ETH), the second-largest cryptocurrency by market capitalization, continues to be a pivotal asset in the digital economy, driving the decentralized finance (DeFi), NFT, and Web3 ecosystems. Its price action is influenced by a combination of its own fundamental developments, the broader cryptocurrency market sentiment (primarily Bitcoin's movements), and macroeconomic factors.
1. Fundamental Strengths & Developments:
Ecosystem Growth: Ethereum boasts the largest and most vibrant ecosystem of decentralized applications (dApps). The majority of DeFi protocols, NFT marketplaces, and Web3 infrastructure are built on or heavily integrated with Ethereum. This network effect provides strong underlying demand for ETH as gas fees and collateral.
Scalability Progress (Ethereum 2.0 / Serenity): The ongoing transition to Ethereum 2.0 (now largely referred to as "Serenity" or simply "The Merge" and subsequent upgrades) is a critical long-term bullish factor.
The Merge (completed): The successful transition to Proof-of-Stake (PoS) in September 2022 drastically reduced Ethereum's energy consumption and introduced ETH staking rewards, making it a more environmentally friendly and yield-generating asset.
Shanghai/Capella Upgrade (completed): This enabled staked ETH withdrawals, reducing a major liquidity concern for stakers and attracting more participation in the staking mechanism.
Upcoming Upgrades (e.g., Danksharding, Proto-Danksharding): Future upgrades are focused on increasing scalability and throughput through sharding, which is crucial for lowering transaction costs (gas fees) and enhancing network capacity. Progress on these fronts generally bodes well for ETH's long-term value.
Deflationary Mechanism: EIP-1559, implemented in August 2021, introduced a mechanism to burn a portion of transaction fees. Coupled with staking, this can lead to a net deflationary supply of ETH during periods of high network activity, reducing circulating supply and potentially increasing value.
2. Price Action and Technical Considerations (General Outlook):
Correlation with Bitcoin (BTC): ETH's price often highly correlates with Bitcoin. A strong bullish trend in BTC typically pulls ETH higher, while a significant BTC correction usually leads to ETH declines. Observing BTC's technical structure (support, resistance, momentum) is crucial for predicting ETH's near-term movements.
Key Price Levels:
Support: Historically significant support levels often exist around previous highs or strong accumulation zones. These levels act as price floors where buying interest tends to emerge.
Resistance: Previous all-time highs or significant resistance zones (where selling pressure has historically been strong) act as ceilings. A decisive break above these levels, especially with high volume, can signal a continuation of an uptrend.
Market Cycles: Cryptocurrencies are highly cyclical. After periods of rapid price appreciation, consolidation or correction phases are common. These periods allow the market to digest gains, reset funding rates, and build new bases for future moves.
3. Macroeconomic and Regulatory Factors:
Interest Rates and Inflation: Higher interest rates and tighter monetary policies from central banks can reduce liquidity in financial markets, impacting risk assets like cryptocurrencies. Conversely, a more dovish stance can be supportive.
Regulatory Environment: Clarity or uncertainty from regulators (e.g., SEC in the US, MiCA in Europe) can significantly influence institutional adoption and overall market sentiment. Positive regulatory developments can instill confidence, while restrictive measures can cause FUD (Fear, Uncertainty, Doubt).
Global Economic Health: A robust global economy generally fosters a risk-on environment, which is favorable for crypto. Economic slowdowns or recessions can lead to risk aversion.
Outlook:
Ethereum remains a strong long-term investment given its foundational role in the decentralized web and its continuous technological advancements. The successful transition to PoS and ongoing scalability efforts are critical drivers.
Bullish Scenario: If the broader crypto market remains strong, Bitcoin maintains its uptrend, and Ethereum continues to deliver on its roadmap (e.g., successful sharding implementations), ETH could target new all-time highs. Increased institutional interest, ETF approvals (for ETH directly or indirectly), and sustained DeFi/NFT activity would further fuel this.
Bearish Scenario: Significant macroeconomic headwinds, a prolonged downturn in Bitcoin's price, major regulatory crackdowns, or unforeseen technical issues with Ethereum's upgrades could lead to a correction.
Conclusion:
Ethereum's value proposition is robust due to its vibrant ecosystem and relentless development. While short-term price movements will be influenced by market sentiment and macroeconomic factors, its long-term trajectory appears promising as it continues to solidify its position as the backbone of the decentralized future. Investors should closely monitor Bitcoin's price action, Ethereum's development milestones, and broader economic indicators.
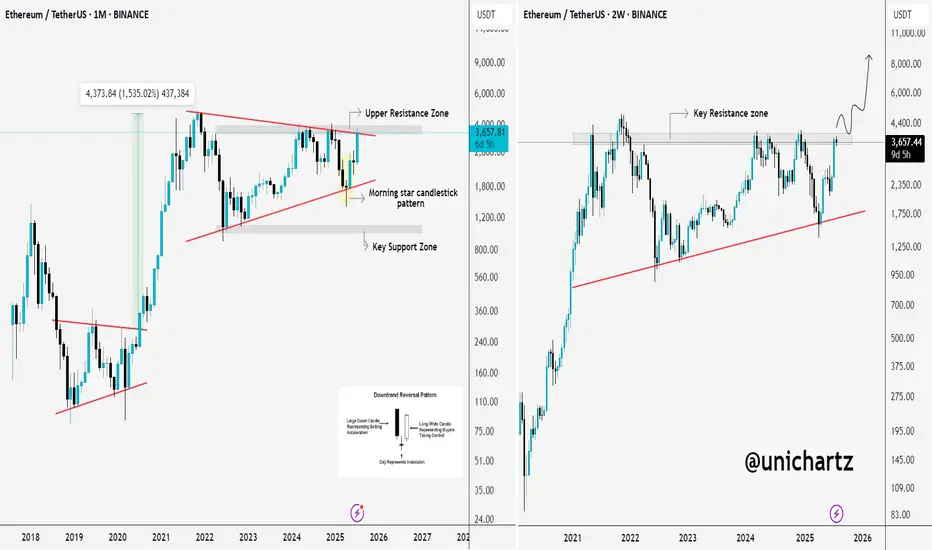
Ethereum Charts Aligning for a Major BreakoutI analyzed Ethereum on both the monthly and 2-week timeframes, and the structure looks strong.
On the right side, we have the monthly chart, where ETH has printed a bullish Morning Star pattern right off the key support trendline.
This is a classic reversal signal, and price is now approaching the upper resistance zone. A breakout from here could trigger a major rally, similar to what we saw in 2020.
On the left side, the 2-week chart shows CRYPTOCAP:ETH pressing into a critical resistance zone after a strong bounce. If price breaks and holds above this zone, it could open the doors to $6K–$8K targets in the coming months.
ETH is showing strength, now we wait for confirmation from the breakout.
Thanks for reading!
ETH/USDT: Bearish Reversal After Hitting the Decision PointHello guys!
After a strong rally, ETH finally hit the Decision Point (DP) zone marked above. Like what I said:
And we’ve already seen signs of rejection from that level.
🔹 The ascending trendline is broken
🔹 A key support got engulfed
🔹 Price is now forming a bearish structure
The target zone is mapped out around $3,500 – $3,470, where previous demand sits.
We might see a small pullback before continuation, but overall momentum is shifting downward.
Wait for confirmations and protect your capital

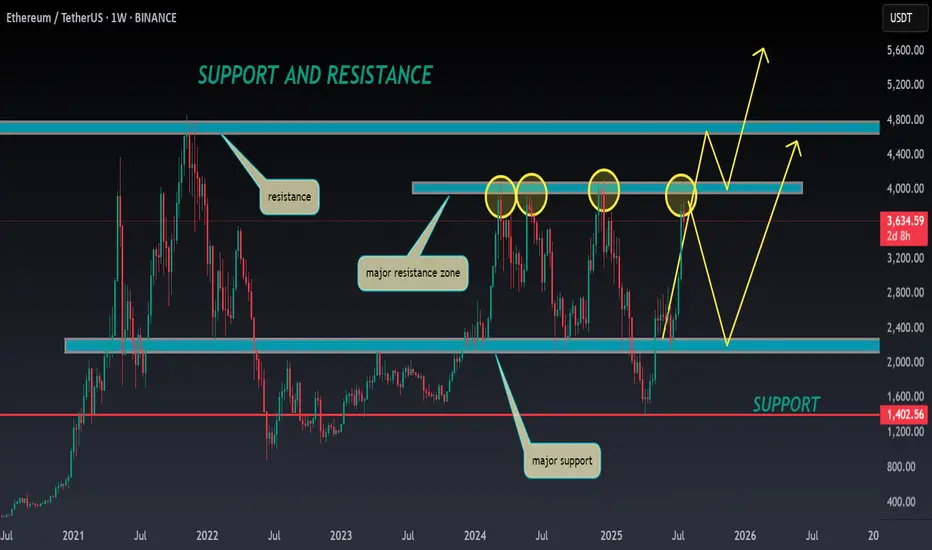
ETH ANALYSIS🔮 #ETH Analysis 🚀🚀
💲💲 #ETH is trading between support and resistance area. There is a potential rejection again from its resistance zone and pullback from support zone. If #ETH breaks the major resistance zone then we would see a bullish move
💸Current Price -- $3634
⁉️ What to do?
- We have marked crucial levels in the chart . We can trade according to the chart and make some profits. 🚀💸
#ETH #Cryptocurrency #DYOR
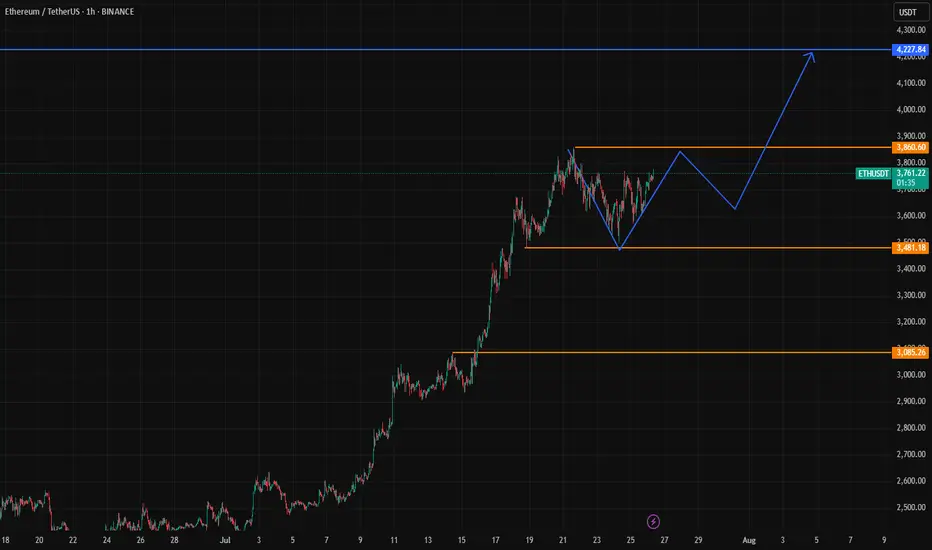
Ethereum is likely to retrace before continuing its bullish moveEthereum's technicals are highly bullish, supported by strong fundamentals. According to the market structure, it may retrace to the level shown in the chart above to collect liquidity and fill orders before moving forward to All time high near 4800.

Ethereum will retest the $3,500 level ┆ HolderStatOKX:ETHUSDT is trending upward with $3,100 as the next resistance. Breakout aims for $3,250. $2,875 remains critical support. Bullish momentum intact.

Ethereum Analysis + Market Overview 🚀 Ethereum Analysis + Market Overview 🚀
Before diving into Ethereum, let’s quickly review the overall market conditions 👇👇👇
(For a more detailed market analysis, you can check my previous post, I’ll link it below.)
---
🔹 Analysis style:
Reviewing previous highs/lows breakouts in the mid-term (MWC - 4H).
Entries based on momentum & volume.
---
♦️ USDT.D
Support: 4.22
Max expected correction: 4.51
If 4.51 breaks upward, this could push us toward short positions.
---
♦️ BTC.D
Yesterday’s levels & analysis still remain valid.
Remember, on HWC (1D), after the recent downtrend, there’s only been one bullish candle.
For altcoins to rally: BTC.D must drop below 61.6 → 60.83 → 60.42.
Otherwise, if BTC.D grows (bearish for alts), 62.17 is the key resistance to watch.
---
♦️ TOTAL (Crypto Market Cap)
Must break 3.91 to confirm a bullish trend.
Early signal: 3.85 (1H timeframe).
---
♦️ TOTAL2 (Altcoin Market Cap)
Early bullish signal: 1.48
Confirmation level: 1.55
---
♦️ ETH (Ethereum)
Ethereum has shown strong support around 3500, despite the 48-hour drop, which reflects solid buying activity.
Additionally, positive whale news is increasing.
Early & risky trigger: 3653 (1H) – already broken.
Next potential entries:
3750 (1H)
3833 (4H)
Preferred entry: 3750, as it allows a tighter & safer stop-loss.
Beware: Fake breakout probability around 3833 is high.
Stop-loss for all 3 levels: 3455.
---
🔸 Entry Strategy:
If volume & momentum increase → place a stop-buy order on the exchange.
If volume is weak → wait for confirmed breakout above 3750.
---
♦️ ETH.D
The chart is fully bullish.
If ETH hits 3750, an early long position could be taken.
---
💎 Follow me & hit 🚀 for more real-time updates and setups!
---

ETH/USDT – Altseason Confirmation in Sight?Ethereum's recent breakout at 1900$ is showing strong momentum and may be signaling the long-awaited start of altseason. A daily close above the red resistance box will act as a key confirmation of this shift and could trigger a parabolic move across many altcoins.
For ETH, the next upside targets are:
$3,500
$4,000
$4,700
Stay alert — a confirmed breakout here could light the fuse for the broader altcoin market.
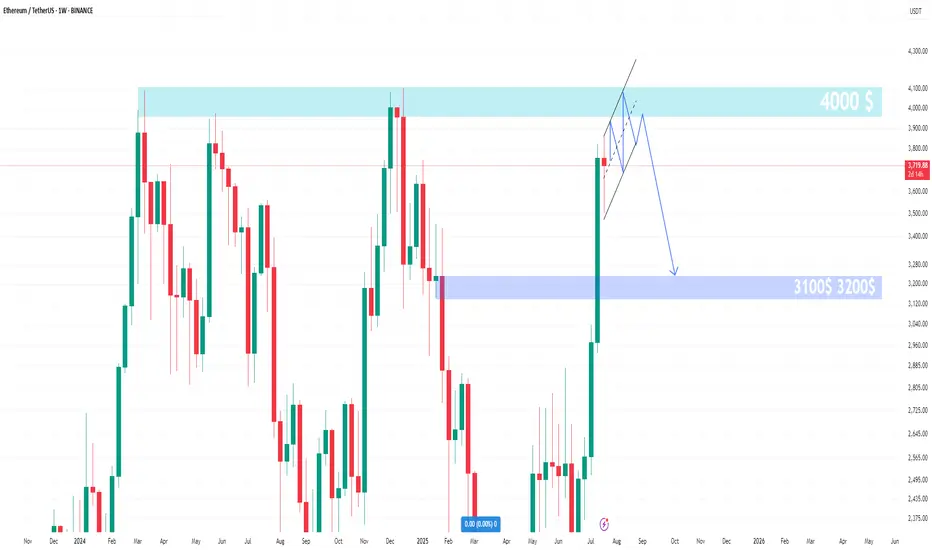
Ethereum’s $4,000 Target Alive as Historic Rally Signs EmergeBINANCE:ETHUSDT is currently trading at $3,680, just 9% away from the critical $4,000 resistance that many investors have been waiting for over the past seven months. The altcoin is expected to continue its upward momentum despite the recent consolidation, with the potential to breach the $4,000 mark soon.
Looking at broader technical indicators, the NUPL (Net Unrealized Profit/Loss) suggests that BINANCE:ETHUSDT is poised for a significant rally . The NUPL indicator, when reaching a threshold of 0.5, traditionally signals a pause in the uptrend, followed by a sharp rally.
$ BINANCE:ETHUSDT is currently nearing this threshold , which, in the past, has marked the beginning of powerful upward price action.
As long as BINANCE:ETHUSDT remains above its key support levels, the price is likely to surge toward $4,000 . If Ethereum can maintain its momentum, a breach of $4,000 could act as a catalyst for further gains.
However, should unforeseen selling pressure arise, $BINANCE:ETHUSDTprice could slip below the $3,530 support level. In such a scenario, Ethereum may fall to $3,131, invalidating the current bullish outlook. The key will be maintaining support and capitalizing on the retail-driven surge.

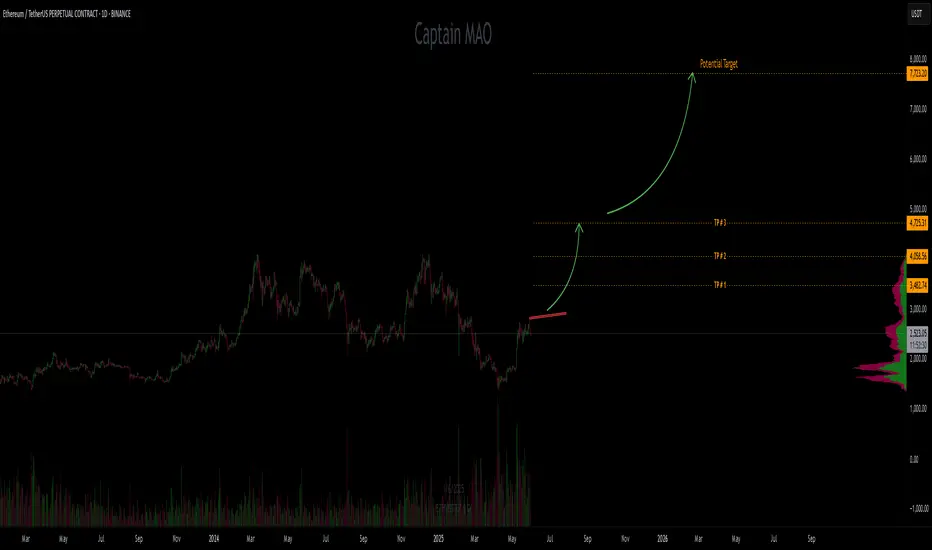
ETH-USDT Close to the supply areaI think Ethereum can grow to the $4,000 range. Then it will enter a good correction. What do you think? 😊
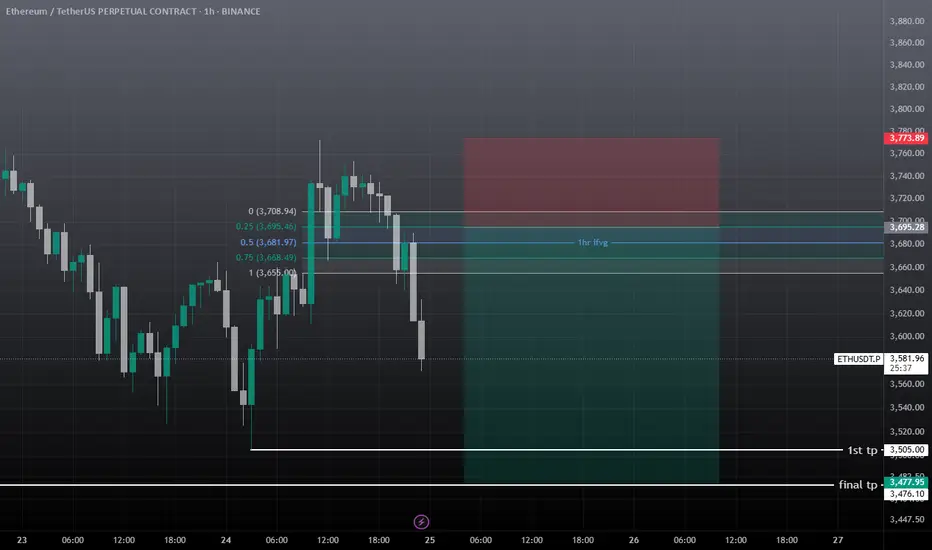
eth usdt short setupEth showing some correction towards 3.4-3.2k , I'm not bearish but alts needs some correction before another mini leg-up, must use sl, take some entry at 3681 and other on 3695. If tp hits first then ignore it.
Ethereum (ETH): Buyers Accumulated | Time For Boune & BreakoutEthereum had its fun this week, and now we are already seeing some signs of buyer dominance forming here.
Based on our overall target and bigger timeframes, TAs, the $4000 is the target and 4hour candels are showing that buyers have not given away anything yet but rather have just been accumulating.
As long as we are above our entry area, we are bullish, and so should you be ...
Swallow Academy

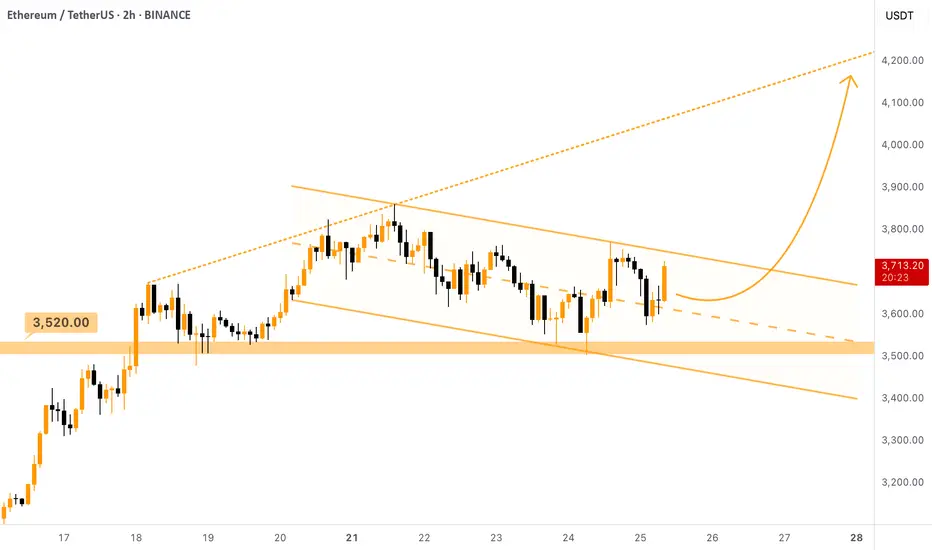
$ETH - Taking Lead Over $BTC (again)Ethereum is strong as ever here. Despite Bitcoin dumped due to the FUD of Galaxy Digital selling CRYPTOCAP:BTC worth of $3.5B, Ethereum managed not stay above the support and even umped!
It is currently forming a Descending Channel (bullish pattern) above the $3520 support level. Local setup. Once this channel is broken upwards, we can expect the price to move towards the ascending resistance that was set a week ago, target is $4100 - $4200 .
You can either enter a trade here or wait for the breakout of the descending channel, the second option is safer.
Flat, Quiet… and Full of Clues .Most traders only see the middle.
The acceleration. The “trend”. The movement.
But that’s just one-third of the story.
If you really want to understand the market’s rhythm,
you need to study how moves begin, evolve, and die.
Let’s break down the 3 key phases every market goes through —
again, and again, and again.
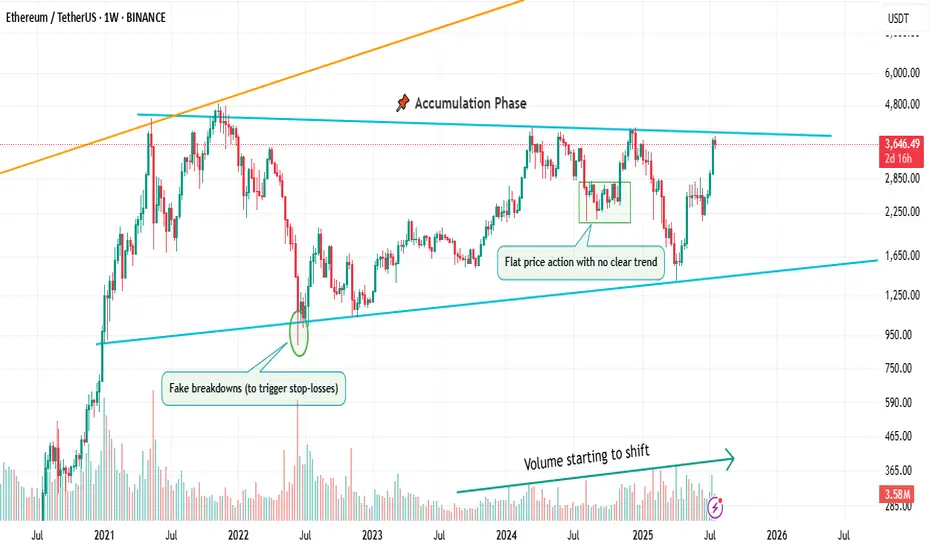
📌 1. Accumulation Phase
This is the part no one talks about.
Why? Because it’s boring. Choppy. Range-bound. Confusing.
Most traders get shaken out here.
But smart money? They’re quietly buying.
You’ll often see:
Flat price action with no clear trend
Fake breakdowns (to trigger stop-losses)
Volume starting to shift
Long wicks — both directions
This phase is a test of patience, not prediction.
And if you learn to read it well, you’ll start catching moves before they go parabolic.
🚀 2. Markup / Acceleration Phase
Here’s where everyone wakes up.
Momentum kicks in.
News gets bullish.
Breakouts start working.
Pullbacks are shallow.
And suddenly, everyone’s calling it a bull market.
But don’t be fooled.
This is not where smart money enters — this is where they ride the wave they already created.
Learn to:
Ride trends, not chase them
Add on pullbacks
Avoid FOMO entries
This is the fastest and most emotional part of the cycle — which means it rewards discipline, not excitement.
🧯 3. Distribution Phase
The party’s still on… but the hosts are quietly leaving.
Price starts to stall.
Breakouts stop working.
Volume gets heavy at the top.
And the same excitement that brought everyone in?
It’s now being used to sell into.
Distribution is sneaky.
It’s not an obvious top.
It’s a process — just like accumulation.
You’ll often see:
Lower highs forming quietly
False breakouts to trap buyers
Increasing volatility
Bullish news… with no follow-through
If you’re not paying attention, you’ll keep buying strength —
right before the rug gets pulled.
So what’s the lesson here?
Markets don’t just “go up or down.”
They prepare, move, then exhaust.
And if you learn to spot these transitions —
you’ll stop reacting late
and start positioning early.
That’s the real edge.
currently we are on the accumulation phase so in this idea I tried to show you the real story behind it and as well talk about the two others to beware of them also in the right moment I will talk about them , but for now let's focous on the current phase because we want to be part of the smart money and enjoy the next phase which is 🚀Markup / Acceleration Phase .
—
🧠 Save this post.
🔁 Revisit it when you’re confused.
📊 Because the chart isn’t random — it’s just cycling
And also remember our golden rule :
🐺 Discipline is rarely enjoyable , but almost always profitable. 🐺
🐺 KIU_COIN 🐺
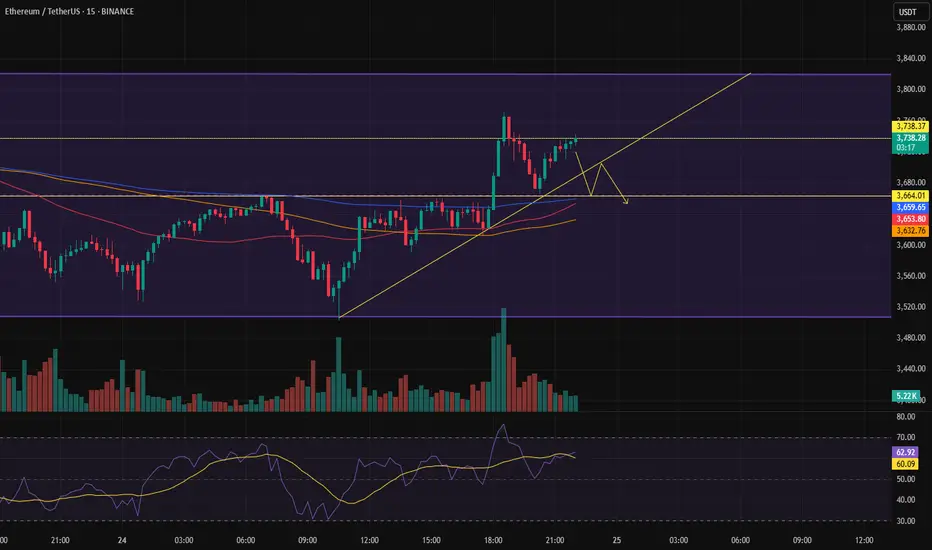
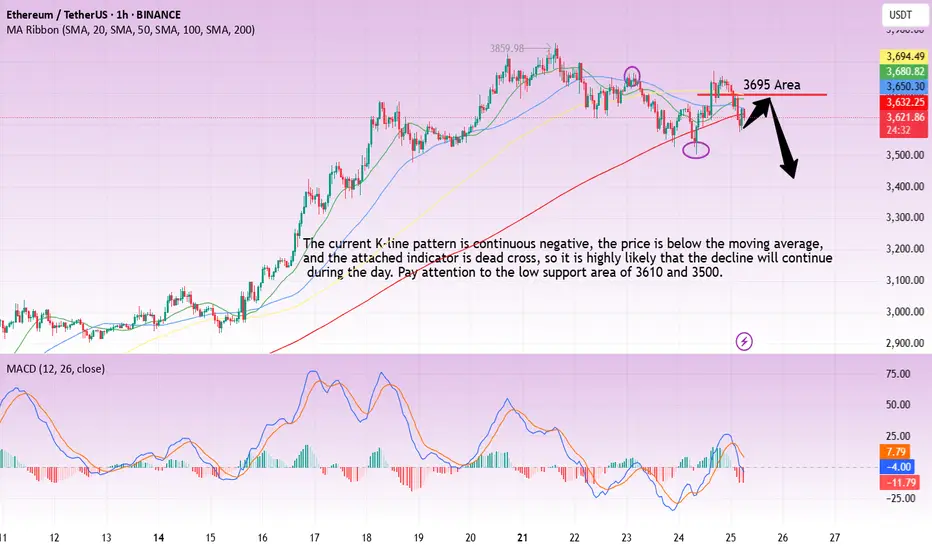
ETH-----Sell around 3690, target 3615 areaTechnical analysis of ETH contract on July 25:
Today, the large-cycle daily level closed with a small positive line yesterday, the K-line pattern was single negative and single positive, the price was at a high level, and the attached indicator was golden cross and running with shrinking volume. From the big trend, the current trend is in a weak trend, the price rebound is not strong and has not continued, the trend is prone to fall under pressure and test the low point downward, so the trend has changed; the short-cycle hourly chart yesterday hit a high in the US market and fell under pressure in the Asian morning. The current K-line pattern is continuous negative, the price is at a low level, and the attached indicator is dead cross running. It is highly likely that the decline will continue during the day. Yesterday's low point of 3500 is the position that needs to be paid attention to today. The current hourly chart resistance is near the 3695 area.
Today's ETH short-term contract trading strategy:
Sell in the 3690 area after the rebound, stop loss in the 3720 area, and target the 3615 area;
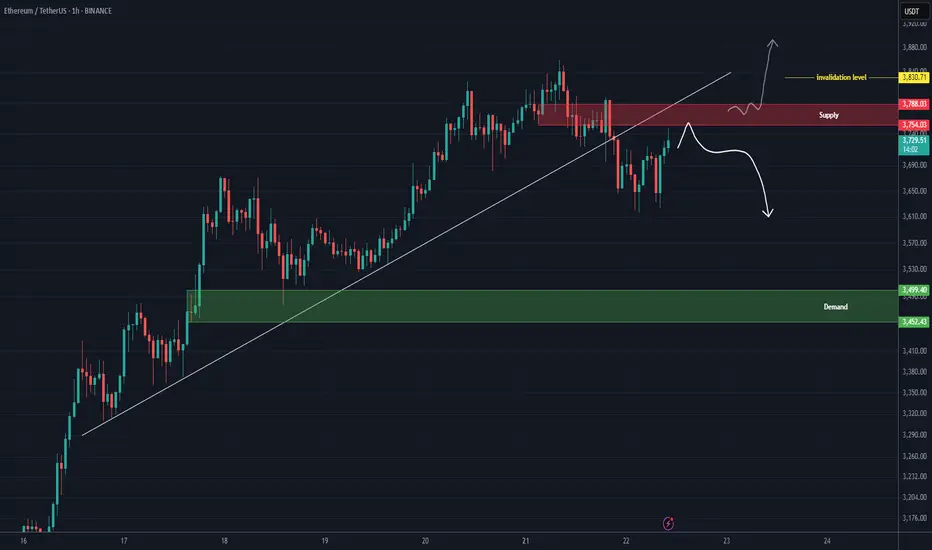
ETH analysis (1H)A trendline has been broken, and a resistance zone has formed on the chart. As long as Ethereum fails to hold above the red zone, the price may experience a drop.
The green box can be considered the target.
If the price stabilizes above the red zone and a daily candle closes above the invalidation level, this analysis will be invalidated.
For risk management, please don't forget stop loss and capital management
Comment if you have any questions
Thank You
ETH ~ Receive more than you expect!Such nice momentum to see but buys at red! but always place to limits to take those buys!
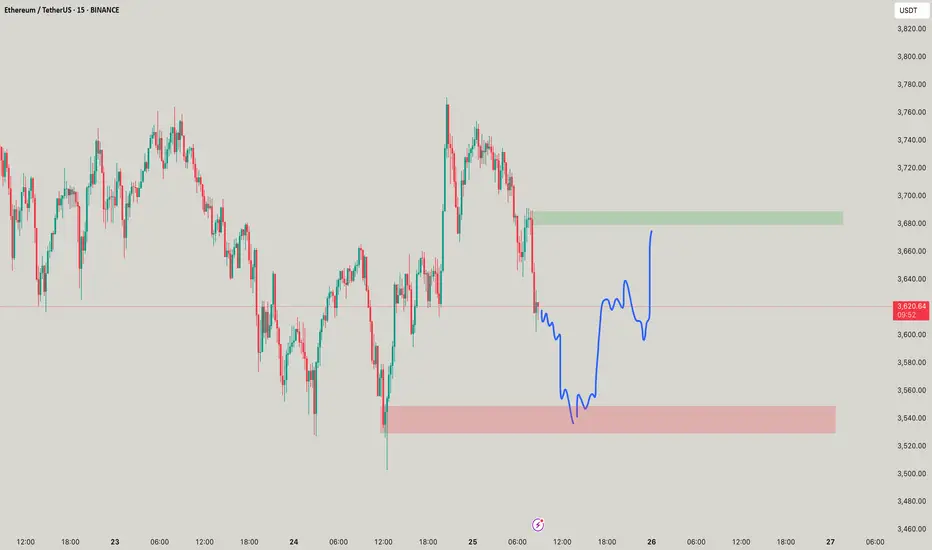
Sell opportunity?If the trendline breaks in the lower timeframe, a short position can be taken down to the bottom of the channel.**