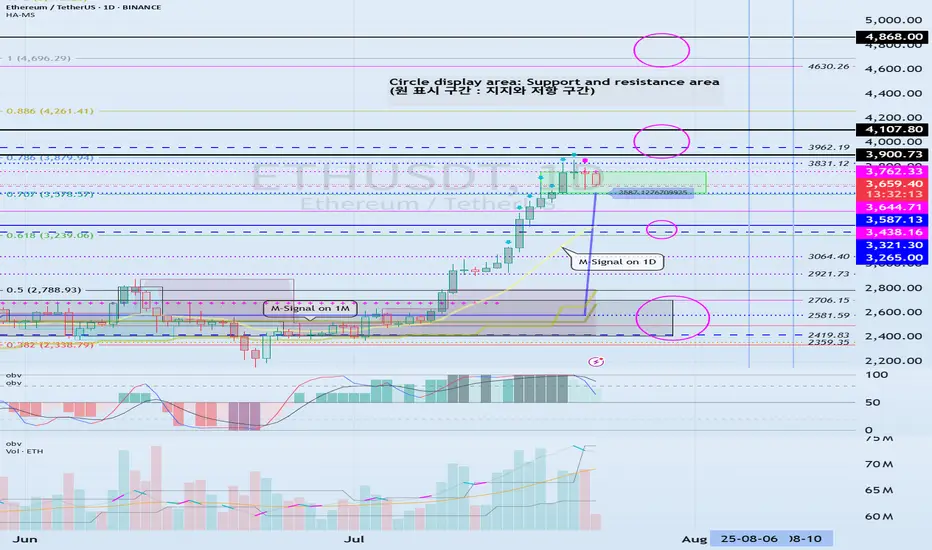
Check if HA-High indicator is forming at 3587.13
Hello, traders.
If you "Follow", you can always get the latest information quickly.
Have a nice day today.
-------------------------------------
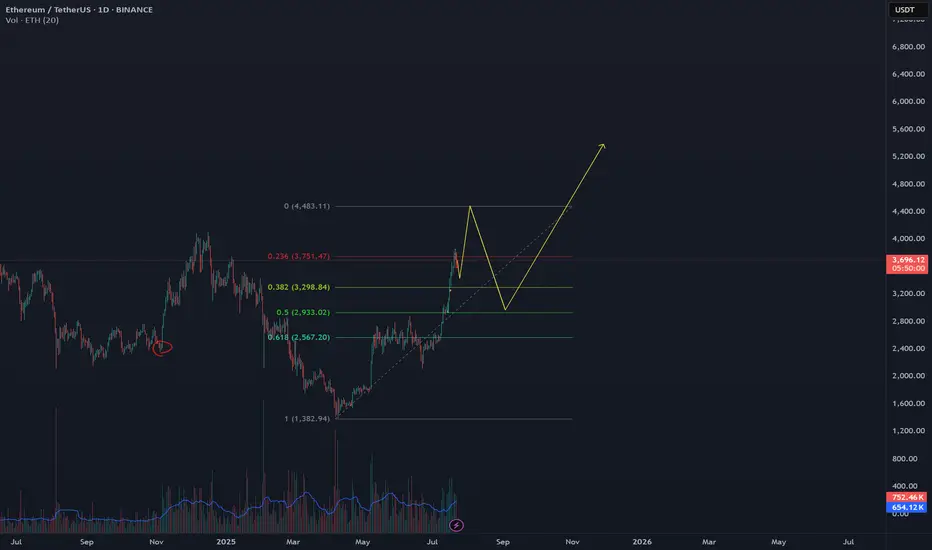
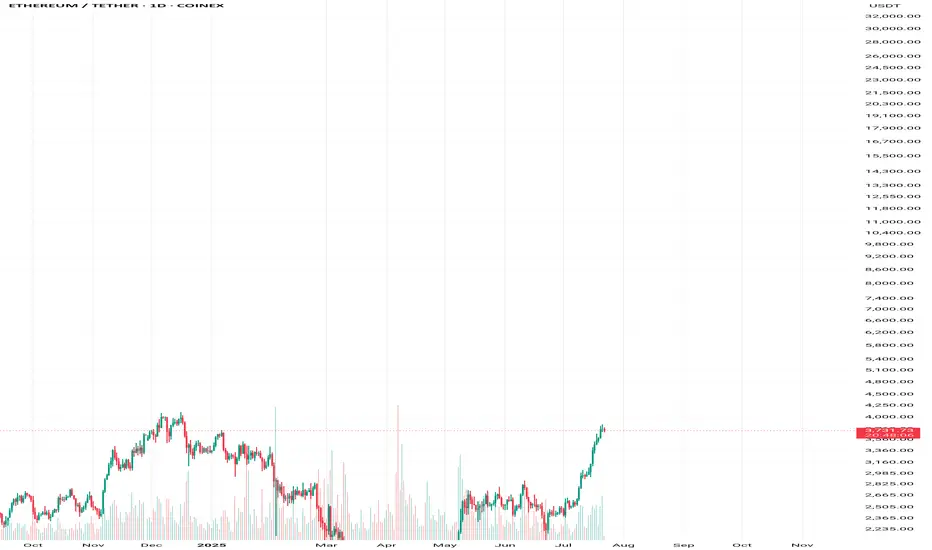
(ETHUSDT 1D chart)
HA-High indicator is showing that it is about to form at 3587.13.
Accordingly, if the HA-High indicator is newly created, the support in the 3587.13-3762.33 section is an important issue.
If it falls below 3587.13, it is likely to touch the M-Signal indicator on the 1D chart.
Therefore, we should check whether it touches the area around 3265.0-3321.30 and rises.
-
This can be seen as a time to test whether it will continue the first step-up trend while rising in the important section of 2419.83-2706.15.
ETH's volatility period is around August 6-10, but we should check what kind of movement it shows after passing the volatility period of BTC.
-
Thank you for reading to the end.
I hope you have a successful transaction.
--------------------------------------------------
- This is an explanation of the big picture.
(3-year bull market, 1-year bear market pattern)
I will explain more details when the bear market starts.
------------------------------------------------------
ETHUSDT.P trade ideas
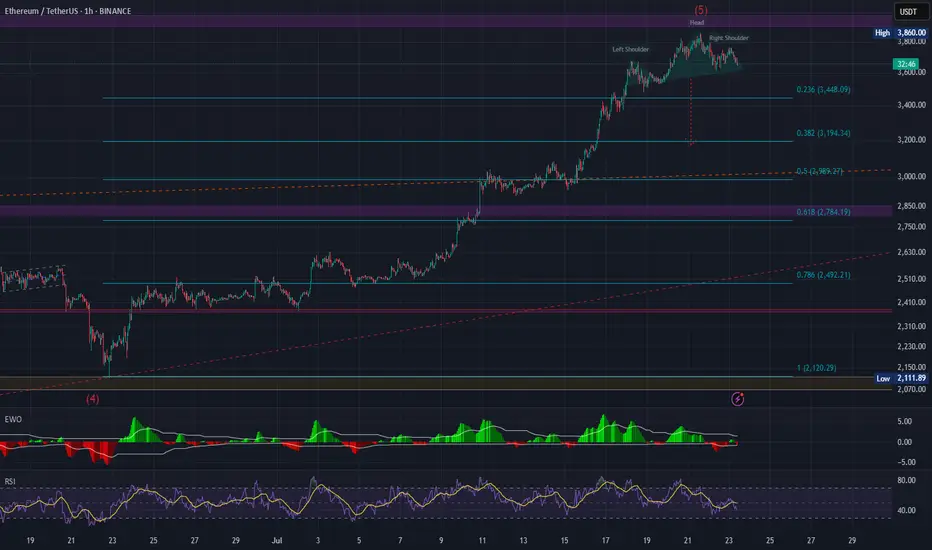
H&S formation at 1H chartETH/USDT almost completed formation of H&S patern at 1H chart. If neckline will be broken it's mean Elliot wave completed and we can expect deep correction. Also RSI divergence confirming this reversal
Ethereum Breakout Could Spark the Next Altseason!A Massive Altseason Is Brewing… 🚀
Ethereum just flashed a major monthly breakout after printing a clean Morning Star reversal right at key support.
Now it's pushing against the upper resistance zone, a structure that held it back for over two years.
If CRYPTOCAP:ETH breaks and closes above this level, it won’t just be bullish for Ethereum — it could ignite the biggest altcoin season since 2021.
Why it matters:
📌 ETH is the heart of the altcoin ecosystem.
📌Historical breakouts like this led to 1500%+ moves.
📌The pattern and price action are lining up perfectly again.
Once Ethereum breaks cleanly above $4,000, expect altcoins to explode across the board — Layer 2s, DeFi, AI tokens, and even the meme coins could all start flying.
Keep your eyes on ETH. Its breakout is the spark… the altseason fire is coming.
DYOR | Not Financial Advice

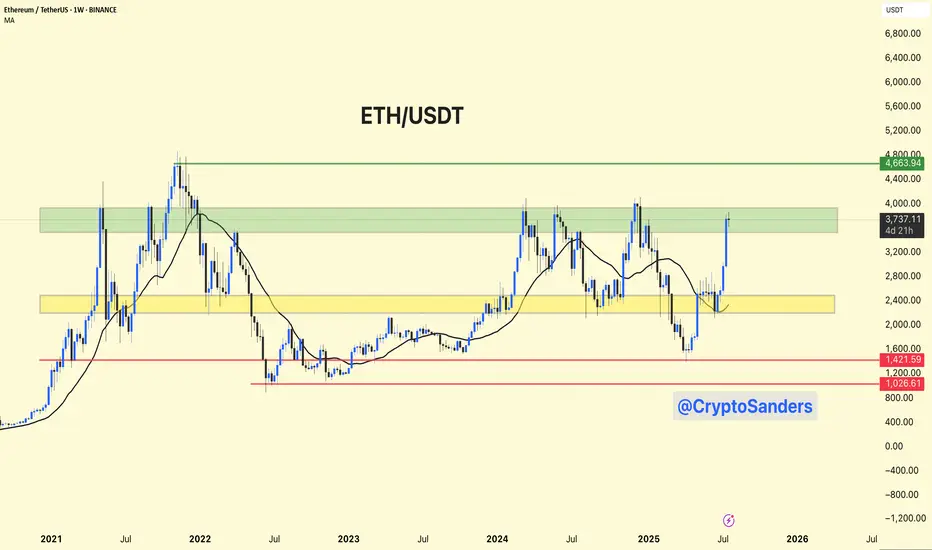
ETH/USDT – Weekly Chart Analysis !! ETH/USDT – Weekly Chart Analysis
ETH is testing a major historical resistance between $3,700 – $4,000 (highlighted green zone).
A clean breakout above this level could push price toward the next key resistance at ~$4,660.
Previous accumulation zone around $2,400 – $2,800 (yellow box) now acts as strong support.
Long-term floor at $1,420 and $1,025, though currently far below.
Bullish Breakout Potential: If ETH sustains above the green resistance, it may retest $4,660+.
A failure to break above $4K could lead to a healthy pullback toward the yellow zone (~$2,800).
Stay updated and manage your risk accordingly.
DYOR | NFA
ETHS Swing long to $4100Just now opened a swing long position on eth...though looking at it from the 4hr kinda looks like it might get hit today or tomorrow....that be awesome
Playing it conservative.
Stop is below prior week low at $3580
The prior week closed with little top wick rejection with big strong body. Daily also close similar . 4hr and 1hr tend is also aligned so basically all trends align from weekly to 1hr which stacks the odds significantly in our favor.
And fundamentally there has been a lot of talks about Etereum.. Lets see how it goes.
Roughly 2.42 RR. I did size up to like 4 times my usual risk.

gold vs ethIf we follow this fractal, we should top around $4k and then a pullback to $3k followed by news highs in Q4
HolderStat┆ETHUSD approaching $4kOKX:ETHUSDT continues its move after breaking above $2,900. Next resistance sits around $3,500. Uptrend remains intact while above $2,875.

Weekly plan for EthereumLast week, ETH followed our green scenario, breaking through resistance to reach $3,860. Currently, a critical level at $4,116 (higher timeframe) will determine the next major move.
Key Scenarios
If $4,116 holds as resistance:
Expect a Wave E correction within the long-term ABCDE triangle pattern.
Initial downside target: $3,500
Breakdown below $3,500 opens the door to $3,100–$2,900
If $4,116 breaks:
The ABCDE triangle scenario is invalidated
Next major resistance levels open for a potential continuation rally
Current Market Structure
Price remains above the weekly pivot point
However, early signs suggest a correction may have begun
Confirmation of a deeper pullback requires a close below $3,500
As always, manage risk according to key level breaks

ETH — Perfect Long Play: Pullback & 1W Breaker Reclaim
After the strong move, price is likely to retrace as longs get trapped and late buyers take profit.
Best scenario: ETH pulls back to the 1W breaker zone ($3,141–$3,456), which previously acted as resistance and could now flip into support.
Watch for bullish reaction and confirmation in the 1W breaker zone.
If support holds, enter long — targeting a return to the range high and then the liquidity zone ($4,108+).
Invalidation if ETH closes below the 1W breaker or loses range low ($2,876) support.
ETH has rallied hard. After such a move, it’s normal for price to pull back and test old resistance as new support. The ideal long is on confirmation of a bounce from the 1W breaker zone, which keeps risk controlled and sets up for a continuation move higher. This approach avoids FOMO and protects against reversal if the breakout fails.

Ethereum (ETH) Analysis – July 22, 2025🚨 Ethereum (ETH) Analysis – July 22, 2025
👉 Please read the previous post first. That one explains the fundamental background and market behavior that led to today’s setup.
Now let’s zoom in on ETH with some fresh analysis 👇
---
✅ ETH/BTC – Trend Structure
📈 The overall trend is still bullish, even though today's candles are red and corrective.
🔹 Resistance: 0.03242
→ A breakout here = confirmation to enter or continue long.
🔹 Support: 0.03072
→ Price reacted here, showing it’s a valid level.
🔹 Key Support: 0.02975
→ If broken, the bullish structure breaks, and a deeper correction may begin.
---
📊 ETH Dominance (ETH.D)
🔹 Resistance: 11.90%
→ Staying above this = support for keeping or adding to longs.
🔸 Support Zones:
11.45%
11.22%
→ Strong zones if market pulls back.
---
🌐 TOTAL2 (Altcoin Market Cap Without BTC)
🔹 Key Resistance: $1.55 Trillion
→ Breaking above this = more upside for altcoins, including ETH.
---
🔎 ETH/USDT – 4H Timeframe
✅ Mid-term trend is still up, but we are entering a correction phase.
📉 Price is testing the key 3,480 level.
📊 Volume is high, and momentum is fading, which shows buyers are getting weaker.
📈 20 EMA and 50 EMA are still rising, but flattening.
---
📌 Key Confluences
🧩 USDT.D at 4.14%
🧩 BTC Dominance at 61.31% and 60.42%
These levels + ETH chart = critical for making accurate decisions.
---
📈 Main Scenarios
🟡 Scenario 1 – Sideways Range
→ Price moves between 3,480–3,850
→ If confirmed, smart entries from edges with tight SLs make sense.
🔻 Scenario 2 – Breakdown of 3,480
→ Bullish 4H structure breaks
→ Possible drop to 3,200 or even 3,060
⚫ Scenario 3 – Breakout of 3,850
→ Likely moves to range between 3,850–4,000
→ Market enters a “macro decision zone”
🟢 Scenario 4 – Sharp Break Above 4,000
→ Strong bullish signal
→ Daily uptrend may continue toward 4,400 or even a new ATH
---
🚀 If this analysis helped:
🔁 Tap the rocket to boost
🔔 Follow for more clear updates
💬 Comment your thoughts or chart ideas!

ETH (5 year of accumulation!)ETH / USDT
📌 Background: i shared an analysis about ETH/BTC chart and i predicted the ultimate bottom, from which ETH/BTC pumped 52% and ETH/USDT pumped 97% in few days !
you can check previous analysis: click here
📌 Today we have different chart against stable coin … Ethereum is being accumulated since 5 years in mega accumulation range with 2 major stop-loss hunt (long and short)
📌 What IF ?
What if ETH made a breakout throughout this accumulation ? i think we can see scenario like that in the green candles in my chart
DO YOU AGREE ?

ETH-----Sell around 3680, target 3650-3630 areaTechnical analysis of ETH contract on July 22:
Today, the large-cycle daily level closed with a small positive line yesterday, the K-line pattern continued to rise, the price was above the moving average, and the attached indicator was running in a golden cross. The overall upward trend was still very obvious, and yesterday's decline can be regarded as a correction based on the current trend. The price just returned to the support of the moving average, and the strong support position was near the 3630 area; the short-cycle hourly chart currently has a continuous negative K-line pattern, the price is below the moving average, and the attached indicator is running in a dead cross, so let's look at the retracement trend during the day, and pay attention to the 3630 area below the support.
Today's ETH short-term contract trading strategy:
The current price is 3680, short, stop loss in the 3745 area, and the target is the 3650-3630 area;

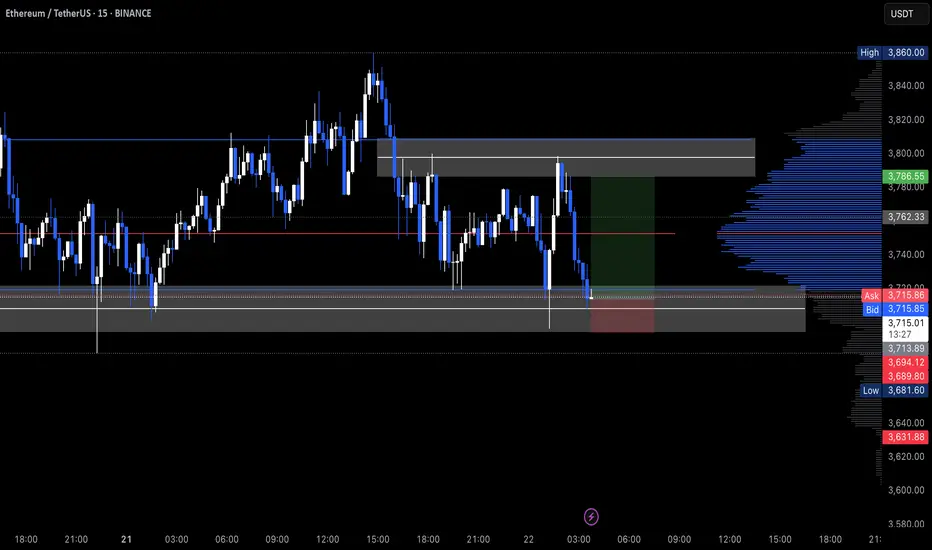
Liquidity Hunt Complete - ETH/USDT 15M BreakdownThis 15-minute ETH/USDT chart outlines a classic Smart Money Concept (SMC) short setup. Price action formed a bullish trendline, building internal liquidity and inducing breakout traders above previous highs (Ex-liquidity).
A clear CHoCH (Change of Character) and subsequent BOS (Break of Structure) confirmed bearish intent. Entry was taken at the Fair Value Gap (FVG), aligned with a bearish order block. Price is projected to sweep trendline buyers’ stops and target the discount zone below.
This analysis showcases liquidity engineering, stop hunts, and institutional footprints, providing a high-probability short scenario with well-defined entries, stops, and targets based on SMC principles.

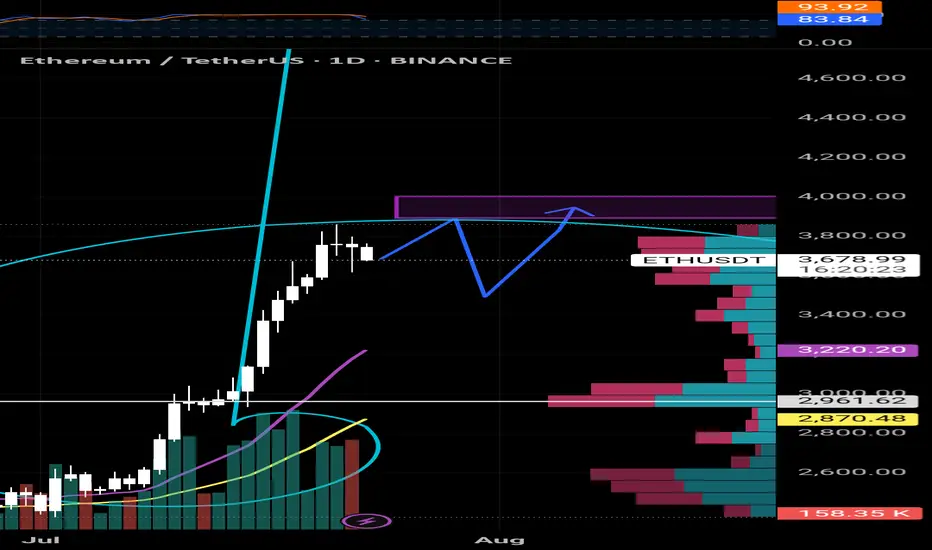
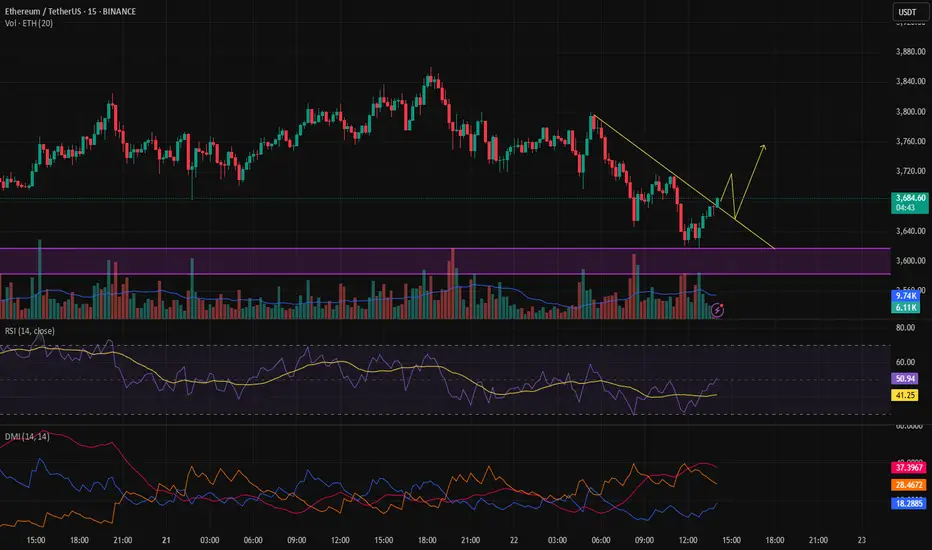
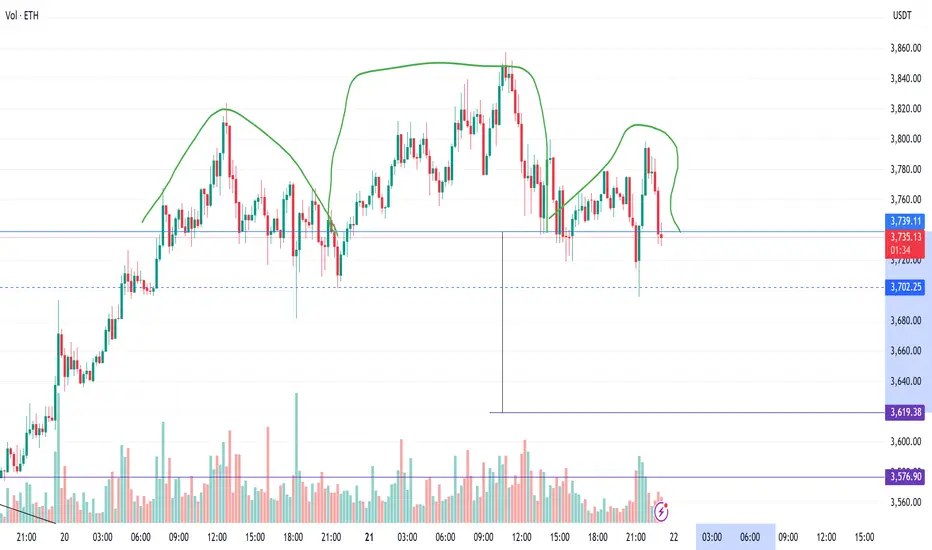
Ethereum 15m Analysis – Waiting for Bullish ConfirmationAfter a step up, Ethereum made a pullback, and a news event released today caused the correction to deepen.
So far, we haven’t received any bullish confirmation.
If the price pulls back to the marked level and gives confirmation on the 15-minute timeframe, we can look for a buy opportunity.
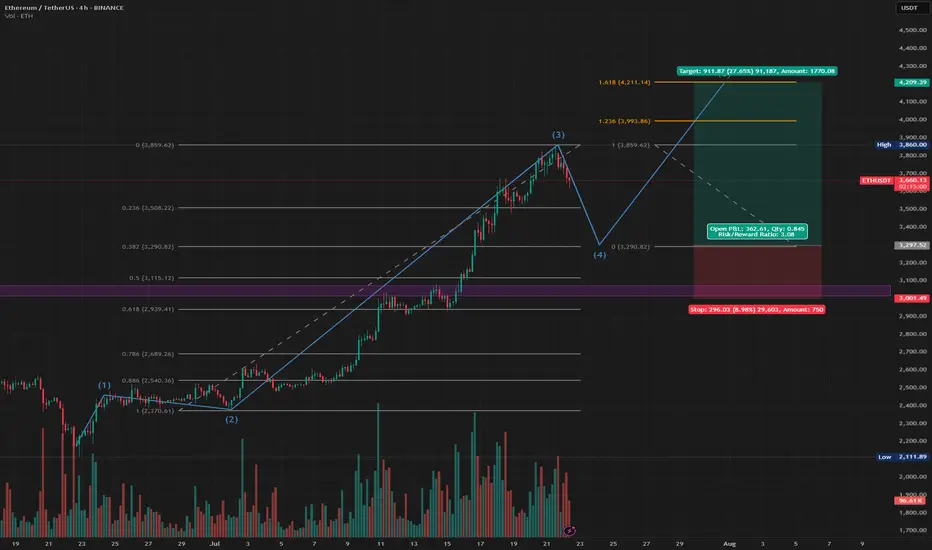
ETH Long Closing July 2025 - Elliot Waves 4-5Elliot Wave setup on the ETH 4h chart. We're now in wave 4, which should be steep since wave 2 was shallow. so targeting the .382 fib for a long entry at $3290 (most likely) - but could go down to the .5 fib for a lower entry ($3115). SL just lower than the DOL on the weekly HTF (end of Nov). Wave 5 should run to $3993 or $4211 (TP at both).
If you're feeling brave, you could also short the rest of wave 4, but be aware this is going against the market upwards momentum and BOS in BTC dominance.
Ethereum (ETH): RSI Restarted, Going For $4000 Now?We were very close to our target of $4000,, where we had an early overtake by sellers, correcting the coin properly and stabilizing most of the the indicators like Bollinger Bands and RSI that we both use.
Monday was full of manipulations and now today we started with some strong downside movement, but we are bullish as long as we are above $3400
Swallow Academy

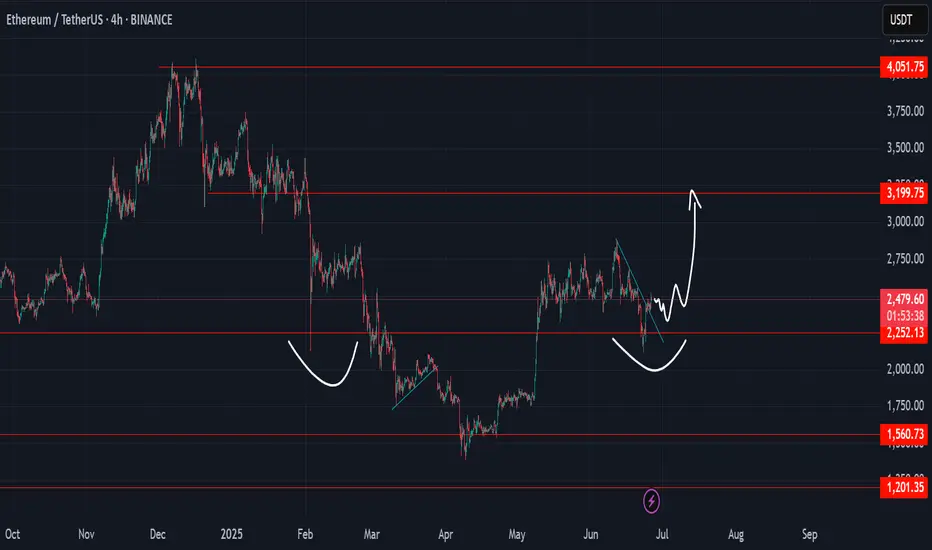
ETH and iHnS SpeculationETH in candle stick mode create iHnS pattern
if we can hold above 2k its still positive if we can retest to 3.2k
Ether: Signs of an Impending Decline?On July 21, 2025, Peter Schiff, a well-known Bitcoin critic and gold advocate, posted on X. His tweet, garnering over 1.5 million views, immediately captured the crypto community's attention:
"Ether is back near the upper end of its trading range again. If you own any, this is a great time to sell. As much as it pains me to say, selling Ether and buying Bitcoin with the proceeds is a better trade than holding Ether."
While coming from a skeptic, this statement resonates with concerns from many analysts who point to potential bearish signals for the second-largest cryptocurrency. Several factors could contribute to a further decline in Ether's price in the near future.
Technical Analysis
From a technical analysis perspective, the outlook for Ether also appears concerning. Yesterday, July 21, on the daily timeframe, the RSI (Relative Strength Index) surged past 87%. Such a high RSI value frequently signals an overbought asset, indicating a strong likelihood of an imminent price correction or decline. Investors who rely on technical analysis might interpret this as a clear signal to take profits.
Concurrently, on the same daily timeframe, a "Bearish Evening Star" candlestick pattern formed. This three-candle pattern is considered a powerful bearish reversal signal. An "Evening Star" typically emerges after an uptrend, pointing to a potential start of a downward movement. The combination of an extremely high RSI and a bearish candlestick pattern significantly reinforces the probability of a decline in Ether's price in the immediate future.

ETHUSDT LongThis is not a financial advice. I don't sell signals or tips. It's just for educational purposes.
Analysis for entering Ethereum after an incomplete correctionSure! Here's the complete and fluent English translation of your text:
---
Ethereum Price Analysis and Buy Strategy for a 3–4 Month Hold (as of July 22, 2025)
When considering Ethereum (ETH) for a medium-term hold of 3 to 4 months, it's important to keep a few key points in mind. The cryptocurrency market is highly volatile, and there's no guarantee of profit. The following information is based on available analysis as of July 22, 2025, and should not be taken as financial advice. Always do your own research and consult a financial advisor if necessary before making any investment.
---
✅ Current Ethereum Price Analysis (as of July 22, 2025):
Current Price: Ethereum is currently trading in the range of $3,750 to $3,800.
Short-Term Trend: ETH has seen a significant rise in recent weeks, climbing from around $2,900 to its current price range. This growth is partly due to increased investor interest in Ethereum spot ETFs, as well as ecosystem developments like Dencun upgrades and the expansion of Layer 2 solutions.
Technical Analysis:
Moving Averages: Most short-term and long-term moving averages (e.g., MA5, MA10, MA20, MA50, MA100, MA200) are signaling a "Buy", indicating a strong bullish trend.
Relative Strength Index (RSI): Ethereum’s RSI is currently high (around 67 to 87), suggesting strong bullish momentum. However, an RSI above 70 also signals a possible overbought condition, which could lead to a short-term price correction.
Key Support & Resistance Levels:
Support: $3,400, $3,200–$3,250, and $2,900–$2,700
Resistance: The psychological barrier at $4,000 is a major resistance level. Breaking above this could open the path toward ETH’s all-time high (ATH) of around $4,878.
Short-Term Forecast (Next 3–4 Months):
Many analysts and forecasting models suggest a positive outlook for Ethereum over the coming months.
Some projections estimate ETH could reach $4,200 to $5,150 (or even higher) by late 2025.
Factors contributing to potential growth include capital inflows into spot ETFs, rising ETH staking, and continued Ethereum network development.
---
📈 Buy Strategy for a 3–4 Month Hold:
For a medium-term hold, Dollar-Cost Averaging (DCA) is a highly recommended strategy. DCA helps reduce exposure to short-term volatility and makes capital management easier both financially and psychologically.
Why DCA Works Well for 3–4 Month Holds:
Mitigates Volatility Risk: Instead of investing your entire capital at once, divide it into smaller amounts and invest at fixed intervals (weekly or biweekly). This way, you buy at both high and low prices, achieving a more balanced average entry point.
Reduces Emotional Pressure: You don’t have to worry about timing the market perfectly. With consistent buying, you reduce the stress of “buying the dip” or “selling at the top.”
Takes Advantage of Dips: If ETH experiences a dip during your holding period, you can buy at lower prices, reducing your average cost.
---
📌 How to Execute the DCA Strategy (Example for 1 ETH Investment):
Assume you want to invest the equivalent of 1 ETH (about $3,750 at current price).
1. Determine Your Total Budget: Decide how much you want to invest—only use funds you can afford to lose. In this case, $3,750.
2. Break the Holding Period into Weeks: Divide the 3–4 month period into weeks:
3 months = 12 weeks → $3,750 / 12 = $312.50 per week
4 months = 16 weeks → $3,750 / 16 = $234.37 per week
3. Set a Fixed Buy Schedule: For example, buy every Monday at 10 AM, regardless of the price at that moment.
Sample DCA Timeline (with hypothetical price movements):
Week 1: Buy $312.50 ETH at $3,750
Week 2: ETH dips to $3,600 → Buy $312.50
Week 3: ETH rises to $3,900 → Buy $312.50
Week 4: ETH falls to $3,500 → Buy $312.50
… Continue this process for the full 3–4 months.
---
🛡️ Additional Tips for a 3–4 Month Hold Strategy:
Know Your Risk Tolerance: ETH is a high-risk asset. Understand your personal risk level before investing.
Stay Informed: Even while holding, monitor ETH-related news, upgrades, and crypto market developments.
Use a Secure Wallet: Store your ETH in a secure wallet (preferably a hardware wallet) to protect against hacks or exchange risks.
Optional Partial Profit-Taking: If ETH experiences an unexpected surge (e.g., above $4,500 or $5,000), you could consider taking partial profits (e.g., sell 10–20% of your holdings) to reduce risk and lock in gains. This is optional and depends on your strategy.
Stop-Loss (if active trading): If you’re only holding passively, you likely won’t set a stop-loss. But if you plan to do active trades later, make sure to use stop-loss orders to protect capital in case of a steep price drop.
Take-Profit (TP) Planning: Even when holding, you can plan price targets. For example:
Sell 25% if ETH reaches $4,500
Sell another 25% if ETH hits $5,000
(Adjust based on your goals.)
---
🔮 Outlook for the Next 3–4 Months:
With Ethereum spot ETFs launching and generating excitement, capital inflow is likely to grow. Continued development of Layer 2 solutions, DeFi applications, and the overall ETH ecosystem may increase demand for ETH. Many analysts are optimistic about ETH’s performance in the second half of 2025, with potential to break above $4,000 and possibly approach or exceed $5,000.
---
✅ Summary:
For a 3–4 month Ethereum hold, DCA (Dollar-Cost Averaging) is the most practical and risk-managed strategy. Decide your total budget, split it into weekly or biweekly investments, and stick to the plan—regardless of daily price fluctuations. This strategy helps reduce emotional decision-making and improves your average entry price. Remember: crypto markets are risky, so never invest more than you can afford to lose.
---
Let me know if you'd like this formatted as a downloadable PDF, infographic, or a Notion-ready summary.
ETH - Pullback IncomingETH just printed a 1D doji reversal that could indicate a pullback should be expected. There is a lot of resistance between $3,800-$4,100 so a cooldown here would be nothing to worry about.
If we start seeing the price drop the first level of support we would want to watch is the green trendline. This could put price somewhere between $3,450-$3,530.
However if we see a wick down, or just start pumping back up creating a green daily candle following this reversal candle, that would signal this uptrend wants to climb to the $4k levels.
Be prepared for a pullback, but if we start seeing the momentum negate the reversal candle we will update this post.
Powell also speaks tomorrow so depending on what he has to say will most likely affect markets in a big way. Expect volatility.
