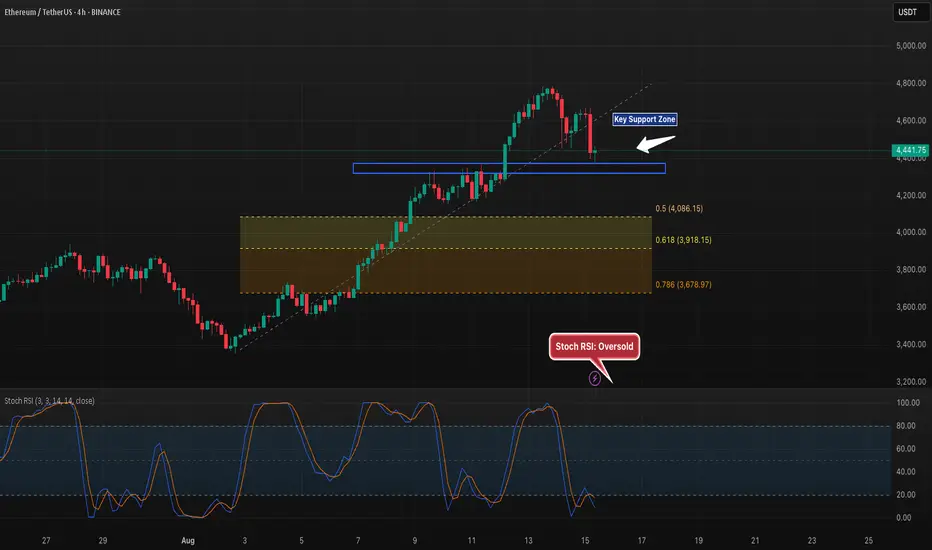
ETH 4H – Retesting $4.4K Support, Next Stops if It Breaks?ETH is currently retesting the $4,400 horizontal support after pulling back from recent highs. This level is critical as a breakdown could send price toward the $4,086 (0.5 Fib) and $3,918 (0.618 Fib) retracements, with $3,678 (0.786 Fib) as a deeper target. The Stoch RSI is in oversold territory, hinting at possible short-term relief if buyers defend $4,400. A bounce here could keep the broader uptrend intact, while a close below increases the likelihood of a larger retracement.
ETHUSDT.P trade ideas
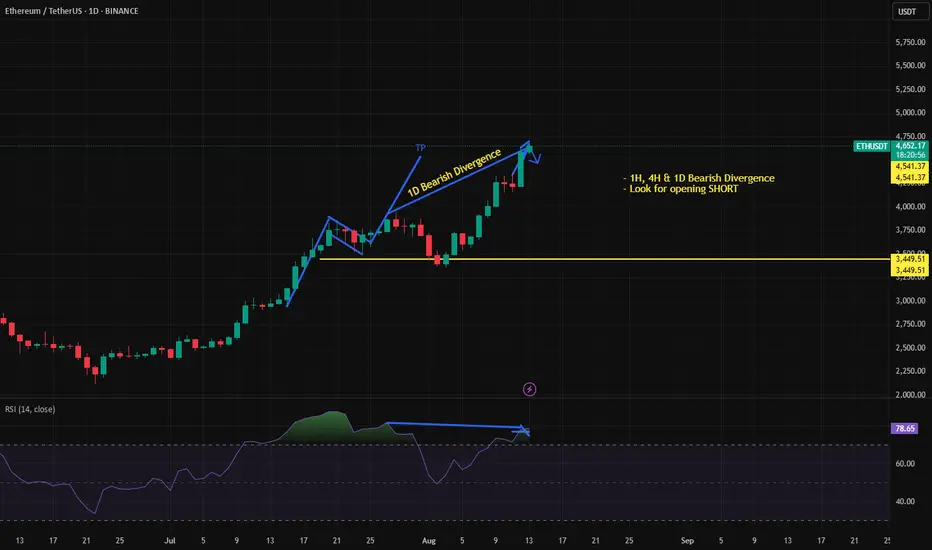
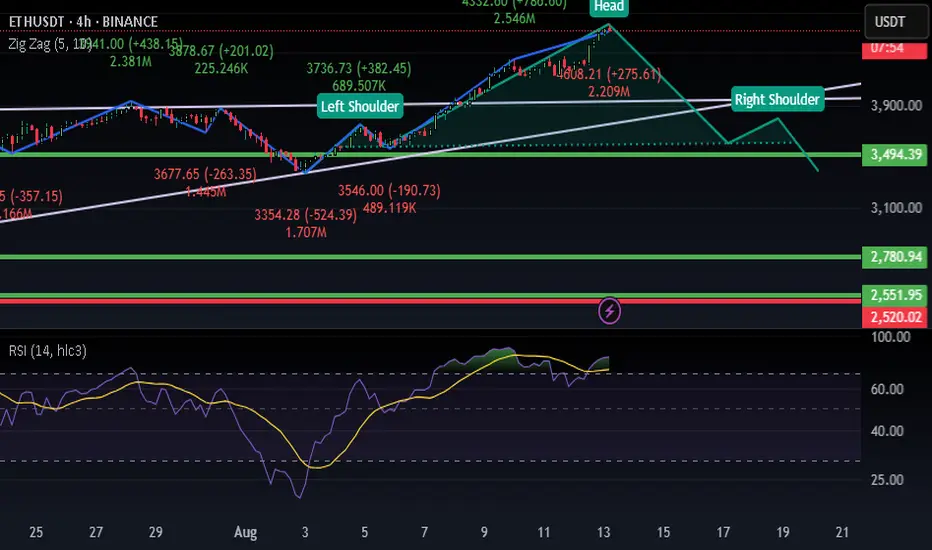
ETHUSD - Divergence Spotted, Hit projected TP1D Bearish Divergence: Price made a higher high while RSI made a lower high → momentum weakening.
Multi-timeframe confirmation: The same divergence is visible on 1H and 4H → increases reliability of a reversal.
Price at TP: Already hit the prior projection target.
Neckline watch: A close below the marked yellow neckline (~$4,541) could be your trigger to open short positions.
Next potential drop zone: If neckline breaks, next strong support is around $3,449.
This means it’s not an automatic short yet — but if price closes decisively below neckline support with increased volume, it would align with the bearish divergence and justify riding the trade down toward the $3,449 area.
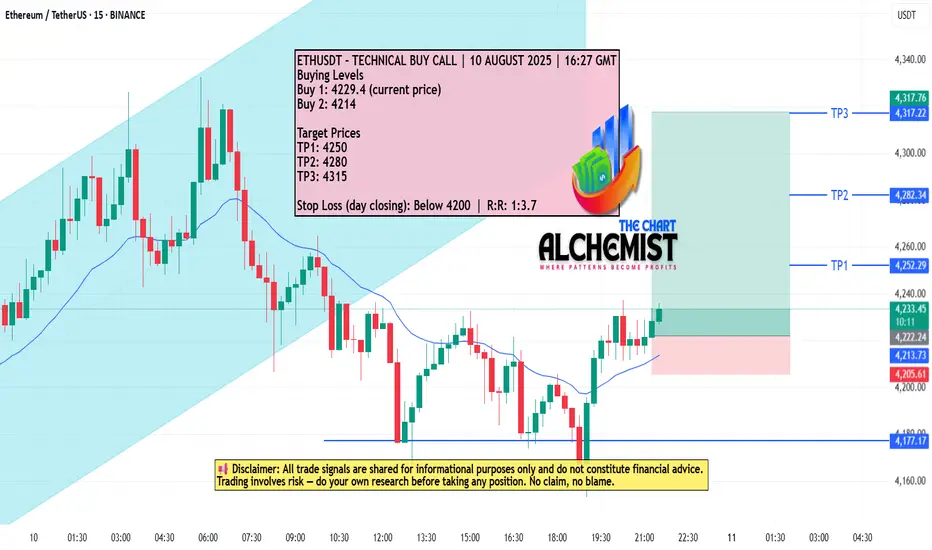
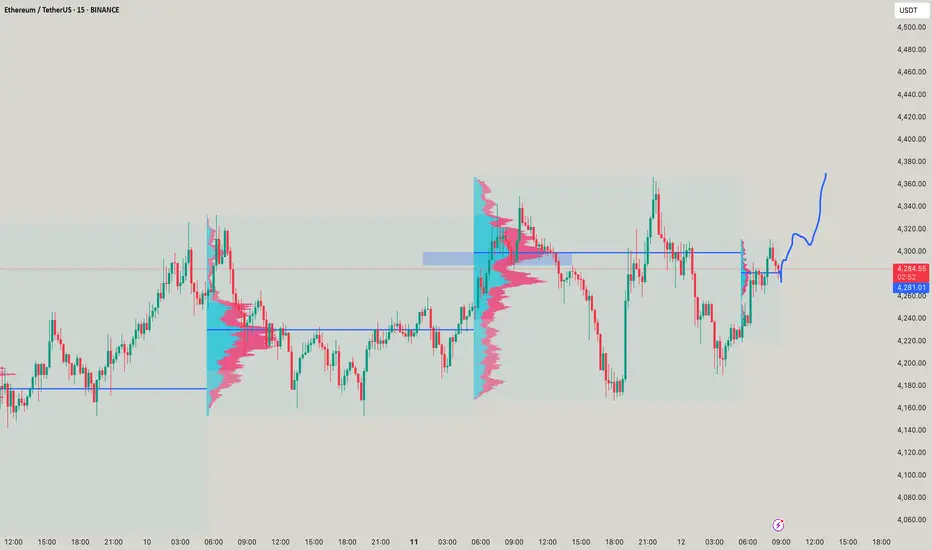
ETHUSDT – TECHNICAL BUY CALL | 10 AUGUST 2025 ETHUSDT – TECHNICAL BUY CALL | 10 AUGUST 2025
The coin has been moving in an uptrend marked with a light blue color channel. Although it recently broke down from this channel, it has sustained itself and formed a double bottom pattern. We expect the coin to test the recent swing high and achieve multiple bullish targets before any change in trend direction.
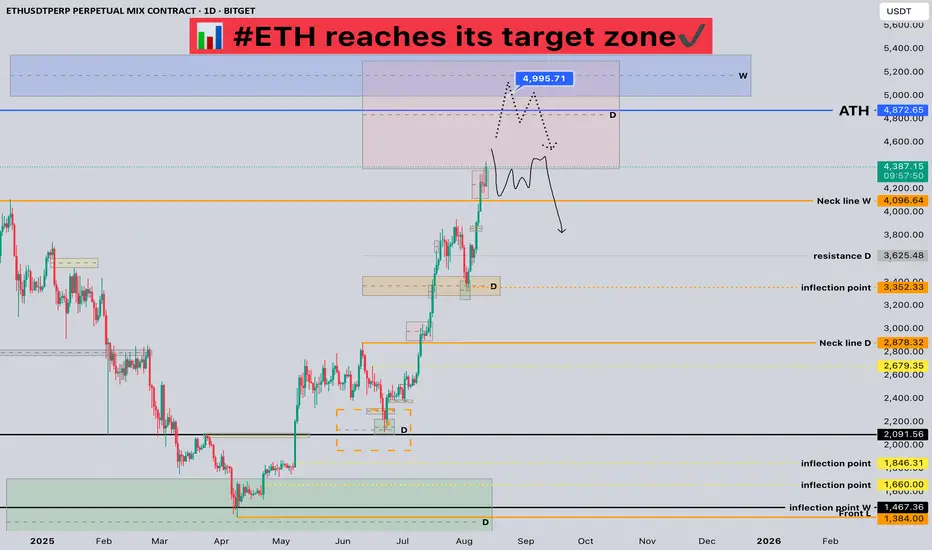
#ETH reaches its target zone📊 #ETH reaches its target zone✔️
🧠From a structural perspective, we've reached the daily bullish target zone, so we need to be wary of the risk of a pullback.
➡️Chasing the gains within the red resistance zone is not recommended, as the expectation of a daily pullback is very strong.
➡️If you want to participate in a short trade, you need to patiently wait for a bearish structure of the same cycle to emerge, or look for shorting opportunities near the overlapping resistance zone around 5000.
🤜If you like my analysis, please like 💖 and share 💬
BITGET:ETHUSDT.P
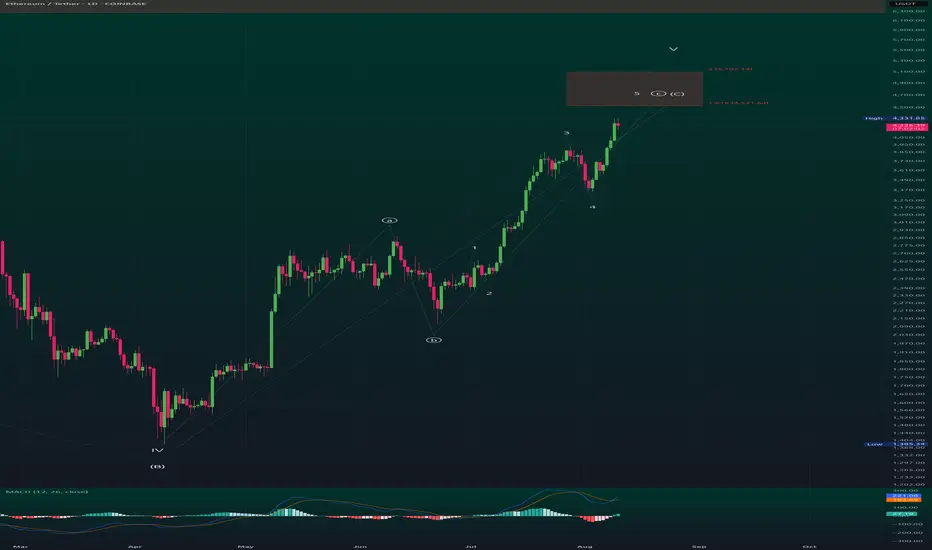
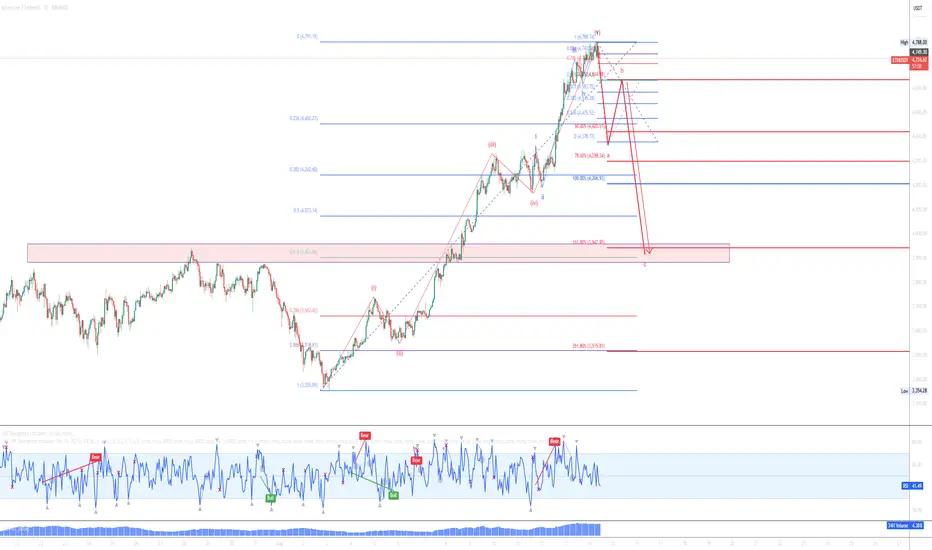
ETH/USD – Multi-Degree Terminal Advance: Daily ⑤ of CETH/USDT – Multi-Degree Terminal Advance: Daily Wave ⑤ of C Inside Weekly Wave C (Ending Diagonal)
1️⃣ Higher-Timeframe Context (Weekly)
ETH has been unfolding a large corrective A-B-C structure from the all-time high.
The current rally is Wave C of that correction.
Structural note: On the weekly, Wave 4 overlaps Wave 1 → violates standard impulse rules → the entire Wave C is taking the form of an Ending Diagonal.
Why this matters:
Ending diagonals appear in terminal positions (Wave 5 of an impulse or Wave C of a correction).
They often end with a throw-over above the upper trendline, followed by sharp and deep reversals.
2️⃣ Intermediate-Timeframe Context (Daily)
On the daily, we are in:
Wave ⑤ of daily Wave C.
That daily Wave C is also the final leg of weekly Wave C.
Implication:
Two degrees (daily & weekly) are scheduled to terminate together → high-probability major turning point.
3️⃣ Structure & Internal Wave Count
From the IV(B) low in April, ETH has advanced in five overlapping sub-waves:
Wave 1 – steady breakout leg.
Wave 2 – shallow pullback.
Wave 3 – strongest rally to date.
Wave 4 – pullback overlapping Wave 1 territory → confirms diagonal.
Wave 5 – ongoing final push into target zone.
Internals of each wave show a-b-c formations, consistent with diagonal rules.
4️⃣ Fibonacci Target Confluence
Anchor: IV(B) low → Wave 3 high → Wave 4 low
1.618 extension: $4,531 → first resistance.
2.000 extension: $5,102 → primary target.
Upper wedge projection / throw-over: $5,500–$5,650.
These levels also align with weekly fib projections for Wave C → creating a multi-timeframe resistance cluster.
5️⃣ Momentum & Divergence
MACD (Daily): Histogram making lower highs while price makes higher highs → early bearish divergence.
RSI (Daily & Weekly): Approaching overbought with flattening momentum → consistent with terminal phases.
Volume: Gradual contraction during the advance; watch for final spike on throw-over.
6️⃣ Scenarios
A) Terminal Top Scenario (Base Case)
Price completes Wave ⑤ of C inside the $4,531–$5,102 box.
Possible throw-over into $5,500–$5,650 on ETF hype.
Followed by swift rejection back inside wedge → break of Wave-4 low confirms top.
Targets after confirmation:
First: Wedge base / 0.382 retrace (~$3,800).
Next: 0.5 retrace (~$3,500).
Extended: Origin of diagonal (~$2,900).
B) ETF Extension Scenario
Price consolidates above $5,100 and pushes toward $5,500–$5,650.
Still part of Wave ⑤, just a stretched terminal before reversal.
Same confirmation rules: break of Wave-4 low validates reversal.
7️⃣ Invalidation & Risk Levels
Bearish invalidation: Break of Wave-4 low = high-probability top.
Bullish invalidation: Sustained breakout + consolidation above $5,650 would require re-evaluating the diagonal scenario.
8️⃣ Trade Plan (Non-Advice)
Aggressive fade: Short into $4,531–$5,102, add near $5,500–$5,650 if reached, stop above wedge throw-over.
Conservative: Wait for daily close back inside wedge and break of Wave-4 low, then short pullbacks.
Positioning note: Size down in diagonals — volatility spikes at turns.
9️⃣ Key Chart Annotations for Publishing
Wedge trendlines from Wave-II(B) low to Wave-IV(B) low.
Label 1–2–3–4–5 (with a-b-c internals) on daily.
Highlight $4,531, $5,102, and $5,500–$5,650 zones.
Mark Wave-4 low and wedge base with "Top Confirmed Below Here".
Add MACD/RSI divergence notes in top-right.
📌 Summary
ETH is in the final stages of a multi-degree ending diagonal:
Daily Wave ⑤ of C inside Weekly Wave C.
Both degrees likely terminate in $4,531–$5,102, with throw-over potential to $5,500–$5,650.
Once confirmed, expect a fast, deep retrace — this is a terminal pattern with macro top potential.
ETH 8H – Pullback After Parabolic RunEthereum’s 8H chart shows a sharp rally stalling near 4,750, with price pulling back from local highs. The first key support lies around 3,950–4,050, followed by a major breakout zone near 2,750–2,900 if selling deepens. Stoch RSI sits mid-range, leaving room for momentum to build in either direction. A bounce above the first support could keep the uptrend intact toward fresh highs.

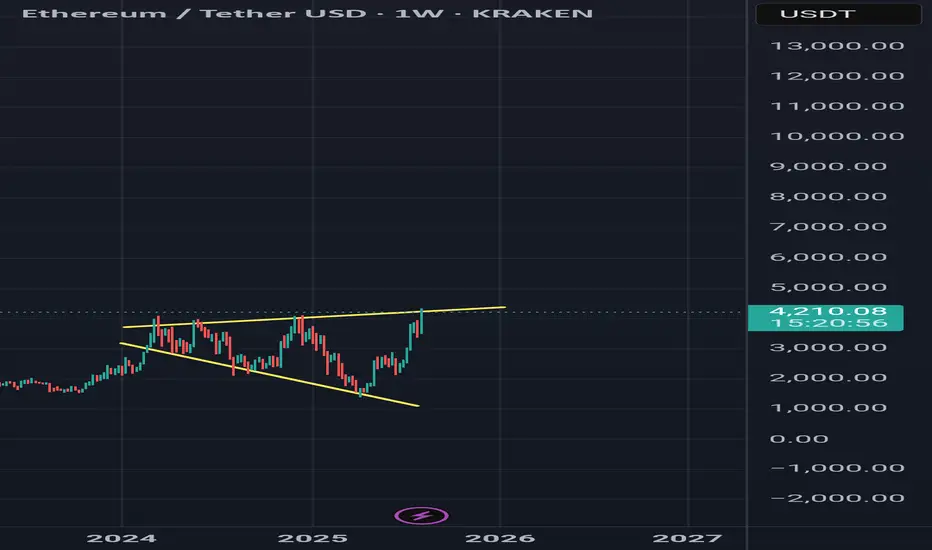
ETH/USDT Update. ETH/USDT weekly chart with those yellow trend lines forming what looks like a long-term ascending triangle / resistance ceiling just under the $4,300–$4,400.
---
1. Big Picture
The top yellow line is a multi-year resistance connecting the Nov 2021 and Mar 2022 highs.
ETH is right at that line now — this is where historically heavy selling pressure has appeared.
If ETH closes a weekly candle above $4,400 with strong volume, that’s a confirmed breakout of a 3-year structure.
---
2. Breakout Scenario
If we get a breakout:
Measured move from the base of the triangle (~$880 low to $4,400 resistance) = ~$3,520 height.
Add that to the breakout zone (~$4,400) → Target $7,900–$8,000 over months (not days).
First resistance after breakout: $4,870 (Fibonacci 2.0 extension & historical supply).
---
3. Rejection Scenario
If rejection happens here:
Possible pullback to $3,760–$3,820 (weekly demand / order block).
Deeper correction could target $3,130 if BTC also cools off.
---
4. Smart Money View
This is a high-liquidity zone — institutions & whales often engineer fake breakouts here to trap longs.
A weekly candle wick above $4,400 but close below could be a bull trap.
---
⚠️ Key takeaway:
Above $4,400 weekly close = bullish continuation → long-term $6.5k–$8k targets.
Fail to break $4,400 = short-term correction back toward $3.8k or lower.
Watch BTC at the same time — ETH almost never breaks multi-year highs alone.
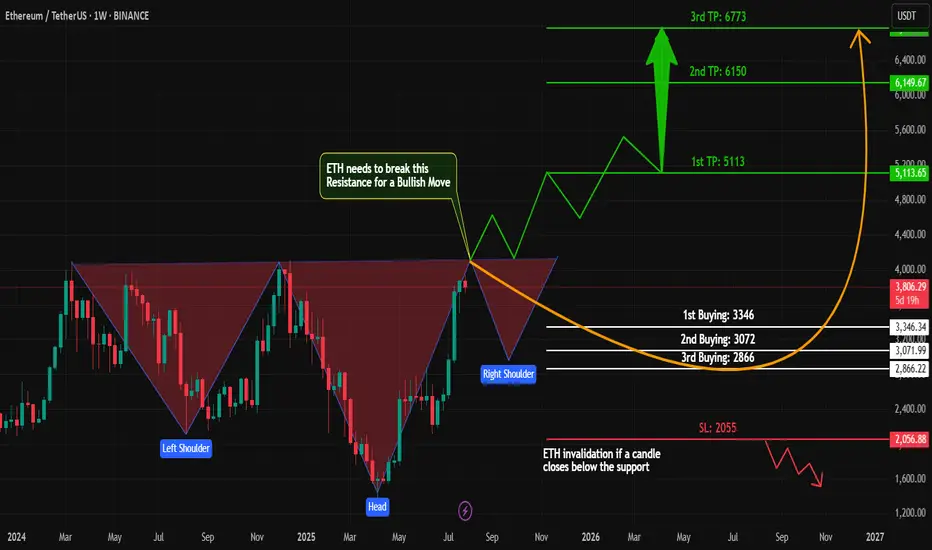
ETH Bullish – Inverse Head & Shoulders Pattern on Weekly Chart!Technical Analysis (Weekly Timeframe)
#Ethereum (ETH) is currently forming a strong bullish structure – the classic Inverse Head & Shoulders pattern – on the weekly chart.
✅ Left Shoulder ✅ Head
🟡 Now Printing the Right Shoulder...
This is a long-term spot trade setup, not for futures.
📈 Key Buy Zones:
1️⃣ First Buy: $3,346
2️⃣ Second Buy: $3,072
3️⃣ Final Support Buy: $2,866
We'll accumulate in these zones as #ETH forms its Right Shoulder.
🔓 Breakout Play:
Once #ETH breaks its All-Time High (ATH), we'll place a Buy Stop Order above the breakout level to ride the next big wave!
💬 Let me know what you think about this #ETH setup.
📌 Are you bullish on #ETH this cycle?
👍 Like, share & follow for more high-probability setups!
#ETH #Ethereum #CryptoTrading #TechnicalAnalysis #InverseHeadAndShoulders #LongTermTrade #SpotTrade #BullishCrypto #Altcoins #TradingView
head and shoulder againin 4 time frame i see a half head and shoulder in eth if it complet maybe marget goes down what do you think????
ETHEREUM WEEKLY CHART ETHEREUM weekly chart shows the retest of the current all time high supply roof of 5000k zone by heavy sell order from retail and institutional investors who are taking profit from the supply zone after a heavy bullish rally.
the rejection at 5000k zone is correct and it is based on market structure. This correction will be monitored for aggressive sell off.if we uphold the weekly candle close ascending trendline acting a dynamic resistance to upswing on three different occasion than we are looking for buy opening.
i see a break of the current high of 5000k to reach a high above 6000k region after a correction phase by market participants .
trading is 100% probability, manage your risk
protect your capital at all time.
no trade is better than a bad trade
think like a hunter,a hunter save his bullet for a big kill.
GOOD LUCK
AND START THE WEEK STRONG.
BYE.

ETH/USDTCurrently holding a local bullish structure. Within the corrective move, two key zones are marked where a potential reaction may occur.
Positions to be taken only after clear confirmation.

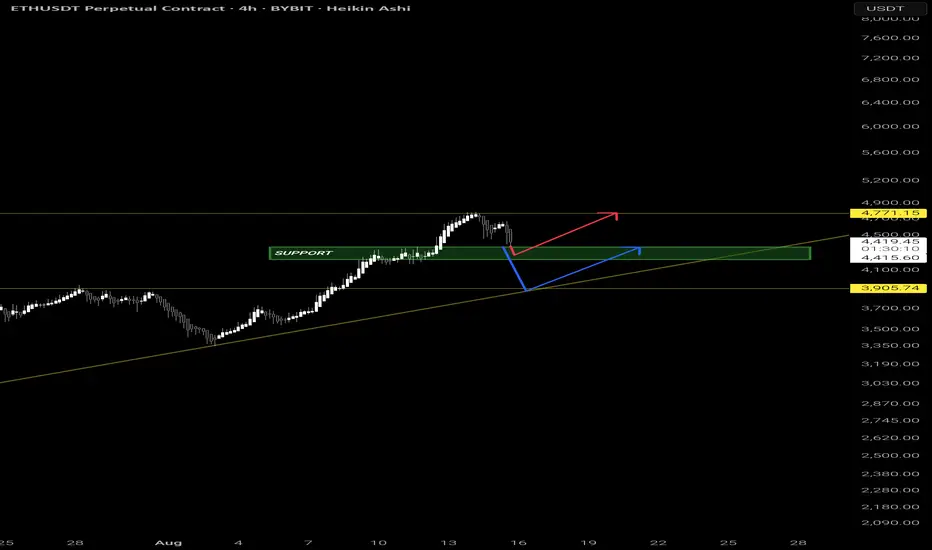
ETH POSSIBLE SCENARIOThe ethereum or the market right now is bullish, so we expect a bullish pattern. Hoping to see a bounce at key level support. Scenario 1 red line. Scenario 2 blue line.
ETHEREUM Ethereum is showing strong bullish momentum with growing investor interest and positive market dynamics, but as always, price fluctuations and profit-taking could happen near resistance zones.
but i want to see a push into 5000-5100 ascending trendline before correction. Its in a zone and will have to update the supply roof and take out the current all time high,

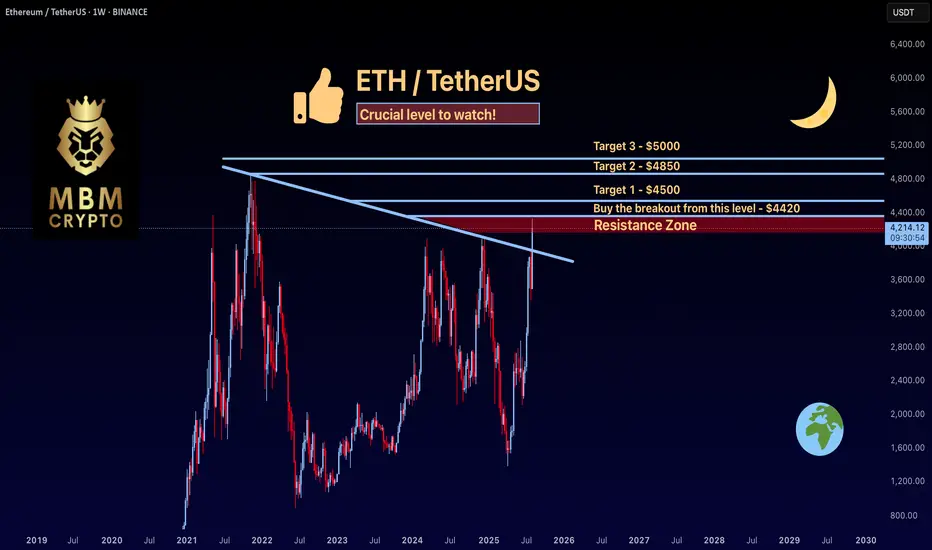
ETH: Crucial level to watch!ETH’s been on a solid run lately! If you didn’t catch the first wave, here’s a potential setup you might like.
-------------------------------------------
Trading Setup
If you’re considering trading ETH, here’s a quick setup that may help you.
The idea is: Buy when the price breaks above $4420 and take profits at the levels shown in the chart.
Targets:
1. $4500
2. $4850
3. $5000
-------------------------------------------
About our trades:
Our success rate is notably high, with 10 out of 11 posted trade setups achieving at least their first target upon a breakout price breach (The most on TW!). Our TradingView page serves as a testament to this claim, and we invite you to verify it!
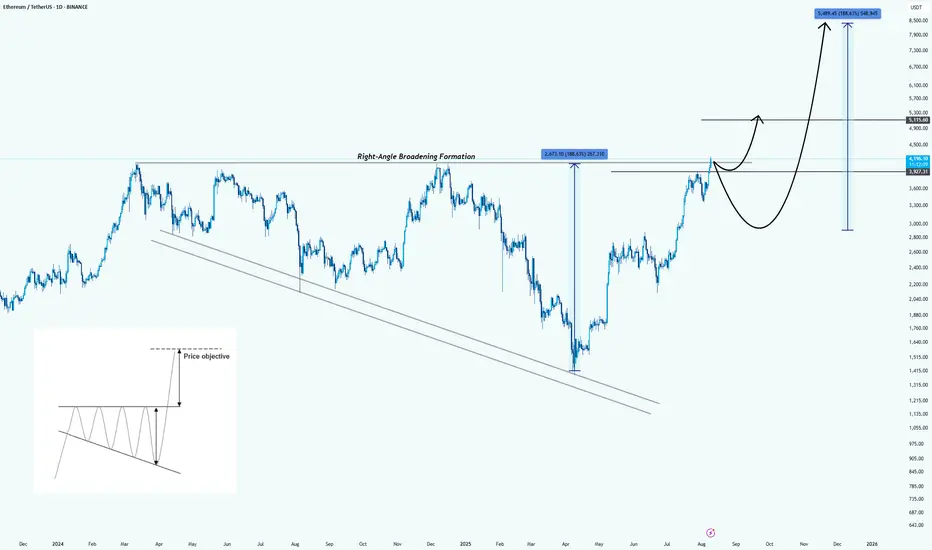
Ethereum: Formed a Right-Angle Broadening FormationHello guys!
Pattern Identified:
This is a Right-Angle Broadening Formation (characterized by a flat resistance level at the top (around $4,200 – $4,300) and a rising lower trendline). It shows increasingly volatile swings upward while repeatedly testing the same ceiling.
Technical Implication:
RABFs are typically bullish continuation patterns. The flat top acts as a breakout trigger, while the rising base indicates consistently higher lows and aggressive buyer support.
Price Objective:
According to the pattern’s measured move principle, the breakout target is projected by the vertical height of the formation, added to the breakout point:
Height : $2,070
Breakout point : $4,300
Target : $6,370 (first objective)
Extended bullish run could reach $8,500 if momentum sustains.
Key Levels:
Resistance: $4,200 – $4,300 (breakout trigger)
Support: $3,700, then $3,200
First measured target: $6,370
Extended target: $8,500
Bullish Scenario:
Strong daily close above $4,300 with volume could kickstart a rapid move toward the first target, possibly with only a brief consolidation at $5,100 before continuation.
my view on ethAfter carefully observing the current ETH price structure, I’m leaning toward a bearish bias in the short to mid-term.
As always, this is not financial advice — just sharing my personal view based on market structure and price action. Risk management remains the most important tool in this game.

Ready for correction?Hi there!
ETH is at ideal level where correction can start!
We can take look the BTC chart and it is the same story and the correlation between ETHBTC also!
Our most important level for watching is 3940 + -!
Good luck traders and Bears
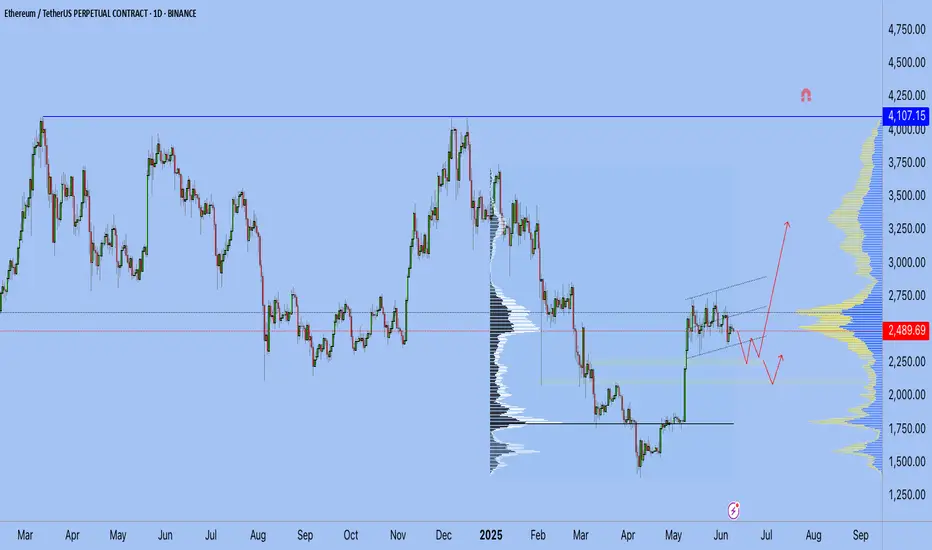
ETH update 9.06.2025Hello everyone, many of you asked me to publish my vision for ETH.
Here you go!
I believe that the previous impulse movement was only the first upward movement, and now we are in a sideways correction movement — call it what you will, but the fact is that the exit from this flat will be upward.
1. End of the year
2. ETH is accumulating on the Onchain
3. Liquidity overflow from BTC can be seen on the ETHBTC chart, and the overflow began at the very bottom
4. What else can large conservative players accumulate?
5. We are going after liquidity from above and should break 4100 by September
Best Regards EXCAVO
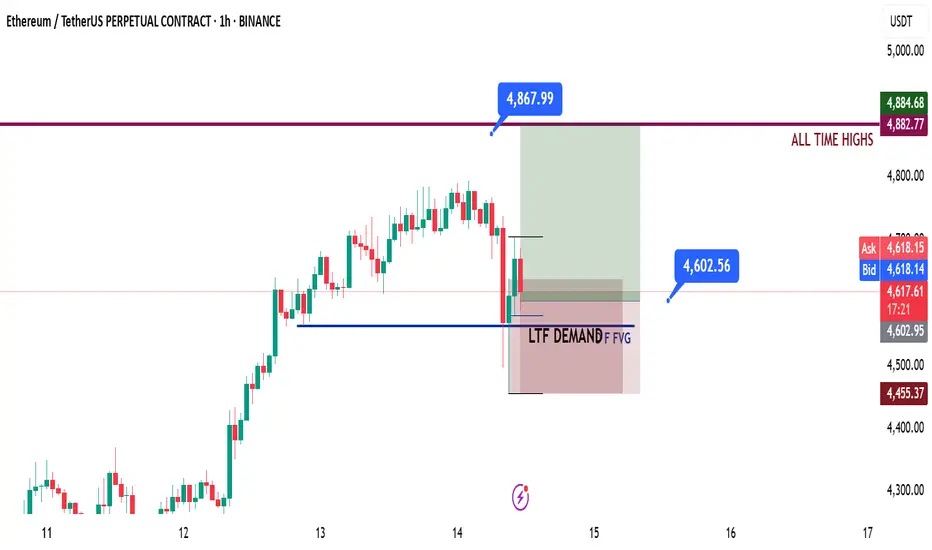
ETH Long Idea - Daily Recap - 14.08.2025📊 Market Sentiment
Overall sentiment remains bullish, supported by expectations of a 0.25% rate cut in the upcoming FOMC meeting. A weakening USD and increasing global risk appetite are creating favorable conditions for further upside in crypto assets.
Ethereum is approaching all-time highs, fueled by a $1B single-day ETF inflow. Additionally, rumors of potential SEC approval for Ethereum staking policy could directly boost ETH’s utility — strengthening the long bias.
📈 Technical Analysis
Price has pulled back to the daily fair value gap. HTF fair value gaps are historically strong zones for potential bounces.
📌 Game Plan
I expect possible expansion toward all-time highs here, as we have broken the LTF market structure.
📋 Trade Management
Entry: 4602$
SL: 4455$
TP: All-time highs at 4867$
💬 Like, follow, and comment if you find this setup valuable!
Disclaimer: This content is for informational and educational purposes only and does not constitute financial, investment, or trading advice. Always do your own research before making any financial decisions.
Ethereum ETH Pullback Into Support Could Lead to Another Rally📊 Taking a close look at ETH/USDT, the market has recently shown bullish intent after a break of structure on the daily 📈. From a Wyckoff perspective, price is currently reaching into a key resistance zone. Im looking for a retrace into support and, potentially forming an accumulation phase. I’ll be watching for a shakeout below support — followed by a strong rally. If this confirms with a bullish market structure break, it could offer a high-probability long setup 🔍💡🚀 (not financial advice).

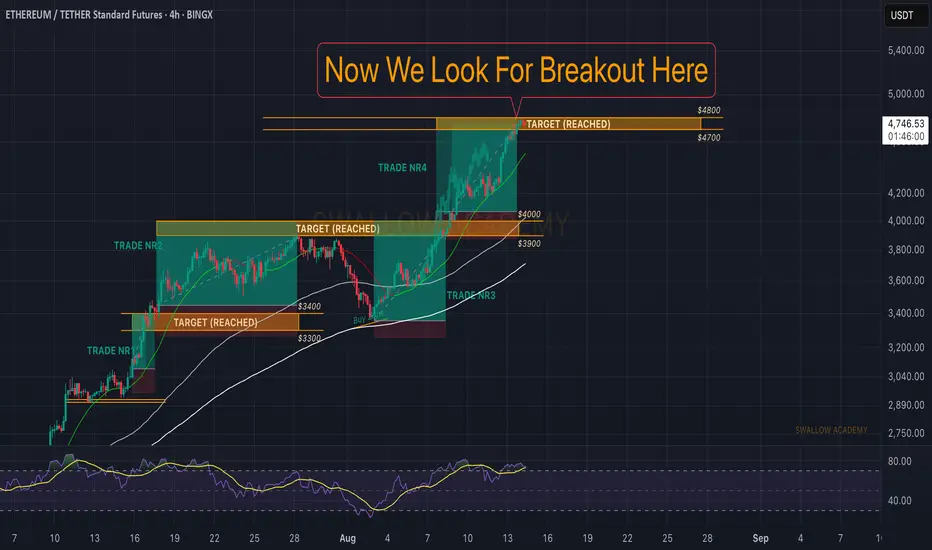
Ethereum (ETH): Now We Wait | We Hit All Targets 62% of market price movement combined—we caught up with all of you with 4 separate trades on ETH.
Amazing movement we have had so far, and now we start the worst part of trading, the waiting part.
We wait for a proper break of the local ATH zone, whereafter we will be aiming to see the $5000-$6000-$7000 areasreached.
Swallow Academy
ETH - 1H Elliott Wave Analysis - 15.08.25Greetings! We hit 100 Followers, welcome to all the new joiners :) Happy to have you here with us, thank you! ^-^
We assume the recent high was a Wave 3 and we are now looking for a pullback in a Wave 4 as an ABC. The Wave 4 support area lies between the 0.236 FIB at 4463 USD and the 0.5 FIB at 4121 USD. As we already entered the support area by touching the 0.236 FIB the correction could be over but we think it is more likely that that was only the A Wave of a bigger ABC correction.
The Wave B resistance area is between the 0.382 FIB at 4582 USD and the 0.886 FIB at 4754 USD. Be aware that B Waves resistance areas are not strong which makes B Waves harder to predict and trade. Additionally the B Wave could extend higher and take out the ATH in an overshooting B Wave especially with the bullish market sentiment we have around Ethereum at the moment.
Thanks for reading.
NO FINANCIAL ADVICE.
