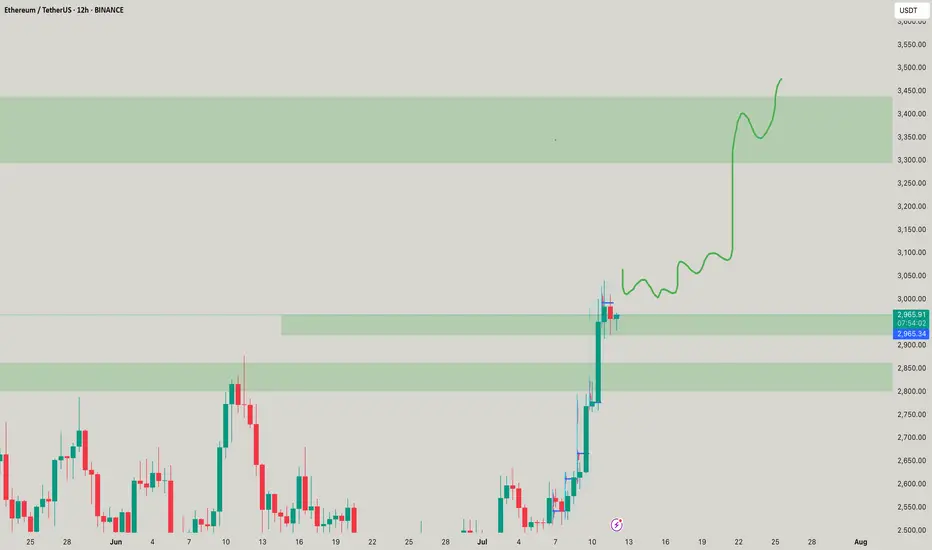
ETH ~ Ready for $3400?Its time foe eth the more time it stays up the more time it goes beautifully! Understand! Such a good move to be coming soon to your doorstep lol
ETHUSDT.P trade ideas
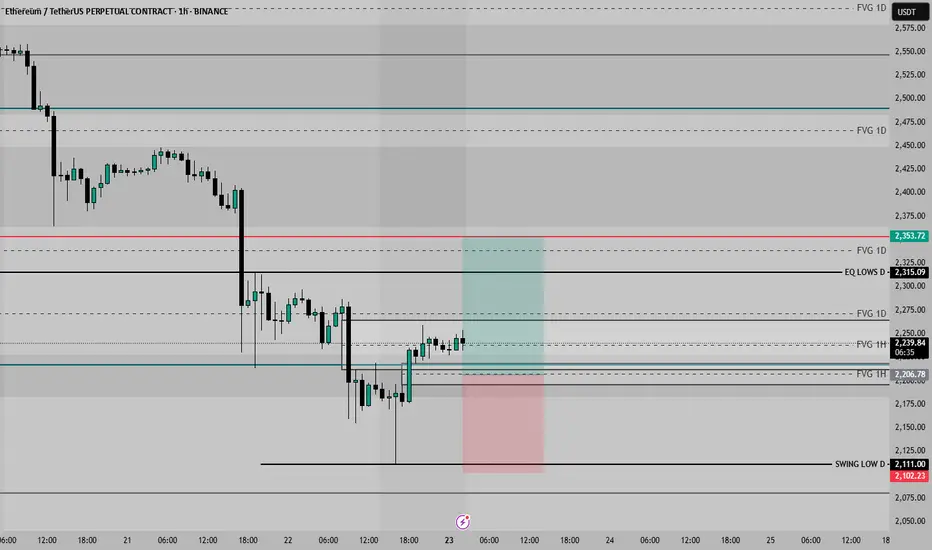
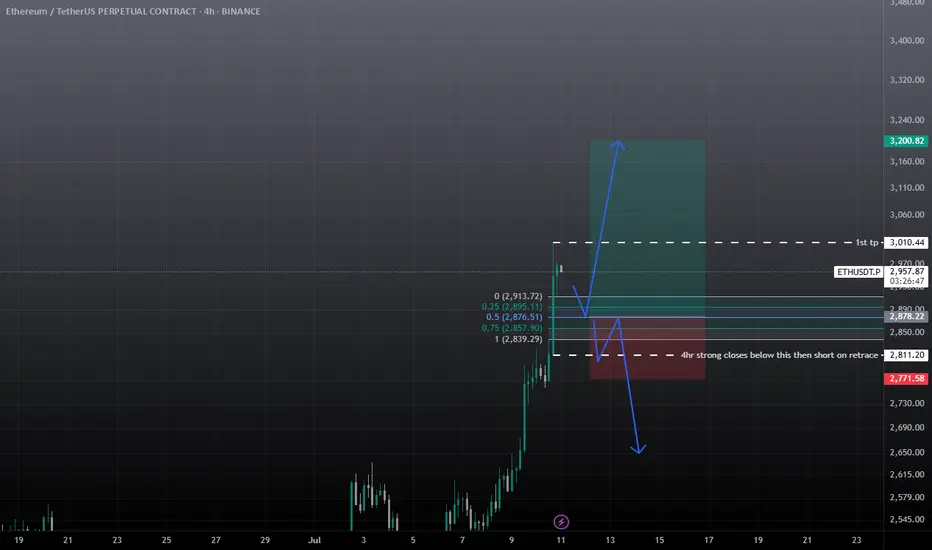
ETH TRADE IDEA 23 06 25If price retest this FVG, we could look for a long position
That equal highs are dangerous right now, but we could expect to form a BKR
Maybe a Futures Grid could be a great idea
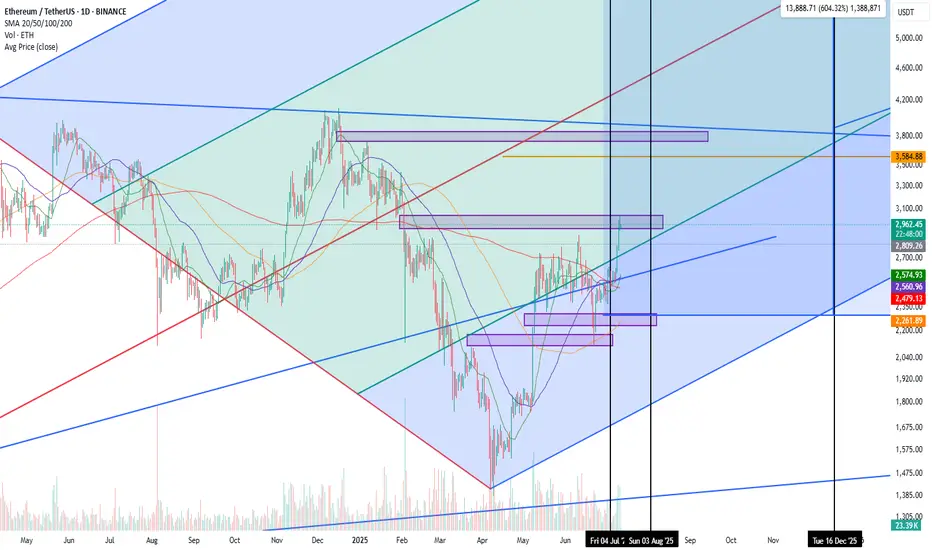
Ethereum’s Next Fair Value Gap is $3.8K — And the Road to $26K 🚀 Ethereum’s Next Fair Value Gap is $3.8K — And the Road to $26K Remains On Track
Ethereum ( CRYPTOCAP:ETH ) just reclaimed key structure — and despite a temporary pullback, all signals remain aligned for a parabolic breakout toward $26,000 this cycle.
Here’s why the next Fair Value Gap (FVG) sits near $3.8K, and why the Schiff Pitchfork structure still implies Ethereum is coiling for exponential upside in the coming months.
🔹 The $3.8K FVG: ETH’s Next Magnet
Looking at the daily chart:
The $3.8K zone is a clear untapped FVG (Fair Value Gap) from late 2021, created by a sharp breakdown candle that never got properly filled.
ETH is currently consolidating just below the $3.1K resistance band, and once that breaks, liquidity will naturally gravitate toward the next inefficiency — at $3,800–3,900.
This gap aligns with a previous supply zone and intersects with the upper resistance trendline from late 2021, creating a powerful magnet for price once momentum returns.
🔹 All-Time Schiff Pitchfork Still Intact
The Schiff Pitchfork structure drawn from Ethereum’s 2018 low through its COVID crash low and 2021 all-time high paints a highly disciplined range:
ETH is respecting the midline of the lower channel and recently bounced off the support of the median zone, with price now grinding higher within the ascending structure.
The upper band of the pitchfork intersects with price in late 2025 near the $26,000–28,000 zone, forming a natural cycle top target.
Historically, Ethereum has respected this long-term structure remarkably well — and this current move is no different.
🔹 Moving Averages & Bullish Market Structure
ETH recently flashed a Golden Cross — the 50-day SMA crossing above the 200-day SMA — which historically front-runs explosive upside in post-halving years.
All major SMAs (20/50/100/200) are now curling upward, creating a supportive launchpad.
Price is breaking out of the consolidation wedge that defined Q2 2025 — and has room to run toward $3.8K before meeting major overhead resistance.
🔹 Post-Halving Explosiveness
Let’s not forget: we’re in a post-halving year — and ETH has a consistent pattern of multiplying 5x–10x in the 9–12 months following Bitcoin halving events:
In 2017 (after 2016 halving): ETH went from ~$8 to $1,400 — nearly 175x.
In 2021 (after 2020 halving): ETH went from ~$120 to $4,800 — roughly 40x.
A move from the current ~$3K level to $26,000 is just an 8.5x — well within historical precedent.
🔹 Macro Tailwinds: ETH ETFs & Institutional Flows
BlackRock, Fidelity, and other asset managers are positioning Ethereum ETFs for approval, which would unlock billions in institutional inflows.
A staking ETF would dramatically compress supply — Ethereum already has over 27% of its supply locked — amplifying upside through supply-demand squeeze.
Meanwhile, stablecoin settlement volume is growing faster than Visa — all powered by Ethereum infrastructure.
🔹 Timing the Move: August to December Explosion?
The verticals on your chart highlight key windows:
A breakout window between early August and mid-September coincides with both macro liquidity injections and historical altseason patterns.
If ETH hits $3.8K by August, the runway to $8K–$14K opens by October, with $26K still well within reach by December 2025, in line with your pitchfork’s top boundary.
🟣 Summary: Ethereum’s Next Stop Is $3.8K — Then Moon
✅ Untapped FVG magnet at $3.8K
✅ Schiff Pitchfork upper boundary intersects near $26K
✅ Post-halving year + Golden Cross = Explosive setup
✅ ETH ETF narrative just beginning
✅ Structural breakout from consolidation wedge
Ethereum is no longer just the base layer of DeFi — it’s becoming the base layer of global financial infrastructure. And price hasn’t yet priced that in.
"If the internet had a price, it would be Ethereum."
Don’t fade this breakout. We’re still early.

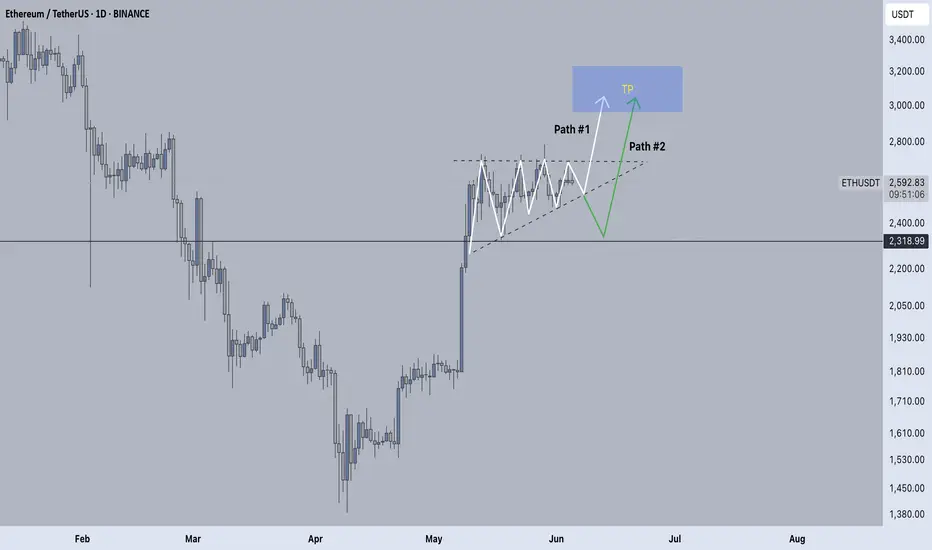
ETH Ascending TriangleETH has formed a clear ascending triangle pattern with a possibility of imminently breaking out to the upside. If rejected, we could see a breakdown to the ~2,300 support and subsequent rebound.
My bias is still bullish. We'll let the market tell us what happens and respond accordingly. Worst case scenario is more boring consolidation.
Stay patient.
Happy trading,
Melonfarmer
ETH - Lots of Crazy Important LinesPlease refer to our previous post:
Some of the colors of the lines have changed, but the trajectory stays the same.
One of the most important trendlines we have been fighting (red trendline) is seeing the first daily candle try to close above it. Right now ETH is fighting the pivotal $3k psychological level, but if price is able to break above we could see a swift move towards the green trendline.
Depending on when price could visit the green trendline could put price anywhere between $3,400-$3,500.
All these lines will probably play a role in the future of price action so I have extended them to watch how prices handles these levels in the future.

Ethereum Wave Analysis – 11 July 2025- Ethereum broke resistance zone
- Likely to rise to resistance level 3140.00
Ethereum cryptocurrency recently broke the resistance area lying at the intersection of the key resistance level 2885.00 (which has been reversing the price from February) and the resistance trendline of the daily up channel from June.
The breakout of this resistance zone accelerated the active impulse waves 3 and (3).
Given the predominantly bullish sentiment seen across the crypto markets, Ethereum cryptocurrency can be expected to rise to the next resistance level 3140.00 (former support from December and January).

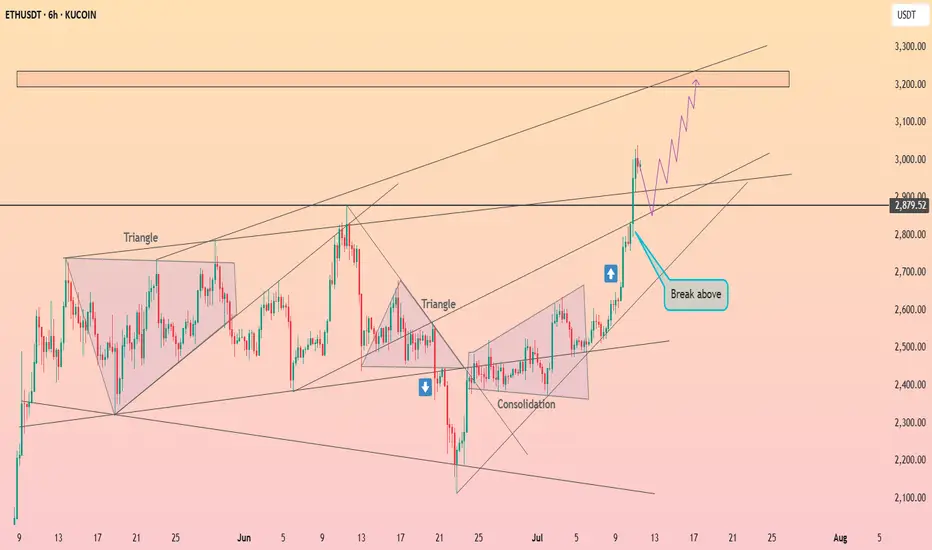
HolderStat┆ETHUSD seeks to $3200KUCOIN:ETHUSDT surged after breaking out of a triangle and pushing through multiple resistance levels. The latest move above $2,900 confirms a bullish continuation, with $3,200 as the next major zone. Consolidation below resistance has built the base for the current rally.
ETH long term outlook 2025-2028 (crystal ball version)Based on time fibs and fib projections.
No financial advice.
If ETH pushes up, looking at a pull back starting early to mid september, then retrace to 0.5 fib and push up into dec. After which possibly come back and test the 4k area where price broke out from. Next push up with a top in Mar/April.
The next is purely speculative (as is this whole post).
Deep retrace after local top in April26, to the 3k level.
If price finds support at 3k, then the next leg up has a chance at 9k end of 2027, Jan 2028.
Otherwise, if support doesn't hold, continuation down into bear market.

Ethereum (ETH): Strong Breakout Happened | Targeting $3200-3300 Ethereum had a strong breakout, and we are getting closer and closer to our major target of $3200-3300.
A smaller target of $3000 has been reached and we see that after smaller rejections, buyers still keep the pressure, so our major target remains the same
Swallow Academy

ETHUSDTHere is a great move for ETH after a long time.
So I can recommend some levels to trade and bullish move has been started.
good luck
DYOR!
ETH Wyckoff Re-AccumulationETH (and many of the major altcoins) has a macro re-accumulation going on right now. The targets would be well beyond our current all-time highs. There has been a lot of bullish news recently with large investors buying heavily into ETH, which should act as a catalyst to jump-start the mark-up phase of this re-accumulation and "Jump Across the Creek" as they say.

ETH New Analysis (12H)This analysis is an update of the analysis you see in the "Related publications" section
The previous analysis is still valid | its timeframe is higher, but in this update, we've moved to the lower timeframes.
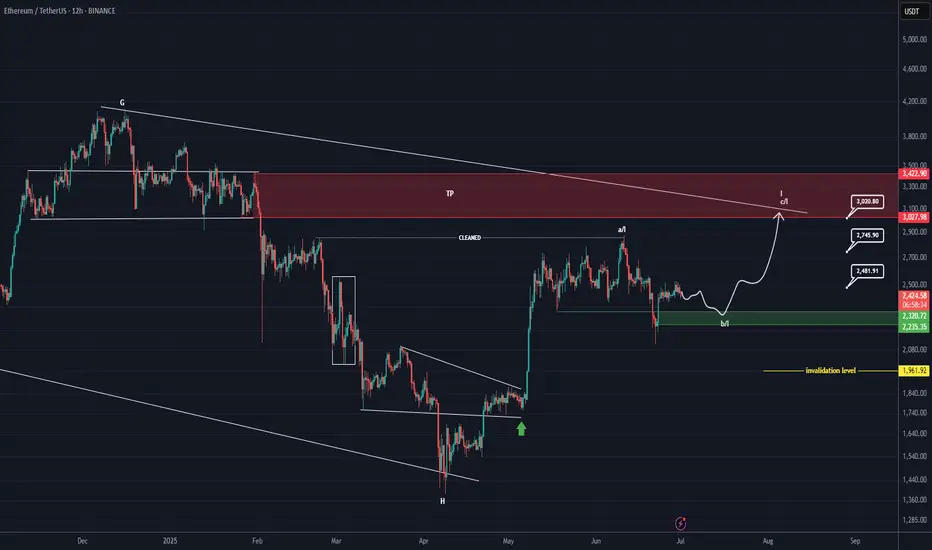
It seems a valid bottom has been formed on Ethereum, and we may not see a lower low, provided that the price doesn't move higher first but instead drops directly into our support zone. If that happens, the price could potentially move upward from there.
Ethereum seems to be searching for a support zone to reach higher levels. The marked area could potentially launch the price upward.
In this analysis, the support zone, targets, and invalidation level have been updated.
For risk management, please don't forget stop loss and capital management
When we reach the first target, save some profit and then change the stop to entry
Comment if you have any questions
Thank You
ETH Long / Buy SetupAs of many times mentioned that, will short eth above 3k or 3k, but it still shows Bullish momentum no sign of weakness, maybe this entry triggers during weekend due too low volume, search for ifvg, if any 1D or 4hr Bullish fvg truns into bearish ifvg then will take short on ETH. For now will take long with SL and proper risk management.
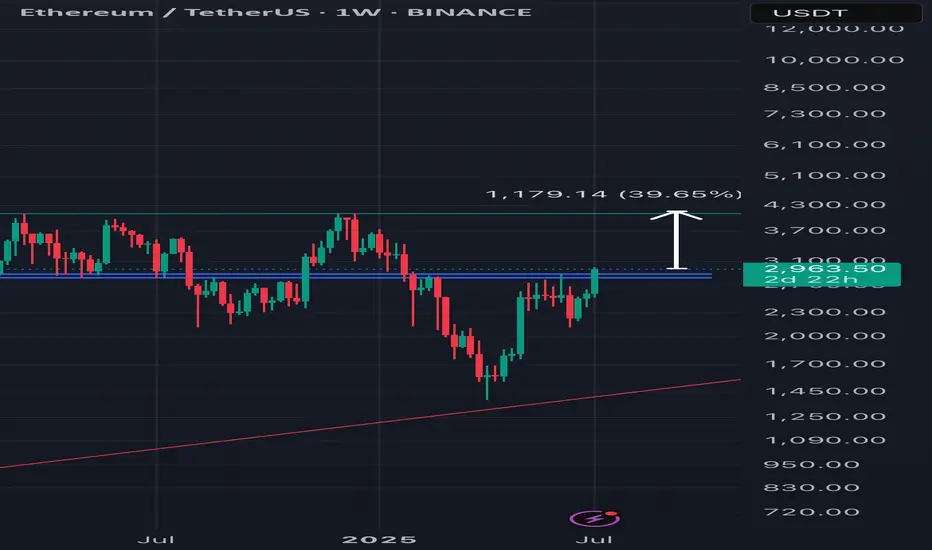
EthusdEasy target here if it can keep pushing above 3k and the weekly ends above it it will sure go to 4k where is a good point to sell . Alt season it’s starting now
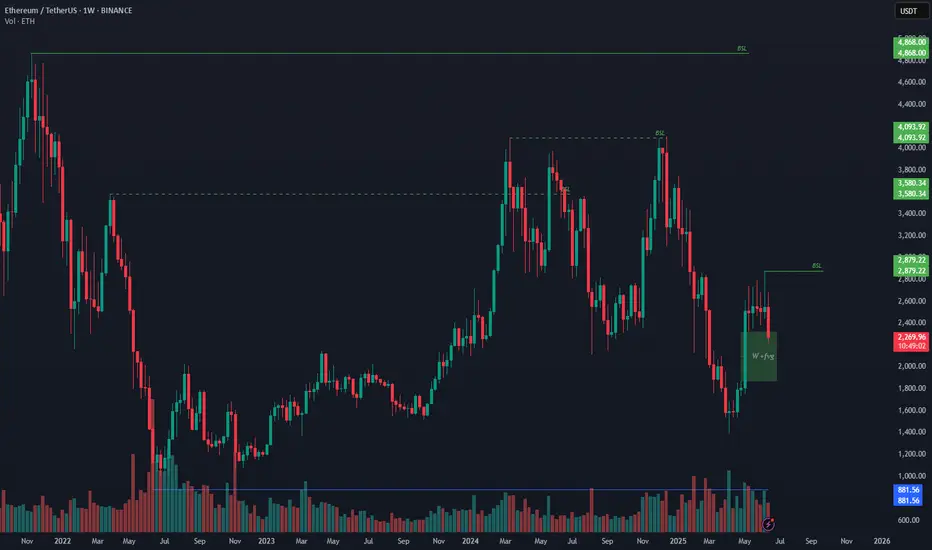
Ethusdt bullish cup and handle dailyEthusdt is forming a big cup and handle pattern in daily time frame. A close above 2850 in daily time frame may activate the pattern.
Targets are 3300, 4000 and 5500
Pattern invalidation: A close below 2100

Long trade
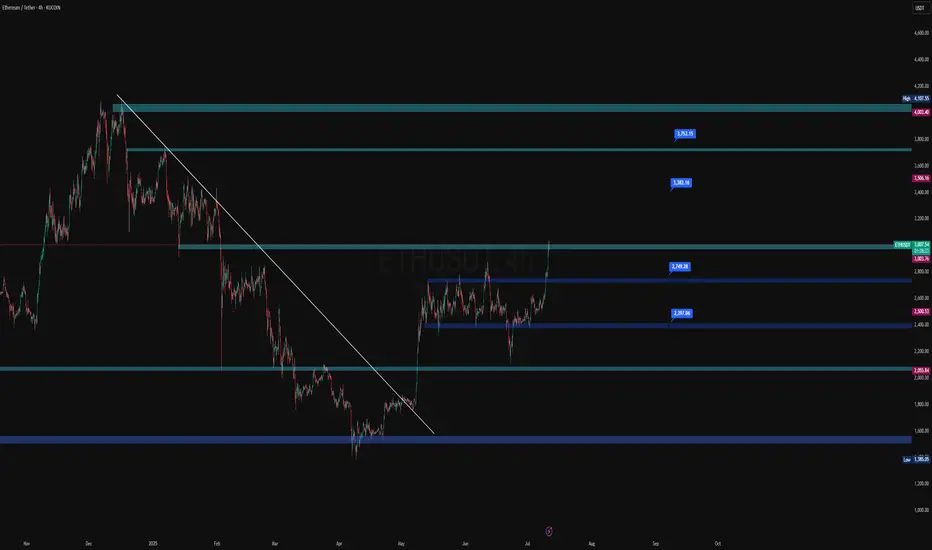
ETHUSDT 4H Chart Analysis
Date: Sat 05th July 2025, 4:00 PM
Session: London to NY AM
Key Trade Details
Entry: 2,515.17
Profit Target: 2,864.44 (+13.89%)
Stop Loss: 2,479.01 (−1.43%)
Risk-Reward: 9.66
Key Reasons for the Trade:
Bullish Breakout above 2,515, supported by strong volume surge.
Price Above EMA & WMA: Clear trend confirmation.
Strong Momentum: The RSI is overbought, indicating bullish strength, but watch for a potential short-term pullback as the price approaches resistance.
Target Zone: Prior resistance cluster at 2,820–2,860.
Current RR in Play: Trade already moving

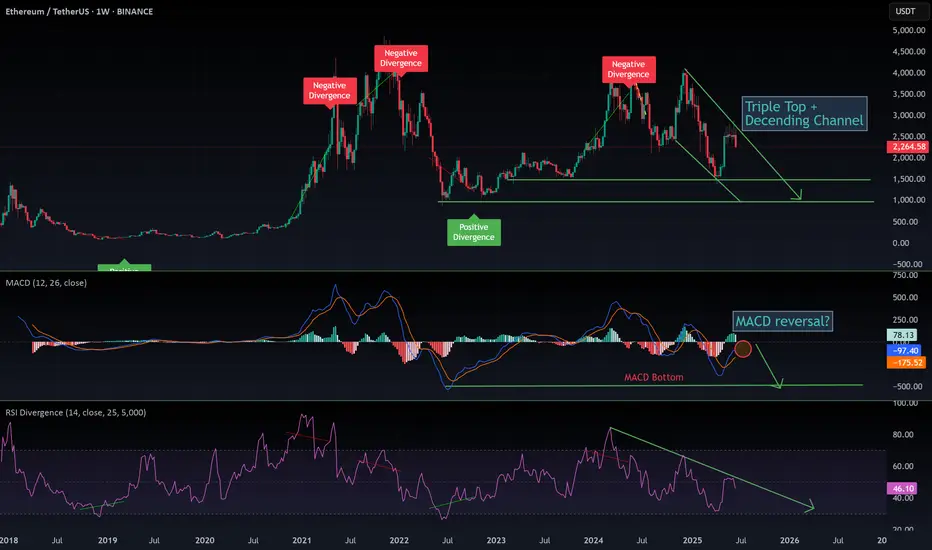
$ETH: The 1-week chart is an absolute disaster!Once again, I want to make it clear: I’m naturally a bull. But I live in Thailand, far from the noise of influencers shouting "buy, buy, buy!" I’ve learned my lesson—when they scream buy, you get rekt. That’s why I rely solely on the charts.
Charts are just mathematics—they don’t lie. So here’s my honest interpretation of what I’m seeing for Ethereum:
🕐 Daily Outlook
Yes, we might see a few nice bounces in the short term. But if your plan is to hold ETH, you should be paying attention to higher timeframes, especially the weekly.
📉 Weekly Chart — It's Ugly
We’re clearly in a descending wedge, and overall, ETH is bearish. Don’t be fooled by the hype or the people trying to take your money.
- RSI is bearish, with a strong bearish divergence still unfolding.
- MACD is on the verge of a bearish crossover, and what’s worse, it’s doing that without even touching the neutral zone—a major red flag.
The last time we saw this setup? November 2021. The price crashed below $1,000.
🔍 Where’s the Support?
This cycle, the support zone looks closer to $1,500, mainly due to institutional interest and the ETF narrative. A full retracement seems unlikely, but technically speaking—it’s still a possibility.
🤔 Why Is This Happening Despite Institutional FOMO?
Here’s the key: ETH has staking, and every month, new CRYPTOCAP:ETH is minted to pay stakers. This creates constant inflation. On top of that, many stakers compound their rewards, accelerating the inflation. And guess what? These same stakers are selling as soon as ETH pumps.
So fundamentally, Ethereum is under pressure because of its own staking mechanics—a system flaw that creates long-term selling pressure.
Do your own research (DYOR). I could be wrong—but at least I’m not trying to sell you a course.
$ETHUSDT: Uptrend signal in the daily timeframeEthereum is ready to move higher, as I anticipated when the BINANCE:ETHBTC signal flashed...
Best of luck lads!
Cheers,
Ivan Labrie.

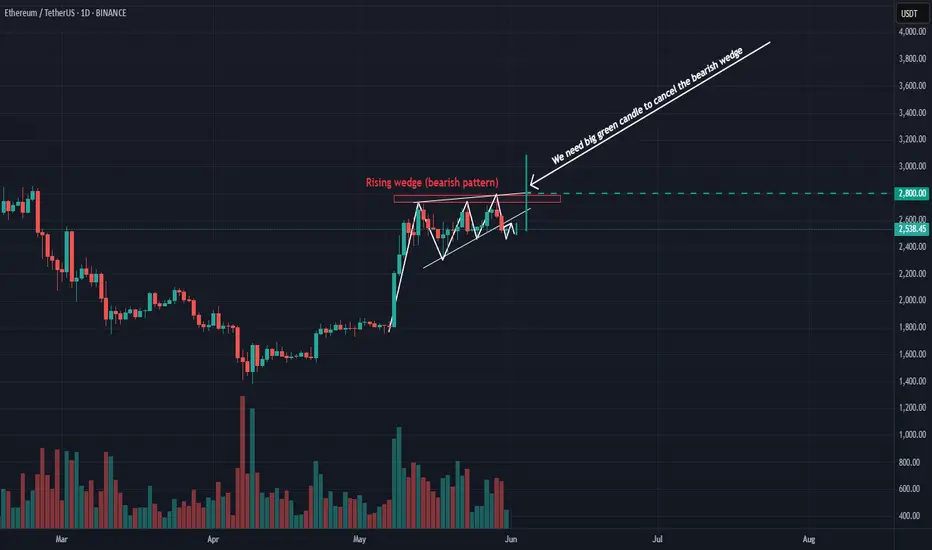
ETH Needs big money injection ASAPRising wedge presented in the chart is a bearish pattern.
To cancel this bearish pattern we need :
- Break the $2,800 level with bigh green candle
- The break should occur with big volume
- The break should be as soon as possible.
Otherwise, the downtrend will continue and he decline will be sharp.
COINBASE:ETHUSD BITSTAMP:ETHUSD CRYPTOCAP:ETH CRYPTOCAP:ETH.D
Ethereum & monthly 20MAEthereum is gaining strength and will likely break above the monthly 20 MA. Will it maintain this momentum by month's end and remain bullish in the coming months?
Good luck HODLRS ✌️🤞

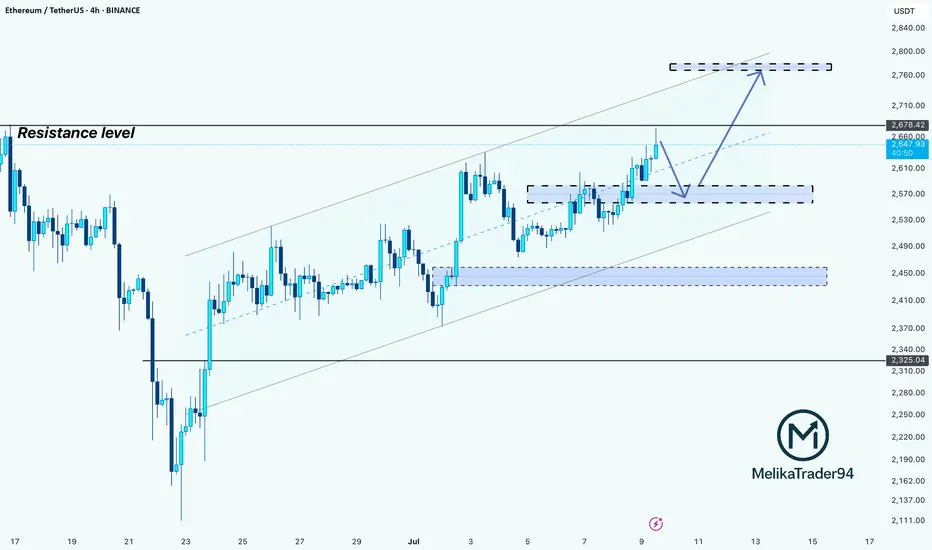
ETH Pullback Before Next Rally? Hello guys!
Ethereum is currently testing a strong resistance zone around the $2,678 level, which has previously acted as a key barrier. Price action has been climbing steadily within an ascending channel, indicating a clear bullish trend in play.
However, since ETH is right at the resistance, we could see a short-term correction or pullback toward the $2,560–$2,580 support range (highlighted zone), which also aligns with the midline of the channel and previous consolidation structure.
If this support holds, a healthy bounce from this area would likely push ETH toward the next bullish target around the $2,760–$2,800 zone, which sits near the upper boundary of the current channel.