Eth revealed If you want to know the simplest way to trade in ETH for the next few years.
This is how Eth is moving.
We will discuss this further in January 2027.
ETHUSDT.P trade ideas
Why You Still Lose Money Even With Perfect AnalysisYour setup was on point, your entry was clean, your stop-loss was tight.
Everything looked perfect.
And yet, you still lost.
Maybe the real issue isn’t in your chart, maybe it’s in your head.
Hello✌
Spend 3 minutes ⏰ reading this educational material.
🎯 Analytical Insight on Ethereum:
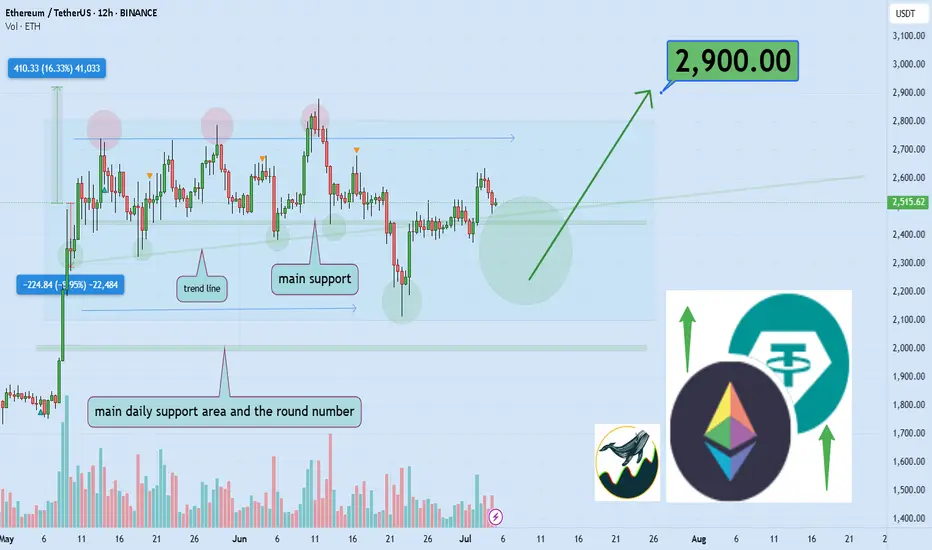
BINANCE:ETHUSDT is currently trading inside a well-defined parallel channel 📈. It is approaching a key daily support level that coincides with an important ascending trendline. A breakout above this channel could lead to a bullish move, targeting at least a 16% gain with a primary resistance zone near $2900 🚀. Monitoring how price reacts around this area will be critical for confirming the next leg up.
Now , let's dive into the educational section,
🧠 Analysis Is Half the Game
Having a clean technical analysis doesn’t guarantee anything if your behavior ruins it.
Most traders change their minds mid-trade because of fear, hope, or noise from other sources.
Market psychology doesn’t always respect your Fibonacci retracement. You might be right and still lose because you couldn’t hold on to the plan.
🕒 Don’t Enter Before the Market Does
Timing is underrated. Many traders get in too early. Your analysis may predict a breakout, but price isn’t ready yet.
Zoom out. A solid setup on the 1-hour chart might need confirmation from the 4-hour or daily.
A great trade is not just where you enter, but when.
😤 It’s Not the Chart — It’s Your Mind
Many times, the chart setup is perfect. But when price wobbles a bit, you lose confidence.
Imagine this: a clean uptrend, higher highs forming, but a small retracement hits and you close the trade. Why? Fear. Not logic.
You lost not because of analysis, but because you couldn’t handle being right under pressure.
📊 TradingView Tools: More Than Just Indicators
If all you're using in TradingView are the typical RSI or MACD indicators, you're barely scratching the surface.
Tools like Bar Replay can simulate real-time reactions to past price action, not just for backtesting, but for testing your discipline under real psychological pressure.
Try this: pick a point where you lost money despite solid analysis. Use Bar Replay and “re-live” the chart without knowing what happens next. Was your entry early? Did you panic exit? Or did your stop-loss placement ignore structure zones?
Also, use the Long/Short Position Tool to visually plan your risk/reward, and adjust your bias if the chart structure doesn’t validate it.
For those wanting a deeper layer, add Volume Profile Fixed Range to identify value zones, where whales are active, and overlay it with your own trade setup.
TradingView isn’t just a charting platform. It’s a behavioral mirror. You don’t just look at the chart, it shows how you act when money’s on the line.
🎯 Your Stop-Loss is for the Chart, Not Your Emotions
If your stop-loss is placed based on what feels safe rather than key market structure, you’re not trading the chart. You’re managing anxiety.
Let structure dictate where your risk lies, not your nerves.
😬 Not Executing = Not Trading
If you don’t follow through with your own trade plan, your analysis is meaningless.
Did you cut early just because a big red candle scared you? Or because someone tweeted a bearish take?
That’s not discipline, that’s reactive trading. It has nothing to do with your original logic.
📉 Losses Are Part of Trading… But Not These Ones
There’s a difference between calculated losses and emotional mistakes.
The first is expected, even professional. The second will drain your account and confidence.
Take losses when the plan fails, not when your emotions freak out.
🔍 Reverse-Engineer Your Entry Logic
Next time you trade, take a screenshot and write down your full reasoning.
Why this entry? What did you see? How will you exit?
Later, go back and compare it to what actually happened.
This habit alone can fix more issues than a dozen trading books.
💡 Perfect Analysis ≠ Profitable Trading
Analysis opens the door, but execution and consistency keep you in the room.
Most traders think the problem is their indicator, but it’s usually the part of themselves that doesn’t listen to the indicator at the critical moment.
🧠 The Power of “Logged Experience”
The real difference between amateurs and veterans isn’t screen time. It’s tracked behavior.
Use TradingView’s built-in Note feature, place icons or comments on every trade setup, and keep a record of your actual thought process.
That feedback loop is gold. It builds self-awareness, the rarest edge in trading.
📺 Make It Visual to Make It Stick
Don't rely solely on indicators.
Use Chart Pattern Drawing Tools, head and shoulders, flags, triangles, and reinforce visual memory.
Also, by managing Visibility Settings, you can keep your charts clean while viewing different structures across timeframes.
The result? You start to see the story behind price, not just numbers.
🔚 Final Thought
If you're still losing money with accurate analysis, maybe it’s time to analyze your reactions instead.
TradingView gives you the tools, but the real upgrade is learning to trust your system under stress.
✨ Need a little love!
We put so much love and time into bringing you useful content & your support truly keeps us going. don’t be shy—drop a comment below. We’d love to hear from you! 💛
Big thanks , Mad Whale 🐋
📜Please remember to do your own research before making any investment decisions. Also, don’t forget to check the disclaimer at the bottom of each post for more details.
ETH Short setupETH showing some weakness, manual SL if 4hrs candle closes above the mentioned point then must close the trade don't hold and wait for the new setup.

ETHUSDT Swing Trade AnalysisEth still struggling to break weekly bearish fvg, rather it's bullish or bearish, it must revisit the orange line which is daily bearish fvg, if it taps this and drops then a good sign , if it doesn't tap this and drops then it's a bad sign for eth, 3rd scenario is if we get any 4hr closing above the green line then I will not take the short and close short on the entry price, then I will short from the 3k area till 2.8k for scalp, if eth rejects from orange line 2583 then I will hold the trade till tp2. short only from the mention zone, if it doesn't tap the bearish fvg i will share another short trade with extended tps. remember that that yellow zone is important eth must retest it or break it to be bullish, without tapping this and drops then it's not a good sign for eth.

ethererum
how to play around crypto and win the day
every crypto traders needs to know the following before taken any action.
(1) US10Y
(2)DXY
(3) GREED AND FARE INDEX
(4) BTCMARKET CAP CHART FOR CAPITAL INFLOW AND OUTFLOW.
(5) US FED INTEREST RATE DECISION.
(6) BITCOIN DIRECTIONAL BIAS AND SEASON(BULL/BEAR)
#SHAVYFXHUB #BITCOIN #BTC #CryptoTrading #Ethereum #Solana #AVAX #BNB #CryptoEducation
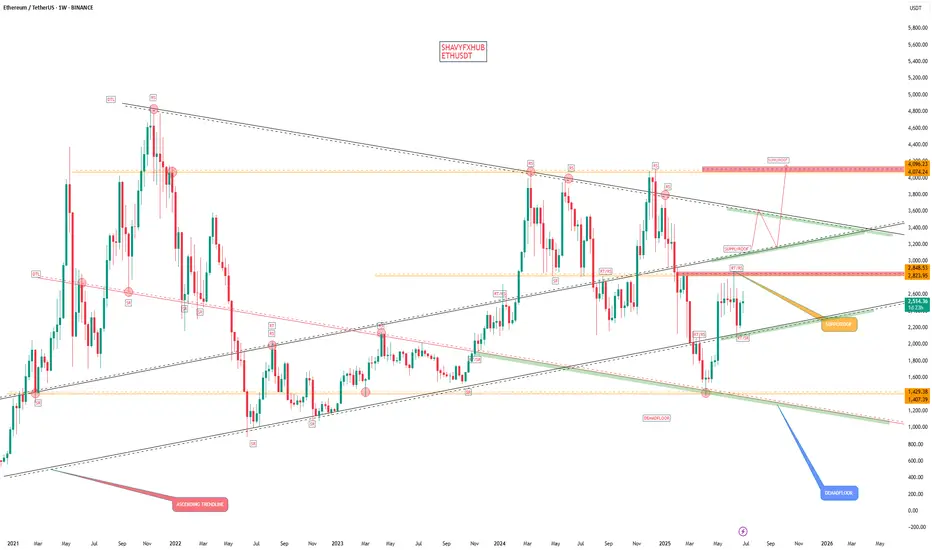
ETHEREUM ETHUSDT is awaiting a directional bias .but at the moment it has to break a weekly supply roof and sustain the gains as buy confirmation.

ETH BEARISH AT RESISTANCE ETH rejecting daily resistance, likely price will look to find supports at zones marked below
DYOR

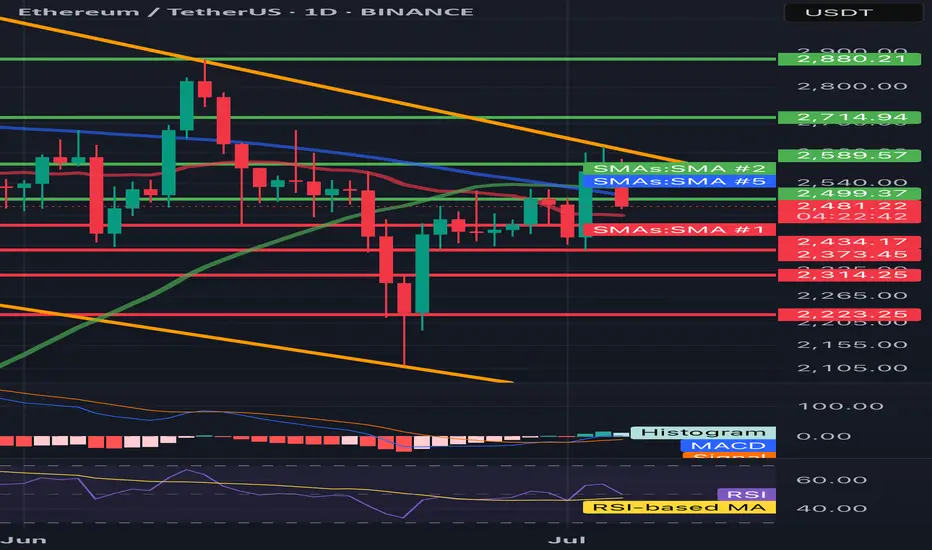
ETH/USDT 1D🔍 ETH/USDT - technical analysis (1D interval):
📉 Price: 2478 USDT (-4.36%)
🔧 Resistance:
• SMA 200 (green): ~ 2589
• Resistance zone: ~ 2715 → 2880 USDT
• SMA 100 (blue): ~ 2500 (just rejected)
🔧 Support:
• SMA 50 (red): ~ 2434 - currently tested
• Strong support: 2373, 2314, 2223 USDT
📊 indicators:
• MacD: freshly intersected, but the momentum is weakening
• RSI: ~ 45 - neutral/weak, under 50 (no bull strength)
• Trend: Still in the downward channel (yellow trend lines)
⸻
⚠️ Conclusions:
• Price rejected from 2500 (SMA 100) and flies down.
• If 2434 falls, a further discount is possible to 2373–2314.
• Lack of bulls with key resistance - the inheritance scenario dominates.
• Watch behavior at 2434 - this is now a key level.
ETH/USDT at Critical Decision Point: Breakout or Rejection AheadETH is pressing into a major confluence zone between two key trendlines. Price is currently testing both diagonal resistance and horizontal support, making this a pivotal area to watch 👀
📍 Scenario 1 – Bullish:
If ETH can break above Resistance Zone #1 and hold, there’s clear upside toward $2,900 (Resistance Zone #2). A confirmed breakout could mark the start of a new short-term uptrend.
📍 Scenario 2 – Bearish:
Failure to hold Support Zone #1 could send price back into the lower range, with $2,300 and $2,100 in play. Watch for rejection from the descending trendline and a break of the rising channel.
This post is for educational purposes only — not financial advice. Use your own judgment and proper risk management when trading.
#ETH #Ethereum #TechnicalAnalysis #TradingView #BreakoutWatch #SupportResistance #CryptoTA #QuantTradingPro

Ethereum Technical Analysis – Key Support Levels to Watch!🚨 Ethereum Technical Analysis – Key Support Levels to Watch!
After a strong rally in recent days, Ethereum (ETHUSDT) is now experiencing a healthy correction. The $2,440 zone is currently acting as a crucial support level that could determine the next move.
📉 If price breaks below this level, the next major support lies around $2,270, which could become a key area for bulls to step in again.
💡 All the important support and resistance levels are clearly highlighted on the chart. This is a must-watch zone for short-term traders!
🔔 Follow for more daily updates on Ethereum, Bitcoin, and altcoin setups!
#ETH #Ethereum #CryptoAnalysis #TradingView #TechnicalAnalysis #ETHUSDT

ETH SWING TRADEETH Showing strong momentum against BTC, July is also good for eth and some alts, maybe we see correction in Aug, September but before expected pullback towards 2.9k-3k. Must use SL as market is very Volatile these days.

HolderStat┆ETHUSD correctedKUCOIN:ETHUSDT is moving inside a rising wedge after reclaiming support near $2,500. Recent breakout from consolidation supports a continuation push toward $2,720–$2,760. The current trendline structure and bullish price action suggest upside potential.
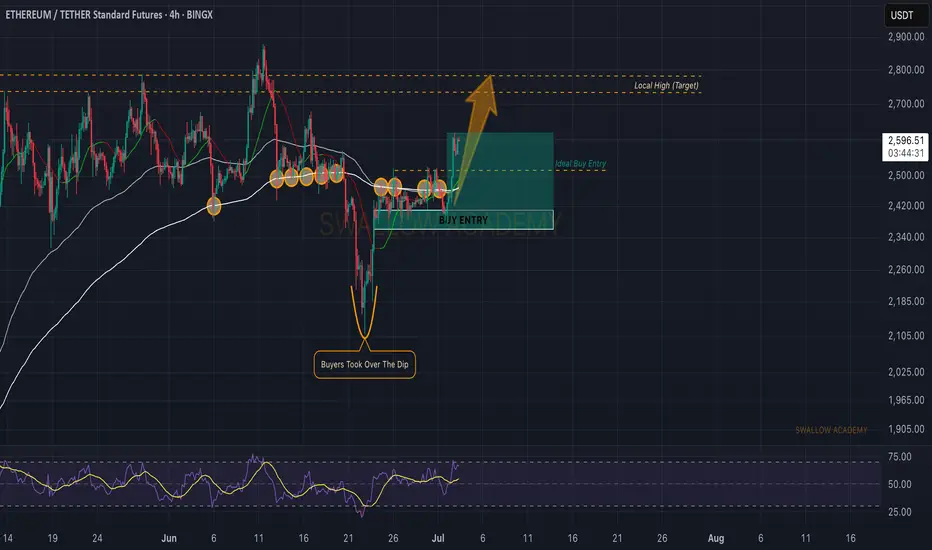
Ethereum (ETH): $2800 Is Next TargetEthereum had a good rally where buyers took control over EMAs, whereafter a successful retest, buyers are back in the game (hopefully).
We are starting to look for another long entry on the COINER at $2,600; once we see a proper BOS in this region, we will be opening a long position.
Swallow Academy

ETH Bullish Update
Ethereum is looking bullish, and is respecting clearly defined support and resistance levels.
In my primary count, we have finished black wave 1. The question is to determine if black 2 is already finished, which could lead to strong upside.
There is no way to know without further price action, and a break of green resistance is a very bullish signal.

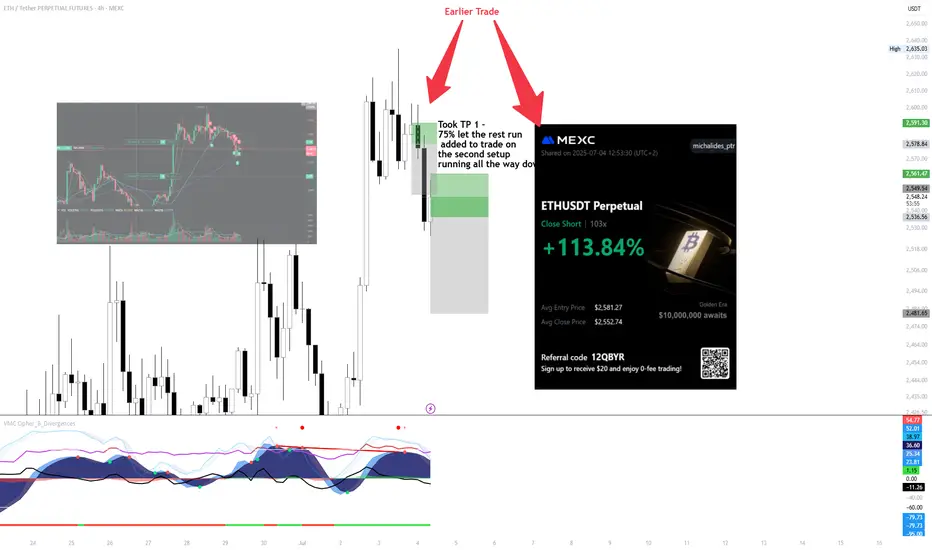
ETH SHORT SCALP ! to 2500
Executed an ETH short from the earlier setup — took 75% profit at TP1, then let the rest run.
Price pulled back into the secondary zone, added to the position with structure confirmation.
Let it roll into the next leg — clean execution, solid momentum follow-through.
+113.84% on the full move, managed with scale-out and conviction on the retest.
Patience paid. System did the work.
Momentum Reload: Next Scale-InHello traders,
First position still floating. The scale-in has been executed. The structure is clear, and the positioning, sequence, and entry are all solid. I'm comfortable taking a potential loss on this position. Stops from the previous trade have been moved to the current stop-loss level, making the overall position risk-free.
I'll release a video soon to walk you through the details.
Stay safe chads! Peace
MEXC:ETHUSDT.P
BINANCE:ETHBTC
CRYPTOCAP:TOTAL

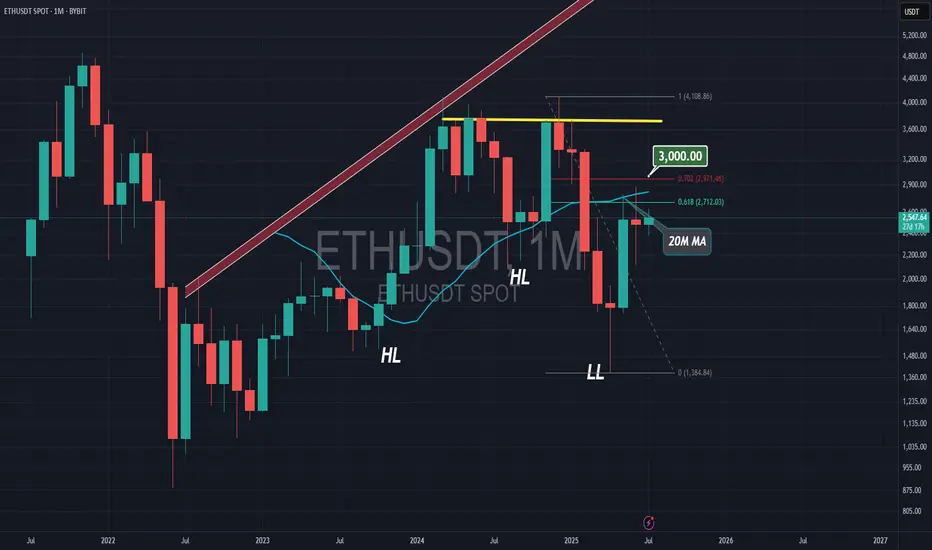
Ethereum in JULYEthereum should close above $3000 by the end of July to stay in the bull run, Monthly candle is so important now.
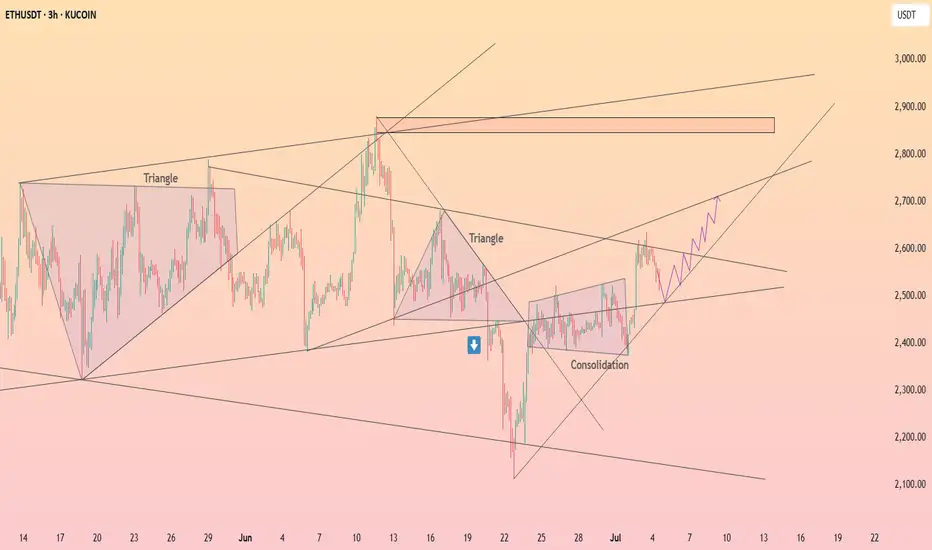
ETH/USDT – Symmetrical Triangle Breakout Setup (1H Chart)After a strong bullish impulse, ETH is consolidating in a symmetrical triangle formation — a classic continuation pattern. Price is coiling up near the apex, with higher lows forming against a horizontal resistance line.
Setup Highlights:
Pattern: Symmetrical Triangle (1H)
Trend: Bullish continuation after breakout
Entry Zone: ~2592 USDT
Target: 2679 USDT (upper green box)
Stop Loss: Below 2561 USDT (lower red box)
Risk-Reward: Favorable R:R structure
Watching closely for a decisive breakout above the triangle resistance to confirm bullish momentum continuation.
Let me know what you think — bullish continuation or fakeout risk?
#Ethereum #ETHUSDT #CryptoTrading #TechnicalAnalysis #BreakoutSetup #TradingView

HolderStat┆ETHUSD seeks to the $2750 levelBINANCE:ETHUSDT is holding above 2,350 and breaking out of consolidation within an expanding wedge. With structure pointing to bullish continuation, a move toward 2,800 is likely if this support level continues to hold.

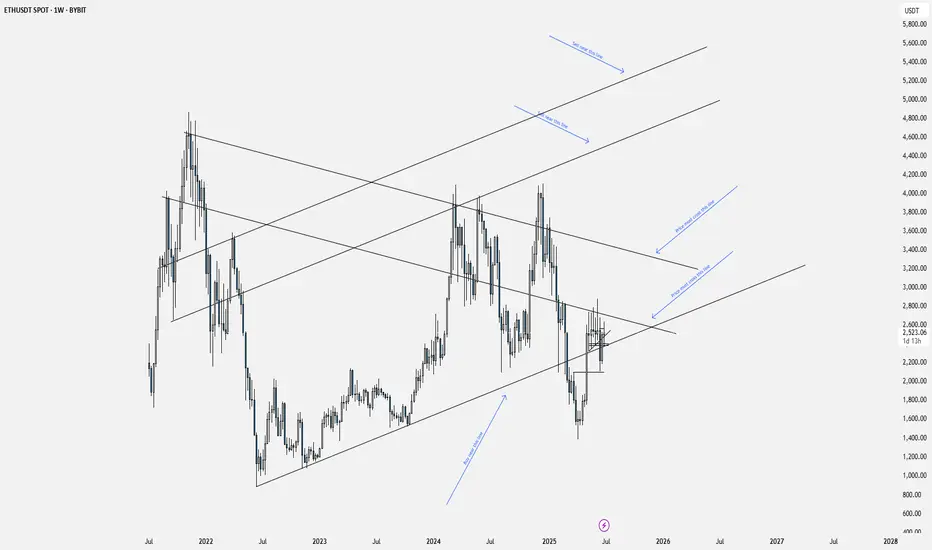
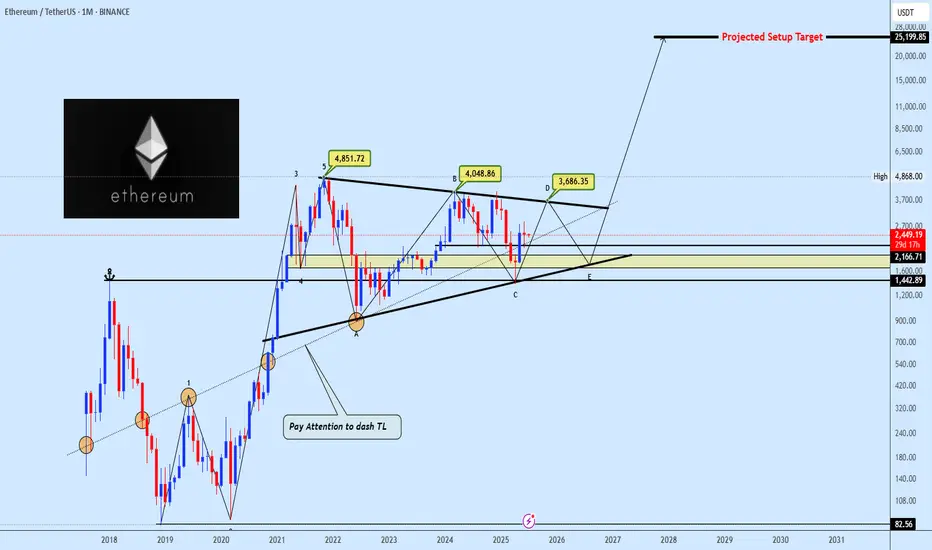
ETHUSDT Long Term Structure Signals Imminent ExpansionEthereum has been consolidating within a large-scale symmetrical pennant formation following its peak at $4,851. This macro structure, spanning several years, reflects sustained accumulation within a clearly defined corrective range, bounded by well-established trendline support and resistance.
After reaching its all-time high, ETH entered a structured correction that has unfolded into what appears to be an ABCDE wave pattern. Currently, price action is developing near point D, approaching the upper boundary of the pennant a crucial area that could define the next directional move.
In addition, the daily chart presents a developing Inverse Head and Shoulders (IH&S) pattern, with the neckline anchored around $2,855. This level is acting as a key resistance, temporarily halting ETH’s short-term upside. A confirmed breakout above the neckline would likely validate both the IH&S and the breakout from wave D, setting the stage for a potential expansion move toward the $6,000 target and beyond.
However, in the event of a temporary rejection at the neckline or pennant resistance, a retracement toward wave E becomes likely. This would bring price back into the $1,400–$1,800 support region a high-confluence demand zone that aligns with the long-term ascending trendline, previous breakout levels, and multiple historical reaction points. This zone may serve as a base for a strong bullish reversal.
Recent price behavior shows compressed volatility and increased buying interest on dips, reinforcing the possibility of an imminent directional breakout. A decisive move outside this macro structure may mark the beginning of a new phase of long-term price expansion.
Share your view with us in the comments, how do you see ETH playing out from here?
Ethereum (ETH): Good Bounce | $2800 IncomingWe had a rather sharp but clean breakout recently where price has shown us that buyers are dominating currently, pushing the price toward the local high at $2800. This is our current target and so far ETH had been perfoming more than well.
Swallow Academy
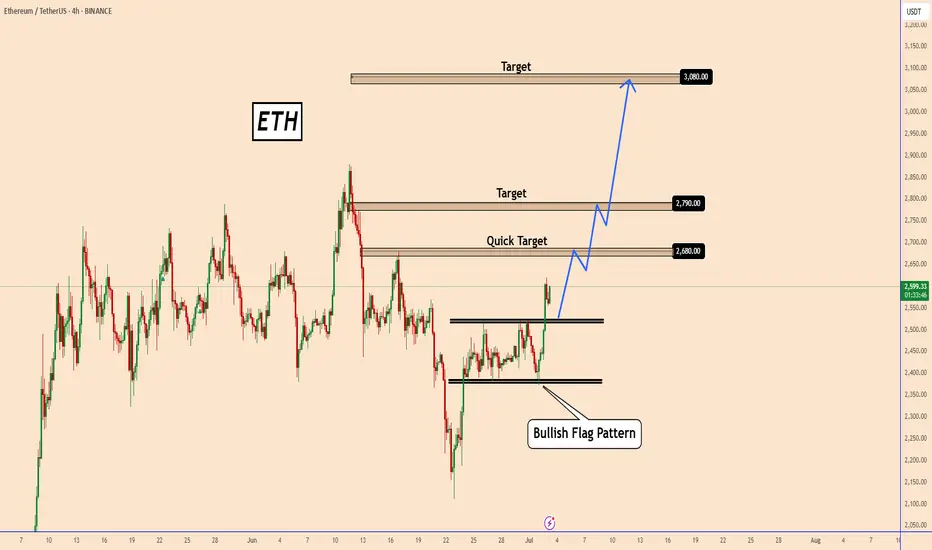
ETH Completes a Clear Bullish Flag Pattern! What’s Next?ETH Completes a Clear Bullish Flag Pattern! What’s Next?
Yesterday, Ethereum completed a bullish flag pattern.
This is a clear signal that bulls are already increasing their long positions.
If this is not a false breakout, then ETH could start from a normal bullish move to a larger one.
Today’s NFP data and the US market's preparation for a long weekend before the 4th of July could support this bullish scenario.
Key Target zones: 2680, 2790 ,and 3080
You may find more details in the chart!
Thank you and Good Luck!
PS: Please support with a like or comment if you find this analysis useful for your trading day
80% win rate strategy with TiqGPTul 3, 2025 7:59 AM
1h1h Chart
15m15m Chart
5m5m Chart
1m1m Chart
Buy Opportunity
Bullish Setup
Buy: ** Buy limit order at $109,340.36 following a retest of the consolidation zone confirming continued buying interest.
Entry: $109,340.36
Strategies: Multi-timeframe bullish order flow analysis, liquidity targeting above current levels.
Confidence: Medium
Risk/Reward: Calculated as follows:
Timeframe: The 1-hour chart shows a strong bullish impulse followed by a consolidation phase, indicating a potential accumulation by institutions. The price is currently testing a minor consolidation zone around $109,340, which could act as a temporary resistance.
Disclaimer: The information provided by this app is for educational and informational purposes only and does not constitute financial advice. Always do your own research before making any trading decisions. TiqGPT is not a licensed financial advisor.
Mark as Successful
Mark as Failed
T
Jul 3, 2025 8:00 AM
MARKET NARRATIVE:
1H Timeframe: The 1-hour chart shows a strong bullish impulse followed by a consolidation phase, indicating a potential accumulation by institutions. The price is currently testing a minor consolidation zone around $109,340, which could act as a temporary resistance.
15M Timeframe: The 15-minute chart reveals more granularity within the bullish structure, showing a series of higher lows and higher highs. This is indicative of continued buying interest and a lack of significant selling pressure at these levels.
5M Timeframe: On the 5-minute chart, the bullish momentum is more pronounced with a clear impulsive move upwards. The recent pullbacks are shallow, suggesting that the market is not ready to reverse but rather is gathering strength for further upward movement.
1M Timeframe: The 1-minute chart provides a detailed view of the buying pressure. The price action is making higher highs and higher lows, confirming the bullish sentiment observed in higher timeframes.
INSTITUTIONAL THESIS:
Institutions appear to be in an accumulation phase, likely targeting higher liquidity zones above the current price level. The consistent higher highs and higher lows across timeframes suggest a coordinated effort to push prices upward, possibly aiming for a significant liquidity pool above the $110,000 mark.
LEARNING POINT:
"Multi-timeframe confluence of bullish order flow and shallow pullbacks indicating strong buying interest."
SIGNAL: BUY
SYMBOL: BTC/USDT ENTRY PRICE: $109,340.36 STOP LOSS: $109,000.00 (just below the recent minor consolidation zone on the 1H chart) TARGET PRICE: $110,000.00 (next psychological and liquidity-rich level) CONDITION: Buy limit order at $109,340.36 following a retest of the consolidation zone confirming continued buying interest. RATIONALE: The trade is based on the alignment of bullish signals across multiple timeframes, shallow pullbacks indicating strong buying interest, and the targeting of higher liquidity zones. STRATEGIES USED: Multi-timeframe bullish order flow analysis, liquidity targeting above current levels. URGENCY: MEDIUM TIMEFRAME: Short-term CONFIDENCE SCORE: 85% RISK/REWARD RATIO: Calculated as follows:
Risk: $109,340.36 - $109,000.00 = $340.36
Reward: $110,000.00 - $109,340.36 = $659.64
Ratio: $659.64 / $340.36 ≈ 1.94:1
FINAL RECOMMENDATION:
WAIT - Although the bullish setup is strong, the risk/reward ratio of approximately 1.94:1 does not meet the minimum requirement of 2:1. It is advisable to wait for a better entry point that offers a higher potential reward relative to the risk or for the market to provide a deeper pullback to improve the risk/reward ratio.
Jul 3, 2025 8:01 AM
1h1h Chart
15m15m Chart
5m5m Chart
1m1m Chart
Hold - Waiting for Setup
Wait for Confirmation
Wait: Immediate market order based on current momentum.
Entry: $155.85
Stop Loss: $152.00
Target: $160.00
Strategies: Multi-timeframe BOS confirmation, Institutional Accumulation Phase
Confidence: 90%
Risk/Reward: Risk=$3.85, Reward=$4.15, Ratio=1:1.1 (Below 2:1 minimum)
Timeframe: Short-term
Disclaimer: The information provided by this app is for educational and informational purposes only and does not constitute financial advice. Always do your own research before making any trading decisions. TiqGPT is not a licensed financial advisor.
Mark as Successful
Mark as Failed
T
Jul 3, 2025 8:01 AM
MARKET NARRATIVE: The analysis across the four timeframes (1h, 15m, 5m, 1m) for SOL/USDT shows a consistent upward trend with a series of higher highs and higher lows, indicating a strong bullish momentum. The price action on the 1-hour chart shows a clear break of structure (BOS) above previous highs around $152, suggesting institutional buying pressure. This BOS is confirmed across the 15-minute and 5-minute charts, where we see continued bullish candles without significant retracement, indicating a lack of selling interest and potential accumulation by institutions. The 1-minute chart provides a more granular view of the buying pressure, showing tight consolidations followed by upward thrusts, typical of institutional demand in lower timeframes.
INSTITUTIONAL THESIS: Institutions appear to be in an accumulation phase, targeting higher prices. The consistent demand and absence of deep pullbacks suggest a strategy to absorb sell orders and push prices higher, likely aiming for liquidity above recent highs.
LEARNING POINT: The observed price action across multiple timeframes demonstrates a classic accumulation phase with a strong bullish momentum, indicating that institutions are supporting the upward move.
SIGNAL: WAIT SYMBOL: SOL/USDT ENTRY PRICE: $155.85 STOP LOSS: $152.00 (just below the recent structural break) TARGET PRICE: $160.00 (next psychological round number and potential liquidity area) CONDITION: Immediate market order based on current momentum. RATIONALE: Calculated risk/reward ratio of 1:1.1 (Risk=$3.85, Reward=$4.15) does not meet minimum 2:1 requirement. Waiting for better institutional setup with improved risk parameters. STRATEGIES USED: Multi-timeframe BOS confirmation, Institutional Accumulation Phase URGENCY: HIGH TIMEFRAME: Short-term CONFIDENCE SCORE: 90% (based on strong bullish signals across all observed timeframes) RISK/REWARD RATIO: Risk=$3.85, Reward=$4.15, Ratio=1:1.1 (Below 2:1 minimum)
RISK/REWARD CALCULATION: Risk = Entry Price - Stop Loss = $155.85 - $152.00 = $3.85 Reward = Target Price - Entry Price = $160.00 - $155.85 = $4.15 Ratio = Reward ÷ Risk = $4.15 ÷ $3.85 ≈ 1.08
Given that the calculated risk/reward ratio is less than 2:1, the recommendation is to WAIT for a better entry point or a more favorable risk/reward setup. The current market conditions are bullish, but the trade does not meet the strict institutional criteria for a minimum 2:1 risk/reward ratio.
Jul 3, 2025 8:04 AM
1h1h Chart
15m15m Chart
5m5m Chart
1m1m Chart
Buy Opportunity
Bullish Setup
Buy: Buy limit order at current market price with confirmation of continued buying pressure and no break of recent higher lows.
Entry: $2586.00
Stop Loss: $2570.00
Target: $2620.00
Confidence: 85%
Risk/Reward: Risk=$16.00, Reward=$34.00, Ratio=1:2.1
Timeframe: Short-term
Disclaimer: The information provided by this app is for educational and informational purposes only and does not constitute financial advice. Always do your own research before making any trading decisions. TiqGPT is not a licensed financial advisor.
Mark as Successful
Mark as Failed
T
Jul 3, 2025 8:04 AM
MARKET NARRATIVE:
Analyzing the ETHUSD pair across multiple timeframes (1H, 15M, 5M, 1M), we observe a consistent pattern of upward momentum followed by consolidation, suggesting a phase of accumulation and potential preparation for a further upward move. The 1H chart shows a strong impulsive move followed by a tight consolidation, indicating strong buying interest and limited selling pressure. The 15M and 5M charts display similar characteristics with price making higher lows, a sign of sustained buying pressure. The 1M chart, while more granular, shows some pullback, which could be interpreted as a liquidity hunt within a bullish structure.
INSTITUTIONAL THESIS:
Institutions appear to be in an accumulation phase, using smaller timeframes to engineer liquidity sweeps (collecting stop losses below minor swing lows) before potentially driving the price higher. The consistent higher lows across timeframes support this thesis, suggesting an underlying strength in buying pressure.
LEARNING POINT:
The current setup exemplifies "Institutional Accumulation with Liquidity Sweeps" where smart money uses minor pullbacks to gather more positions favorably, anticipating a continuation of the trend.
SIGNAL: BUY
SYMBOL: ETHUSD
ENTRY PRICE: $2586.00
STOP LOSS: $2570.00
TARGET PRICE: $2620.00
CONDITION: Buy limit order at current market price with confirmation of continued buying pressure and no break of recent higher lows.
RATIONALE:
Market Structure: Higher lows on 15M and 5M charts indicate sustained buying interest.
Order Flow: Accumulation evident from tight consolidations and quick recoveries from dips.
Liquidity: Recent pullbacks likely served as liquidity hunts, setting the stage for a potential upward continuation.
Strategies Used: Multi-timeframe analysis confirms institutional buying pressure and accumulation phase.
