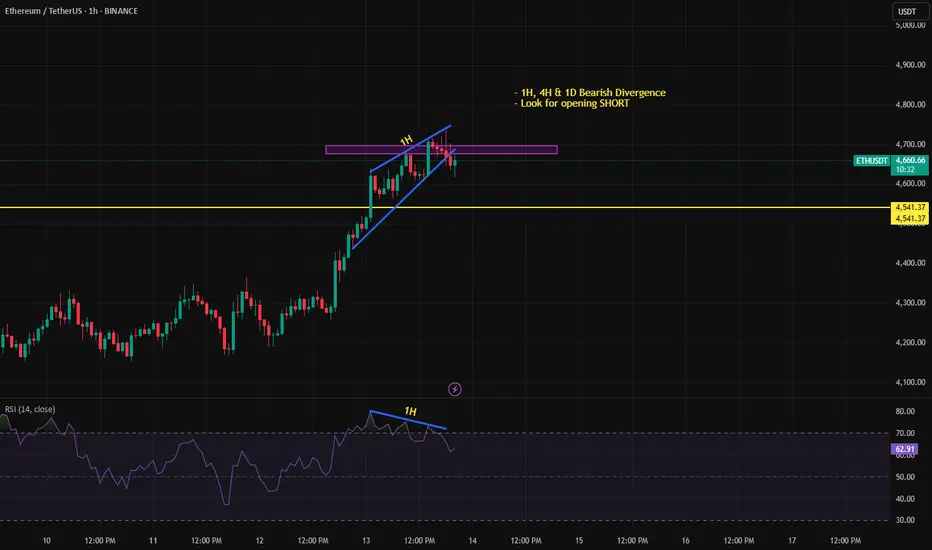
Continuation of ETH -Sell/ShortIn continuation of the previous ETH/USDT Sell/Short outlook, the price has formed a bearish candle below the neckline. This position can be maintained until the bearish divergence is fully resolved across all three timeframes — 1H, 4H, and 1D.
ETHUSDT.P trade ideas
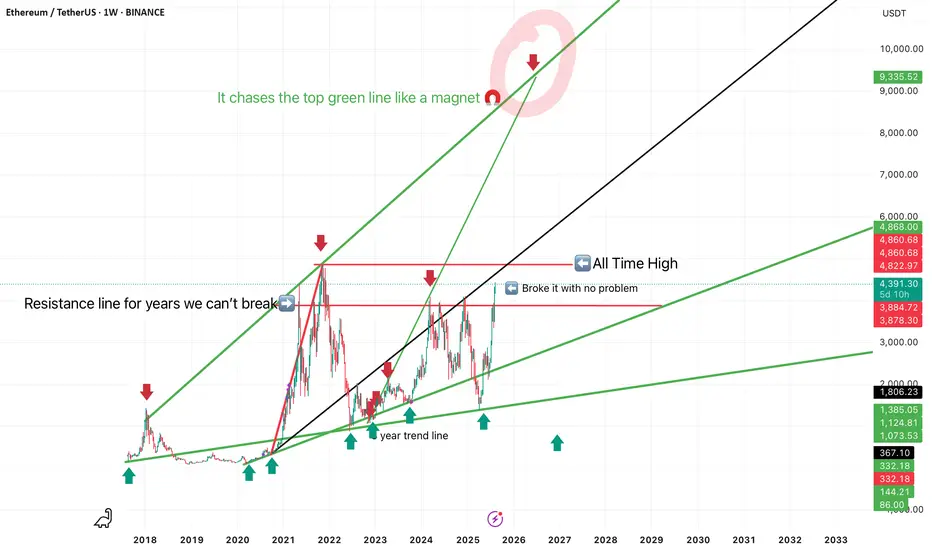
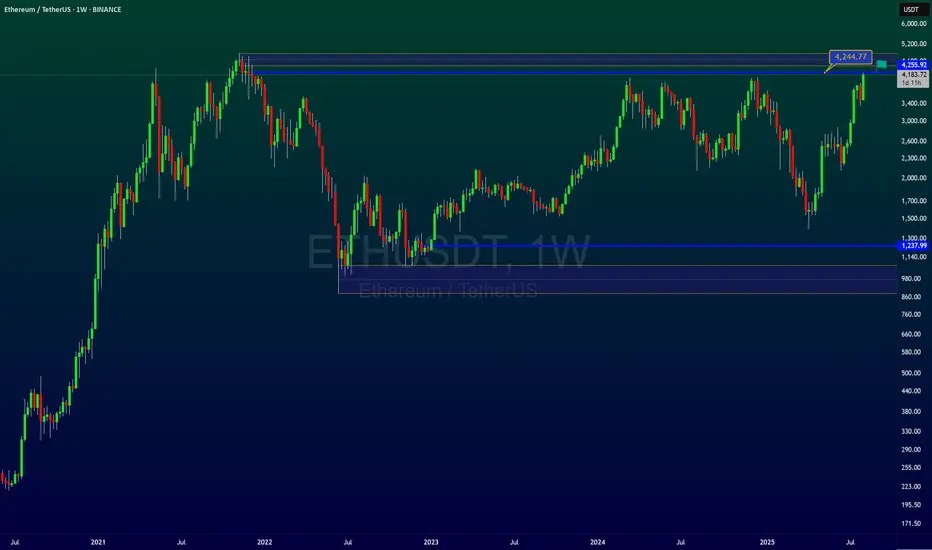
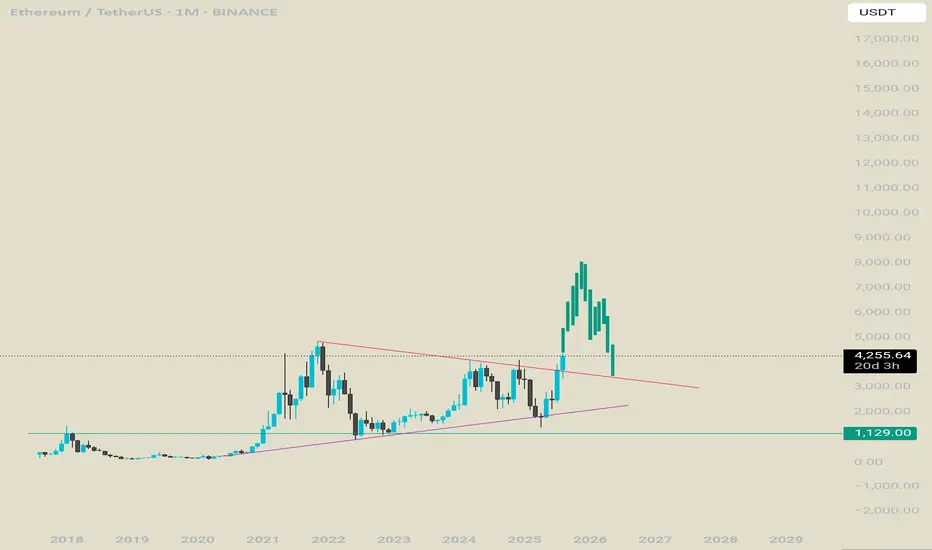
$Eth (Ethereum) road map to prices that will melt faces If history repeats itself, like it always does, then you should watch this beautifully play out, Ethereum is like a magnet to the top green line, but your resistance and support lines are tagged out. Do what you want with this and make sure you do your own research.
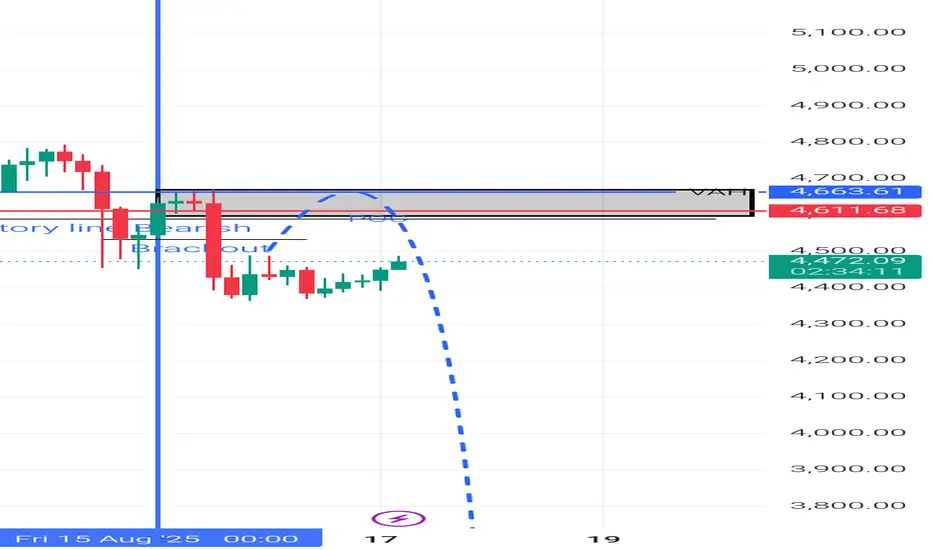
ETH_USDT 4H Possible Scenario I'm expecting ETH will Rejecte From above black box. Keep watching on market to catch the best trade.
HAPPY TRADING 💐
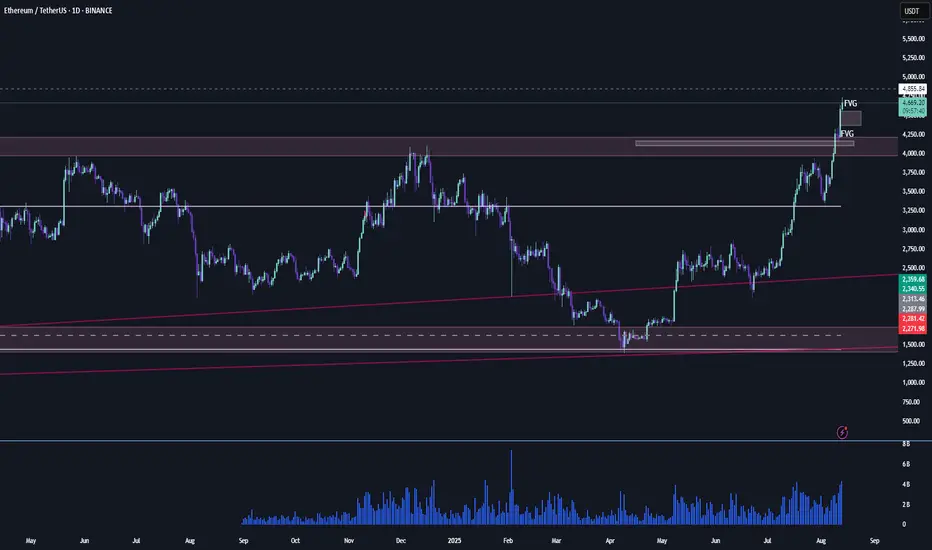
ETH Fair Value Gaps and current resistanceBINANCE:ETHUSDT shortly before potential resistance at around 5k (last ATH roughly), as well as looking at BINANCE:ETHBTC pair it's hitting a major downward resistance that upheld since 2024.
Additionally two unfilled fair value gaps between 4100 and 4600 formed, which tends to be filled in a swift (or not so swift) correction. ofc I hope that #ETH still pushes through ATH, but that's the setup I see. Going into a very short ETH short with tight stop loss to test the waters.
But the narrative still says "Altseason", so use with caution.
The key is whether the price can hold above 3900.73-4107.80
Hello, fellow traders!
Follow us to get the latest information quickly.
Have a great day.
-------------------------------------
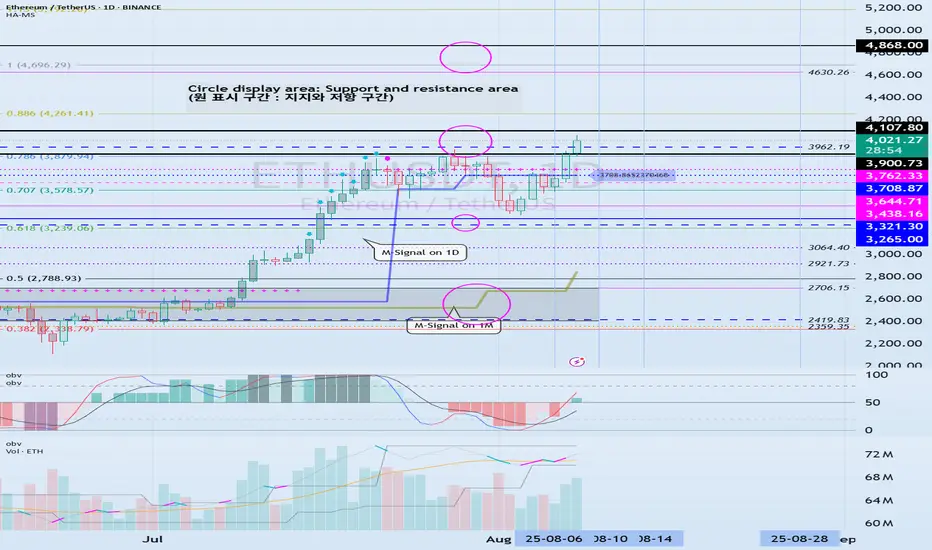
(ETHUSDT 1D chart)
This period of volatility is expected to last from around August 6th to 14th (maximum from August 5th to 15th).
The key question is whether the price can find support and rise above the 3900.73-4107.80 range after this period of volatility.
The next period of volatility is expected to occur around August 28th, so we need to see if the price can hold until then.
If the price declines, we need to check for support around the HA-High ~ DOM (60) range of 3708.87-3762.33.
If not, there's a chance it could fall below 3265.0-3321.30.
-
(1M Chart)
The TC (Trend Check) indicator has risen above 0, suggesting a high possibility of further upside.
Therefore, the key point to watch is whether it can rise above the 4630.26-4868.0 range.
For an uptrend to continue,
- The StochRSI indicator must remain upward with K > D.
(If possible, it's best to avoid K entering the overbought zone.)
- The On-Board Volume (OBV) indicator of the Low Line ~ High Line channel must remain upward.
(If possible, it's best to maintain OBV > OBVEMA.)
- The TC (Trend Check) indicator must remain upward.
(If possible, it should remain above 0.)
If the above conditions are met, the uptrend is likely to continue.
To sustain an uptrend by breaking above key support and resistance levels,
- The StochRSI indicator must remain below the overbought zone and remain above D.
- The On-Board Volume (OBV) indicator of the Low Line ~ High Line channel must rise above the High Line and remain upward.
- The TC (Trend Check) indicator must remain upward. (If possible, it should remain above the 0 point.)
When the above conditions are met, there is a high probability that the price will rise after breaking above important support and resistance levels.
-
Thank you for reading to the end.
I wish you successful trading.
--------------------------------------------------
- Here's an explanation of the big picture.
(3-year bull market, 1-year bear market pattern)
I will explain more in detail when the bear market begins.
------------------------------------------------------
Ethereum Returns to Key Resistance Zone After 401(k) NewsAfter last week’s panic selloff triggered by major payrolls revisions, Ethereum is now back at a key resistance level. The rebound has been fueled in part by President Trump signing an executive order allowing cryptocurrencies in 401(k) plans. With more than $12 trillion in assets, the 401(k) market could have a significant impact on crypto prices, even if only a small fraction flows into the sector. Bitcoin and Ethereum are likely to capture the lion’s share of these inflows, especially with ETF access already established.
Adding to the optimism, Axie Infinity’s co-founder recently stated that the project is considering a return to the Ethereum network, which could provide an additional boost.
However, it all comes down to the key daily resistance zone, which includes the 4110 horizontal resistance and the daily downtrend line at 3960. For Ethereum to fully kick off its next bull run, it will need to break and hold above the 3960–4110 zone.

ETH all time high or reverse????Ethereum has returned to the top after a long time and is on the verge of breaking the top, but in my opinion this will not happen. Of course, it is possible to see new prices, but then it will enter a correction and this will happen in the next move that will start in the future.
So we should wait for a very good entry with a cheap and lower price.
Stay with me and boost me after introducing me to your friends.
my view on ethAfter carefully observing the current ETH price structure, I’m leaning toward a bearish bias in the short to mid-term.
As always, this is not financial advice — just sharing my personal view based on market structure and price action. Risk management remains the most important tool in this game.

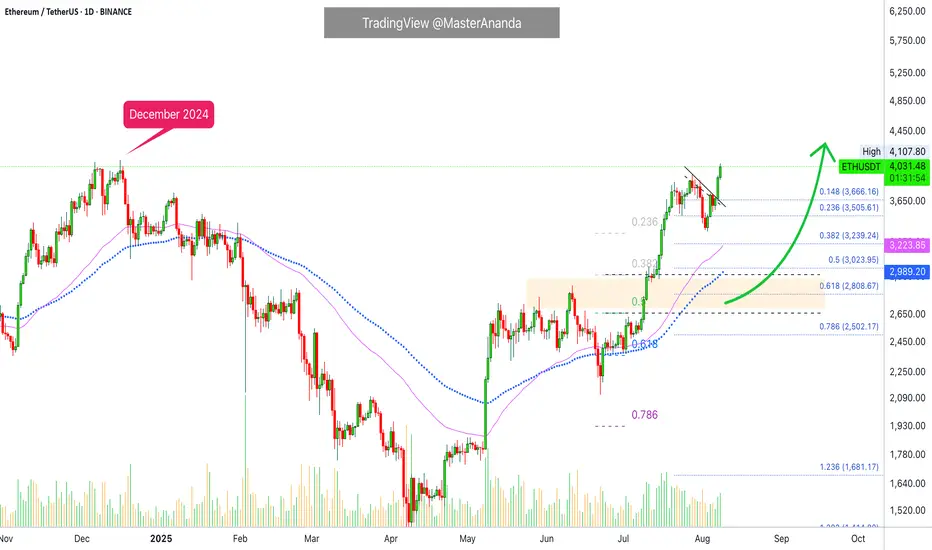
Ethereum Hits a New All-Time High? Altcoins Bull MarketEthereum just hit its highest price since December 2024. Here is the thing, first XRP moves forward and we know the rest of the market will do the same. We saw this happen with Bitcoin Cash, it just kept on moving straight up and with this we knew the rest of the market to do the same. Then we have Litecoin and now Ethereum keeps on going higher. What one does, the rest follows.
Crypto will continue to grow; the altcoins will continue to grow and because the altcoins are growing Bitcoin will also continue growing. The altcoins growing and moving forward confirms that Bitcoin's top is not in, far from this being the case. So, Ether will continue to grow, Bitcoin will continue to grow and the smaller altcoins will follow.
Watch Solana go next and Dogecoin. Litecoin will be big of course. If you buy Litecoin now below $200, you will do good when Litecoin trades at $1,000 plus. The thing is that the next advance will change everything with the ETFs. Each time there is a bear market there is a crash and flush you can always buy again at market bottoms and lows. When a Crypto gets ETFs, corrections will not be the same. Demand will be too strong and we will experience long-term growth. Something like how Bitcoin is behaving now but also on some major altcoins. There will continue to be and appear new variations across the market. The altcoins will separate into different groups and cycles. The broader market cycle will continue to evolve. Things will never stay the same. Change is the only constant.
Namaste.
Ethereum's Hits New All-Time High · Next Target $7,332Ether (ETH) is approaching its 2021 all-time high and wow!, this is awesome, think about it. One day we are witnessing a correction, Ethereum crashing for years lower below $2,000 and then even lower, below $1,500 and then what? After just several months Ethereum is already trading way high above $4,500 and ready to hit a new all-time high, catching up to Bitcoin and XRP; the rest of the altcoins market will follow.
Yes, a new all-time high but that was never the goal. The previous peak is only a resistance point, a reference point which we use to know how good we are doing, how far advanced we are in the current cycle but it is never the end. The all-time high is meant to be broken in each cycle and this is exactly what we are seeing today.
As soon as ~$4,900 breaks, ETHUSDT is likely to continue to straight up to face resistance right around $6,000. Stops should be just like the past. A few days red or sideways then back green. Always up with maximum force, the entire move.
The main resistance for this current advance is $7,332 but for the current cycle, new and updated numbers based on current market action and fresh data suggests that $11,318 is a possible target based on standard cryptocurrency bull market action. That is, we don't even need an extraordinary bull market to make Ethereum worth $11,111 per Ether token.
Ok. Market conditions look great. It's been a long ride... We've been tracking Ethereum for so many years now and this entire bullish recovery, cycle and wave. Let's continue to ride the market together... Let's trade!
Namaste.

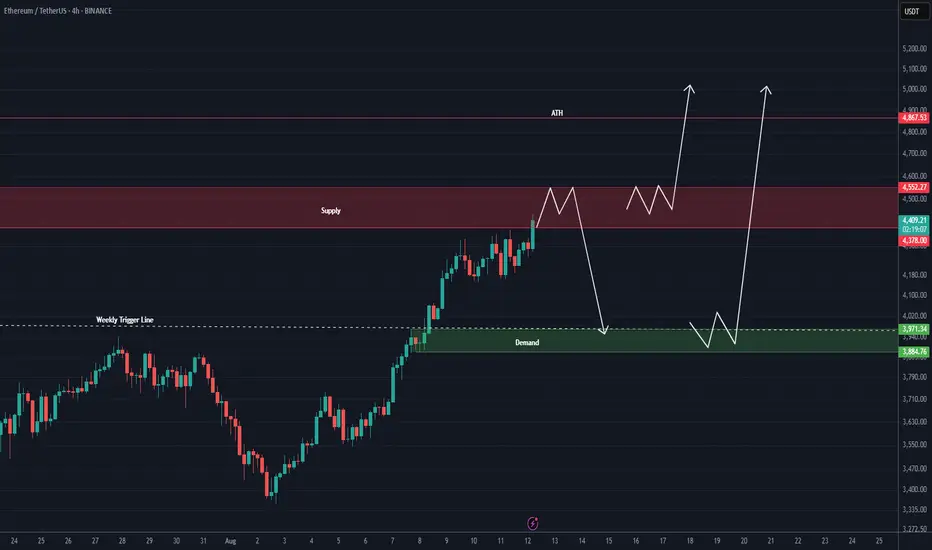
ETH ANALYSIS (4H)Ethereum has broken a weekly blind trigger and has now reached a higher-timeframe supply zone, which corresponds to the weekly timeframe.
Given the strength of the supply zone and the strong bullish momentum, there are currently two possible scenarios:
**Scenario 1:** It may have a pullback from this supply to demand before making an attack toward the all-time high.
**Scenario 2:** It may consolidate on the supply and go straight toward the all-time high.
In both scenarios, it is expected that after hunting the all-time high or moving slightly above it, the price will drop sharply toward lower levels.
For risk management, please don't forget stop loss and capital management
When we reach the first target, save some profit and then change the stop to entry
Comment if you have any questions
Thank You
ETH's next volatility period: around August 28th
Hello, traders!
Follow us to get the latest information quickly.
Have a great day!
-------------------------------------
(ETHUSDT 1D chart)
This volatility period for ETH is expected to last until August 15th.
Therefore, caution is advised when trading.
The key question is whether the price can rise above the previous all-time high (ATH) of 4868.0.
Currently, the key support and resistance levels are 3900.73-4107.80.
Therefore, even if there is a further decline, if the price remains within the 3900.73-4107.80 range or higher, the upward trend is expected to continue.
Currently, the HA-High indicator is formed at 3708.87, so it's important to check whether a new HA-High indicator is formed if a further decline occurs.
The formation of the HA-High indicator indicates a decline from the high, so determining whether support is found near that level is crucial.
While ETH's volatility period is around August 28th, BTC's volatility period is around August 24th. Therefore, it's important to monitor how the price moves during this period.
-
Thank you for reading.
We wish you successful trading.
--------------------------------------------------
- Here's an explanation of the big picture.
(3-year bull market, 1-year bear market pattern)
I'll explain more in detail when the bear market begins.
------------------------------------------------------

Ethereum Weekly and Daily Charts CountsIn this post, I have laid out my Elliott Wave Count for #ethusdt for mid to long-term. This video explains why I have a bullish view for this asset overall.
The analysis is to be updated with trade ideas once the short term trajectory develops.

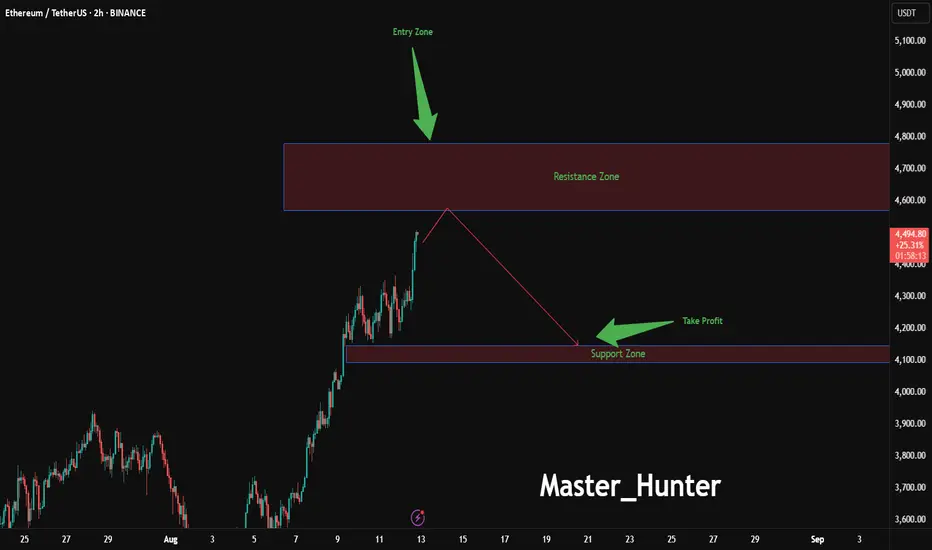
Ethereum Drop Zone Approaching?BINANCE:ETHUSDT is flashing warning signs on the 2-hour chart, with an entry zone between 4570-4780 near a critical resistance level that has capped recent rallies.
This setup suggests a potential reversal , targeting a profit zone between 4145-4093 where strong support and the 200-day EMA converge. Set a stop loss at 4780 on a close above to protect against a false breakout, keeping risk tightly controlled. A break below 4550 with increasing volume could confirm the downward move, especially if Bitcoin leads the market lower.
Keep an eye on Ethereum network upgrades and overall crypto market sentiment, as these could act as key catalysts. This trade offers a strategic opportunity for those ready to navigate the volatility—share your insights below!
#ETHUSDT #EthereumTrading #CryptoSignals #TechnicalAnalysis #TradingView #DayTrading #MarketAnalysis
#ETH #ETHUSDT #ETHEREUM #LONG #SWING #Analysis #Setup #Eddy#ETH #ETHUSDT #ETHEREUM #LONG #SWING #Analysis #Setup #Eddy
ETHUSDT.P Swing Long Analysis & Setup
Important area of the upper time frame for swing are identified and named.
This setup is based on a combination of different styles, including the volume style with the ict style.
Based on your strategy and style, get the necessary confirmations for this Swing Setup to enter the trade.
Don't forget risk and capital management.
The entry point, take profit point, and stop loss point are indicated on the chart along with their amounts.
The responsibility for the transaction is yours and I have no responsibility for not observing your risk and capital management.
🗒 Note: The price can go much higher than the second target, and there is a possibility of a 500% pump on this currency. By observing risk and capital management, obtaining the necessary approvals, and saving profits in the targets, you can keep it for the pump.
⚠️ Warning : The stop loss is dramatic and large. Place the stop loss based on your strategy and after getting entry and confirmation on the entry point behind the last shadow that will be created. (( This is just my opinion and is not meant to be 100% correct, so be careful with your capital. ))
Spot Investing : ((long 'buy' position)) :
🟢 Entry 1 : 1800
🟢 Entry 2 : 1500
First entry point calculations :
⚪️ SL : 1370 ((23.89%))
⚫️ TP1 : 4500 ((150%))
⚫️ TP2 : 5000 ((177.78%))
⚫️ TP3 : 8000 ((344.44%))
⚫️ TP4 : 10000 ((455.56%))
‼️ Futures Trading Suggested Leverages : 3-5-7
The World Let it be Remembered...
Dr. #Eddy Sunshine
4/4/2025
Be successful and profitable.
Do you remember my first Ethereum swing long signal?
My first swing long signal was provided on Ethereum, which was spot pumped by more than 100% and was profitable :

ETH - short to 4k, then 20k by ChristmasETH bollinger meridian band lining up with recent upward trend.
With institutional investors pigging out on Ethereum for the past few months, and the historical pattern of ETH all time highs, I expect a short term downtrend to 4000 and then shooting up towards 20k by Christmas.
Happy trading!

ETH SHORTETH has gotten bearish recently by breaking 100 and 50 ema as well as creating a big bearish liquidity void
I have analyzed a 4H supply area which matches 3Day POC and hence why I will be placing my entries there.
Feel free to comment !

ETHER 9k ATHI think ether will continue to amaze us for the rest of the year .
This will not stop.
Monthly green candles are going to melt faces.
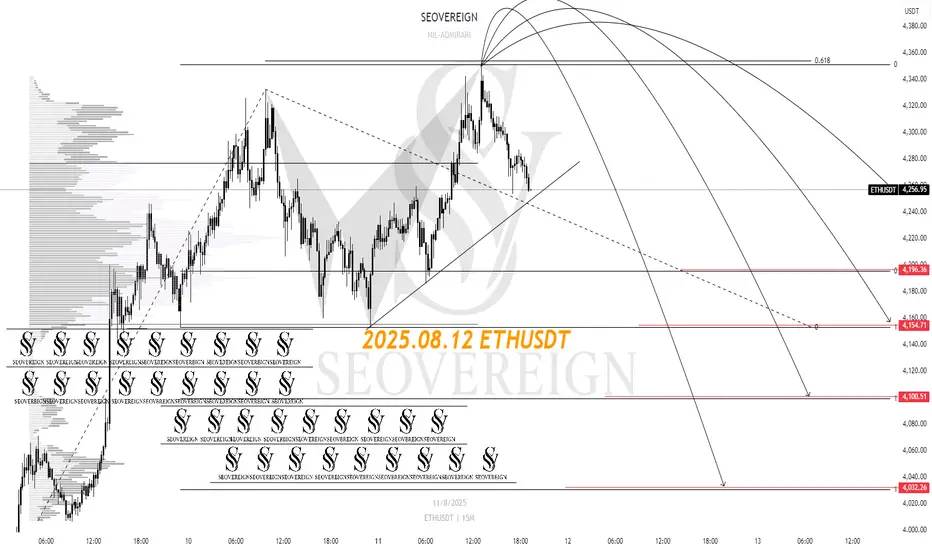
[SeoVereign] ETHEREUM Outlook – August 12, 2025I will present a short position perspective on Ethereum for August 12.
This idea is based on the premise that the direction is downward, derived from a strict counting of Bitcoin, and the specific entry point was set based on the Shark pattern.
Accordingly, the average take-profit target was set at around 4,126 USDT.
I plan to continue updating this idea as the movement unfolds.
Thank you.
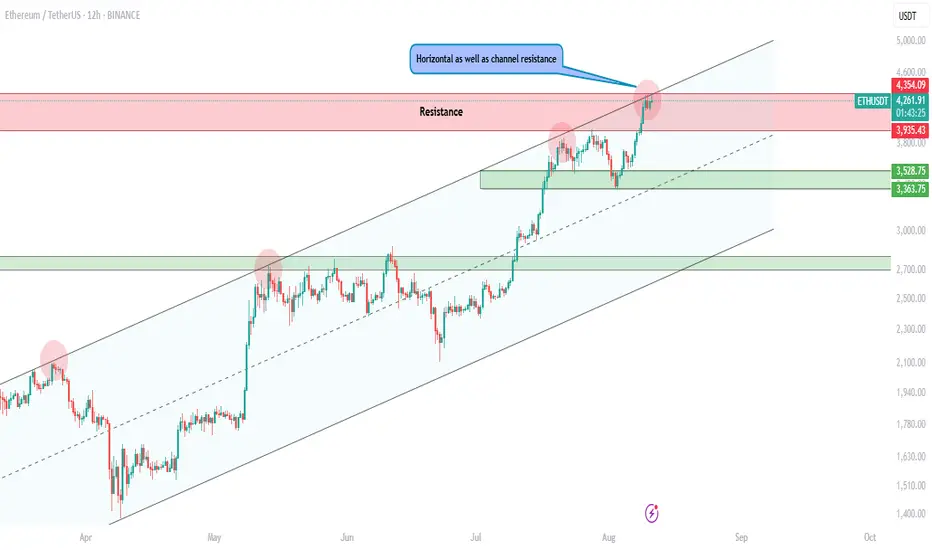
$ETH at Major ResistanceEthereum is testing a confluence zone — horizontal resistance + channel top 📏
Last few touches here led to strong rejections
A breakout could be explosive, but caution is key!
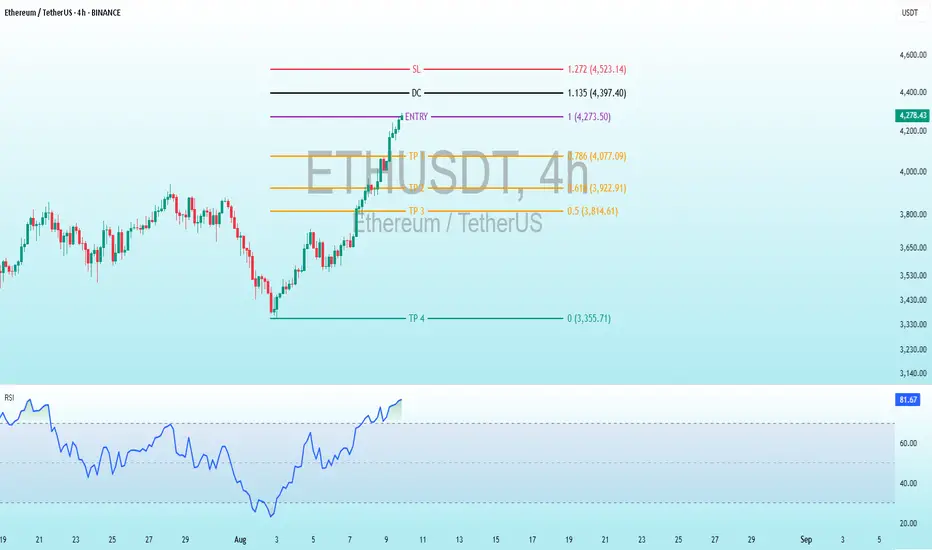
ETH Bearish DivergenceBINANCE:ETHUSDT
Trade Setup:
Target 1: 4,077.09 (0.786 Fibonnaci Golden Zone).
Target 2: 3,922.91 (0.618 Fibonnaci Golden Zone).
Target 3: 3,814.61 (0.5 Fibonnaci Golden Zone).
Target 4: 3,355.71 (0 Fibonnaci).
DCA : 4,397.40 (1.135 Fibonacci)
Stop Loss: 4,523.14 (1.272 Fibonacci).
RSI Analysis: The RSI is showing a bearish divergence, suggesting potential bearish momentum. The current RSI is around 81.56, approaching oversold territory, so caution is advised.
Eth Short Bearish Butterfly The Bearish Butterfly setup with price levels:
📍 Entry
Around point D, which looks close to $4,186–$4,190.
🛑 Stop Loss (SL)
Safest SL: Above 1.27 XA extension (slightly beyond D) → around $4,230–$4,240.
Conservative SL: Just above 1.618 XA extension (~$4,255).
🎯 Take Profits (TP)
We use Fibonacci retracements from the AD leg for targets:
TP1: 38.2% retracement of AD → ~$3,960
TP2: 61.8% retracement of AD → ~$3,800
TP3: Full retrace to point B area (~$3,700)

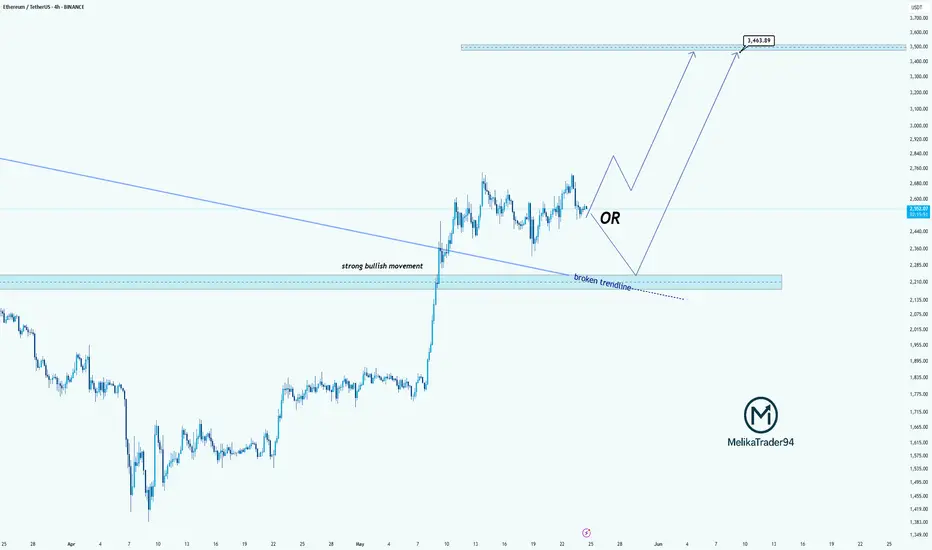
ETH Continues Bullish Momentum Above Broken TrendlineHello guys!
Ethereum has shown a strong bullish rally, breaking through a long-standing descending trendline with significant momentum. Currently, price action is consolidating above the broken trendline, which may now act as a support zone.
🔹 Scenario 1 (Bullish Continuation): If ETH holds above the current range and confirms the broken trendline as support, we could see a continuation toward higher resistance levels around $3,500 and beyond.
🔹 Scenario 2 (Deeper Retest): Alternatively, a pullback toward the $2,200–$2,300 area (highlighted zone) could offer a better accumulation point before the next bullish leg resumes.
This setup suggests that as long as ETH remains above the key support levels, the bullish structure remains intact.