Important Support and Resistance Areas: 2419.83-2706.15
Hello, traders.
Please "Follow" to get the latest information quickly.
Have a nice day today.
-------------------------------------
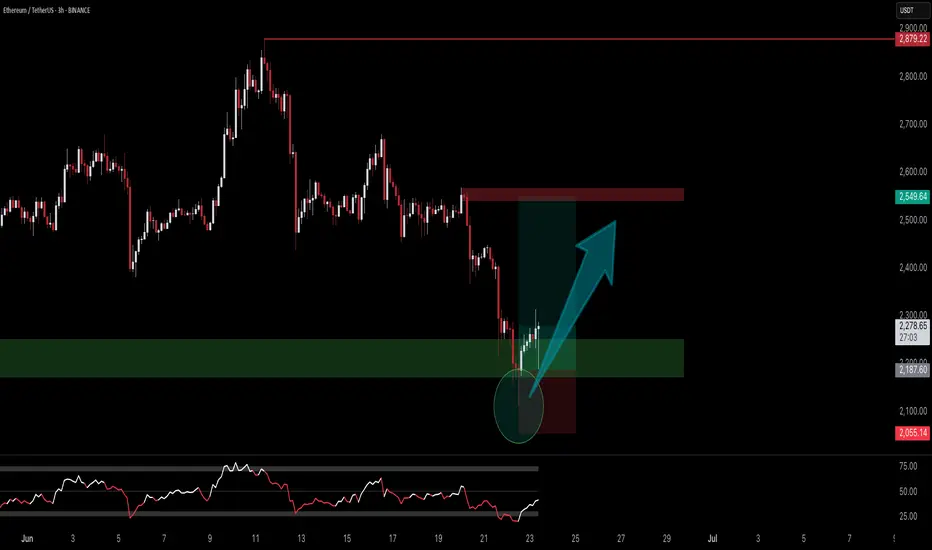
(ETHUSDT 1D chart)
The key is whether ETH can find support in the 2419.83-2706.15 area and rise.
This is because this section is the section that needs to be supported in order for a full-fledged uptrend to begin.
Therefore, if you are trading ETH, you can proceed with a purchase when support is confirmed in the 2419.83-2706.15 section.
-
Thank you for reading to the end.
I hope you have a successful transaction.
--------------------------------------------------
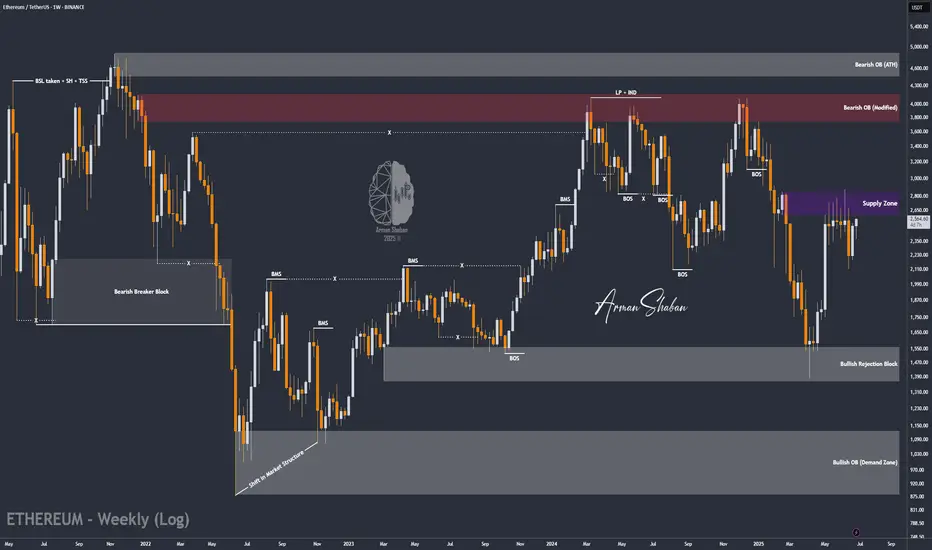
- Here is an explanation of the big picture.
(3-year bull market, 1-year bear market pattern)
I will explain the details again when the bear market starts.
------------------------------------------------------
ETHUSDT.P trade ideas

ETH 50MA Reclaims 0.5 FibInteresting take on ETH daily using just the 50MA and Fib levels.
Notice how the 50MA has interacted with the Fib levels since June 2021.
In May 2025, the 50MA crossed below the 0.618 Fib level, marking the bottom of the December 2024 drop.
The 0.5 Fib acted as support in October 2024 during the double top formation at the 0.236 Fib.
Now, the 50MA has crossed back above the 0.5 Fib.
As long as price holds above this 0.5 Fib level, the odds of further upside remain stronger.
Always take profits and manage risk.
Interaction is welcome.

ETH | Long | 3 Hrs | Target: 2,540This technical analysis is for informational and educational purposes only. It does not constitute financial advice. Remember to always research and consult with a professional before making investment decisions. Good luck! 📈💼🚀
ETH/USDT : Gearing Up for a Major Breakout? (READ)By analyzing the Ethereum chart on the weekly timeframe, we can see that the price has started rising just as expected and is now approaching the first target. For now, ETH faces major resistance in the $2,600–$2,900 zone.
If price breaks above this key area, I expect a strong bullish move from Ethereum!
Based on the main analysis, the short-term targets are $2,700 and $2,890, while the mid-term targets are $3,100 and $4,100.
Please support me with your likes and comments to motivate me to share more analysis with you and share your opinion about the possible trend of this chart with me !
Best Regards , Arman Shaban
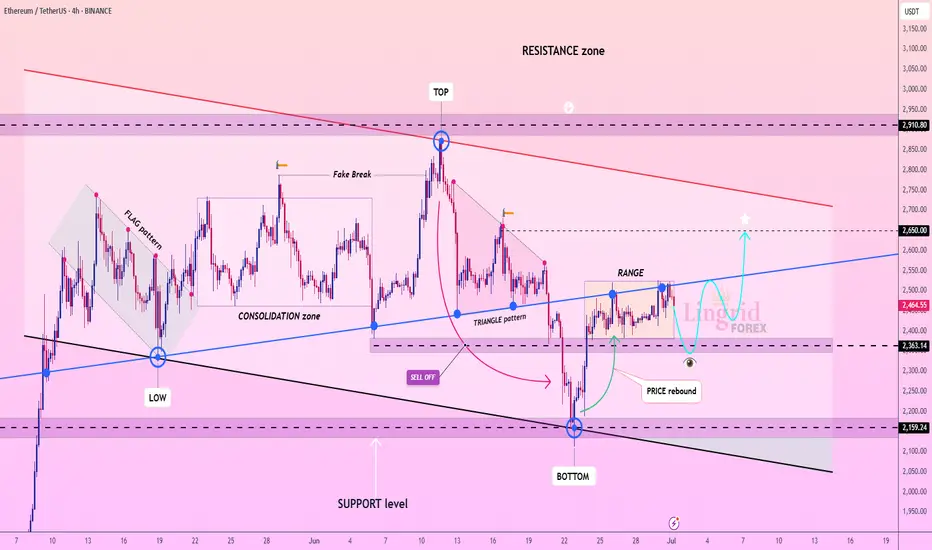
Lingrid | ETHUSDT Price Compression and Expansion PhasesBINANCE:ETHUSDT is struggling to hold gains after a rejection from the top of the range, with price retracing back toward the breakout point and key trendline support. The structure remains intact above 2,363, where bulls may attempt another rebound. A sustained move above the blue ascending trendline would open the way toward the 2,650 target, completing the projected rebound path.
📈 Key Levels
Buy zone: 2,363–2,400
Sell trigger: breakdown below 2,363
Target: 2,650
Buy trigger: breakout and retest of 2,475–2,500 with volume
💡 Risks
Failure to hold the trendline could push price toward 2,159
Weak follow-through may stall near 2,550
Bearish engulfing from current range top can trap early buyers
If this idea resonates with you or you have your own opinion, traders, hit the comments. I’m excited to read your thoughts!
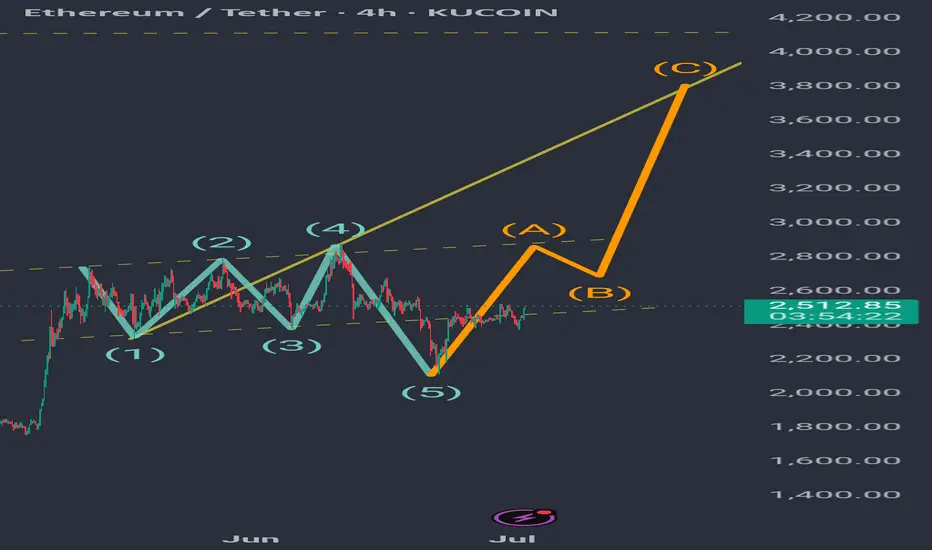
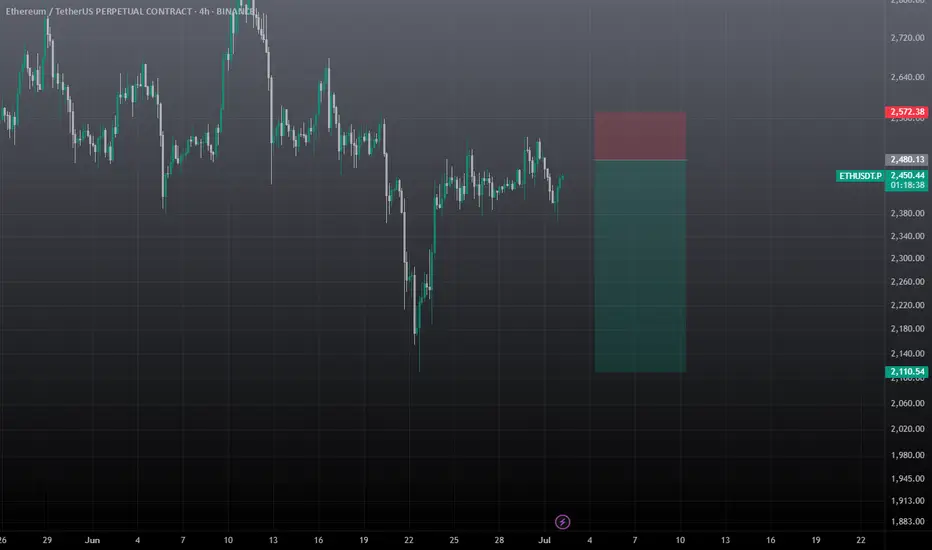
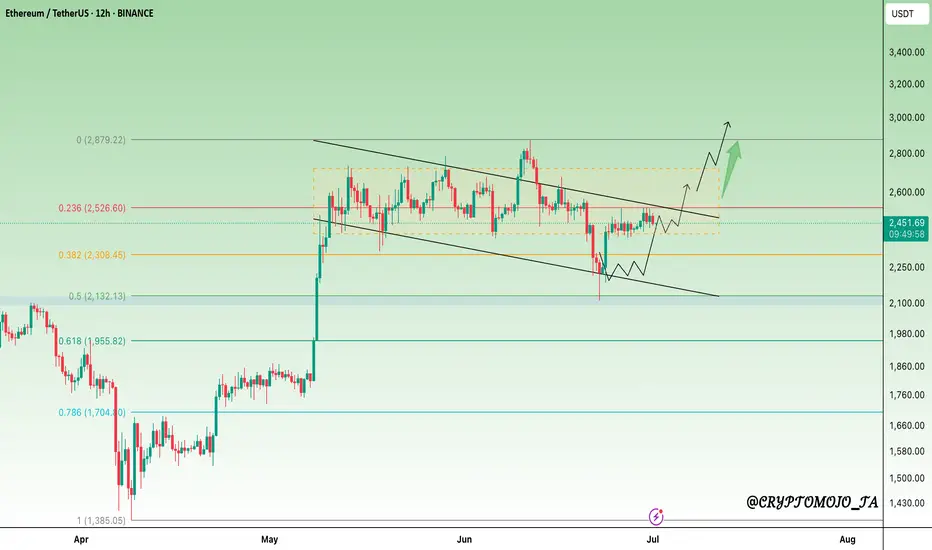
A probability: Bullish Wolve Wave on ethEth hit a low near $1,400 in early April and from there charted a sharp rise, doubling its price. Around $2,800, it clearly encountered resistance corresponding to the 0.5 Fibonacci of the previous downward movement. From that point, it moved sideways in a range whose downward breakout reached the 0.5 Fibonacci of the current upward movement, $2,113, where it found strong support and has returned to the range. So far, this appears to be forming a bullish Wolve wave, whose target would be reached at the yellow line, which is the projection of waves 1 and 4 connecting. If Eth manages to break through the range and consolidate above it, it is very likely to achieve that target.
ETHUSDT SWING TRADE SetupWait for the entry and must use sl, if sl hits then wait for candle closure, candle managed to close above the SL, still there is lot of supply zone for eth till 2.7k, So fakeout also possible. I will comment the update, SO closely follow me.
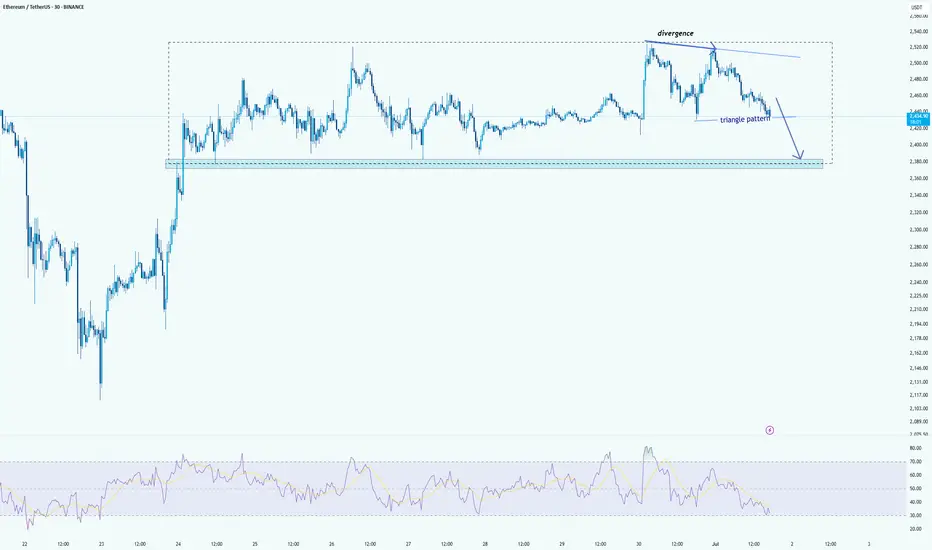
ETH 30min: Bearish Triangle Forming After RSI Divergencehelo guys
Ethereum is currently trading within a clear range, and recently formed a bearish triangle pattern near the top of the consolidation. A visible RSI divergence confirmed the loss of bullish momentum as price made a higher high, but RSI printed a lower high — a common sign of exhaustion.
Now, ETH is moving downward within the triangle, and pressure is building near the lower edge of the range. If the pattern breaks down as expected, the next likely move is a drop toward the support zone around $2,370–2,380, which marks the bottom of the range.
This setup shows a typical structure:
Divergence → Triangle → Breakdown toward range low
Unless price reclaims the triangle top quickly, bears have the upper hand in the short term.
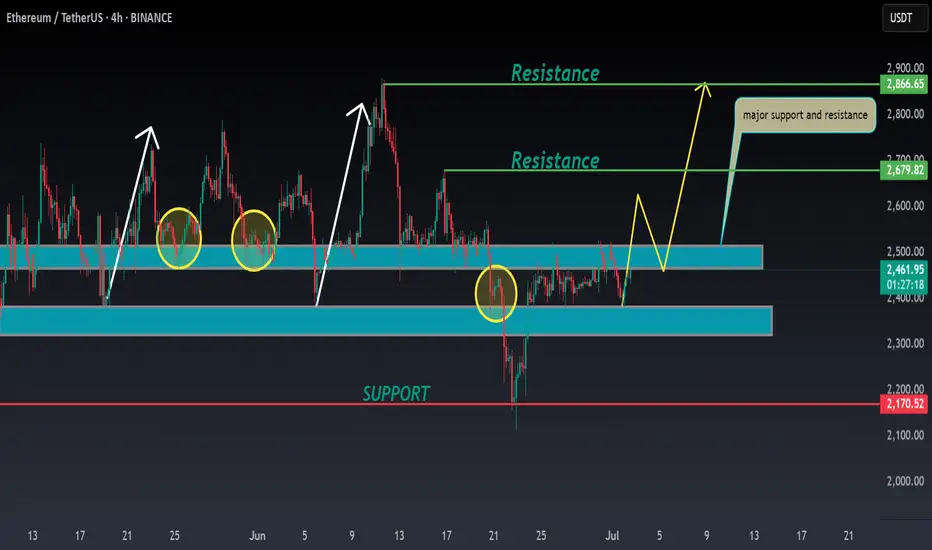
ETH ANALYSIS🔮 #ETH Analysis 🚀🚀
💲💲 #ETH is trading between support and resistance area. There is a potential rejection again from its resistance zone and pullback from support zone. If #ETH closes above 2500$ then we would see a bullish move
💸Current Price -- $2,462
⁉️ What to do?
- We have marked crucial levels in the chart . We can trade according to the chart and make some profits. 🚀💸
#ETH #Cryptocurrency #DYOR
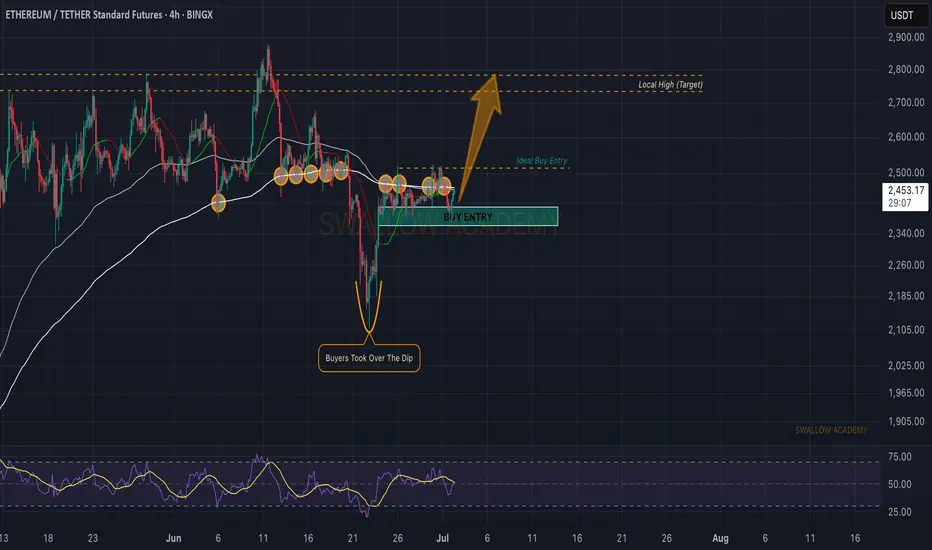
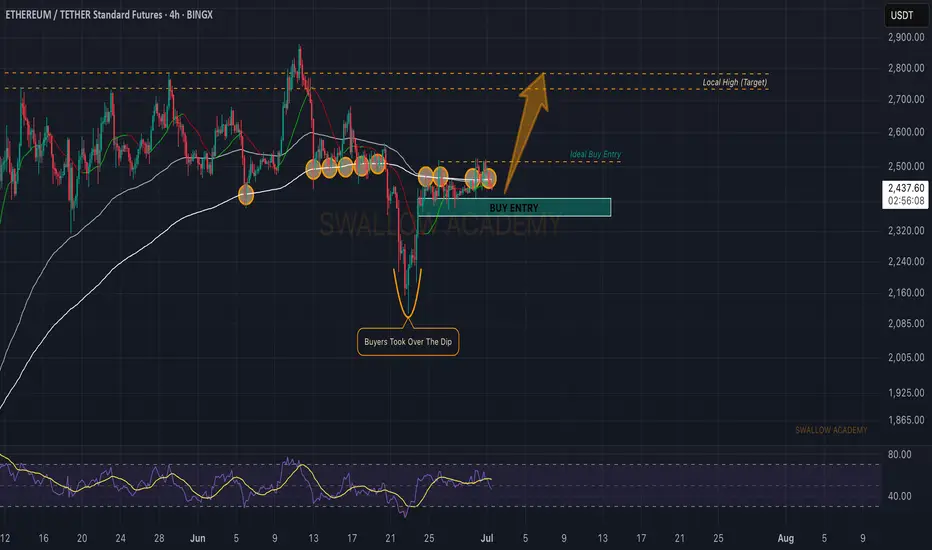
Ethereum (ETH): Good Start, Seeing Buyside DominanceEthereum has done well, where we have established a proper support area near the local buy zone, which should be enough for us to have a proper bounce from here towards our target of $2800.
As long as buyers keep the dominance near the buy area, we are bullish!
Swallow Academy

Q3 Could Be Big for #ETH, Breakout Watch ON#ETH bounced exactly from the 0.5 level of Fib Retracement, as expected.
Now it appears to be gearing up for its next breakout move!
After weeks of chopping inside a falling channel, ETH is showing signs of strength. It's reclaiming key levels and slowly pushing toward the breakout zone near $2,520.
A breakout above this resistance could trigger a sharp move toward $2,880 and beyond.
However, bulls need to hold the $2,300 zone, a drop below might delay the pump.
Structure is bullish, just needs confirmation.
IMO, Q3 could be massive for ETH.
Like & retweet for more updates.
#Ethereum
Ethereum (ETH): Hovering Near EMAs | Might Be Good Buying SpotEthereum is still hovering near local lines of EMAs, where we are expecting to see a volatile breakout very soon.
Now we have 2 buy entries, where the best option is after breaking the local resistance area, which is above the EMAs but overall, with the current buyside dominance we have had, we are seeing good chances for the price to reclaim the $2800 within days from here on.
Swallow Academy
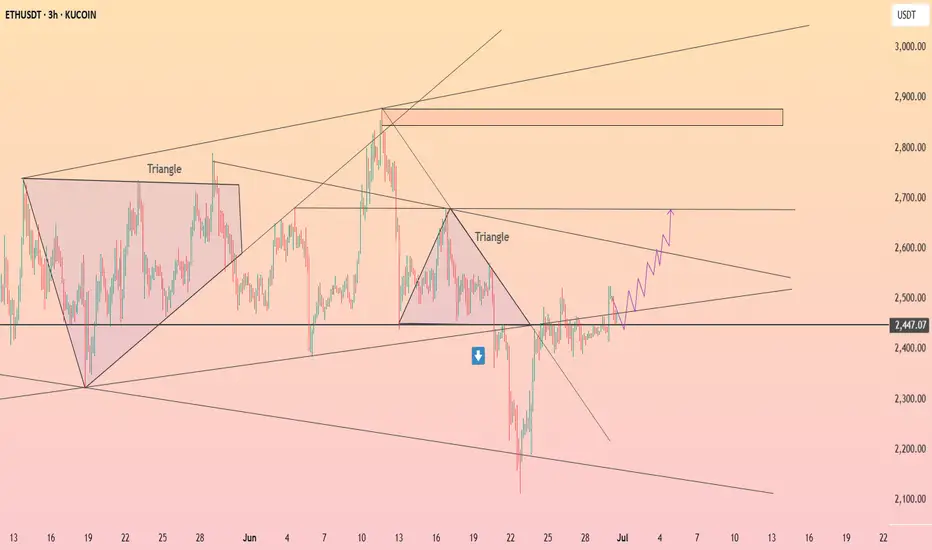
HolderStat┆ETHUSD fixed above the supportBINANCE:ETHUSDT broke out from a triangle and is holding above the 2,447 zone. The current ascending structure targets 2,700 in the near term. Reclaiming short-term resistances confirms a bullish reversal from recent lows, similar to past triangle breakouts.
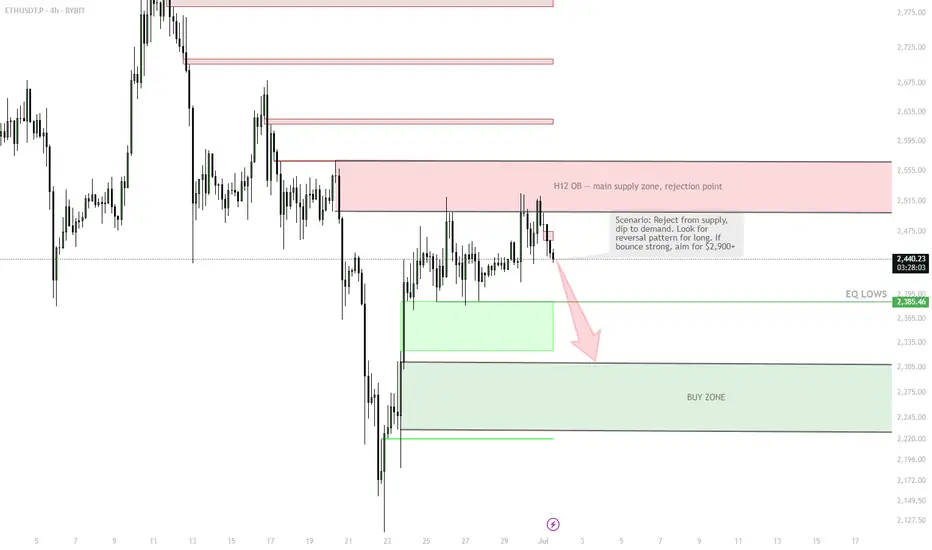
ETH | H12 Supply Rejection & Demand Bounce PlanSELL ZONE $2,520–2,560
→ Short from supply, rejection expected
Triple tap + SFP = short trigger
↓
EQ LOWS $2,380–2,400
→ TP1 / watch for bounce
↓
BUY ZONE $2,280–2,320
→ Main long zone, enter on confirmation (bullish candle/SFP)
STOP below $2,250 = cancel idea
↑
TP1 $2,500
TP2 $2,900–3,000 (if strong bounce)
Main scenario — short from supply zone, target demand at $2,280–2,320. Long only if bounce is strong. Stop below $2,250. No confirmation — no trade.

FRD/FGDFRD happen when there is a red day after 2 or more breaks of daily high to the up side. after the trigger to the downside, it will be highly likely to continue to breakdown
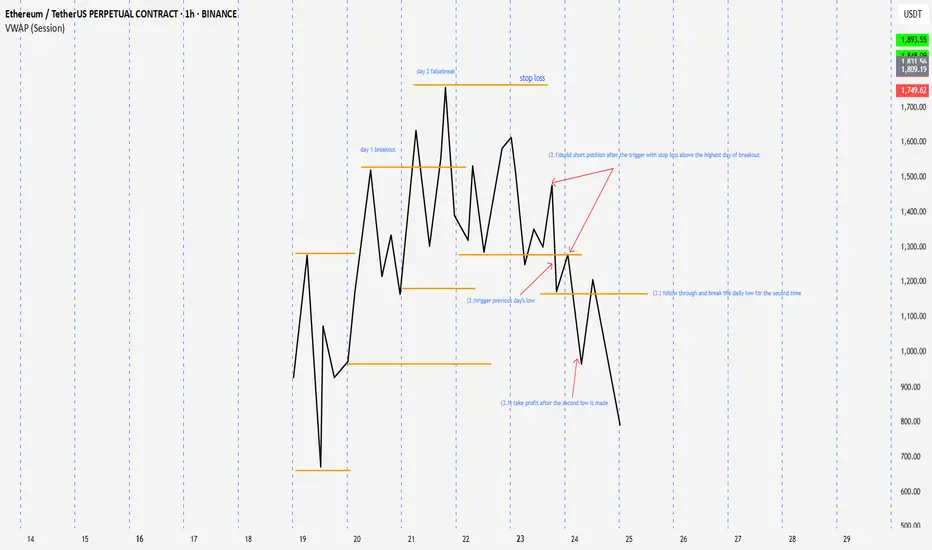
false break set upafter 2 higher highs or more has been made then a day trades above the previous day's high but close back inside the range, it is D1. after the break of previous day low, it is high probable that it will continue the reversal
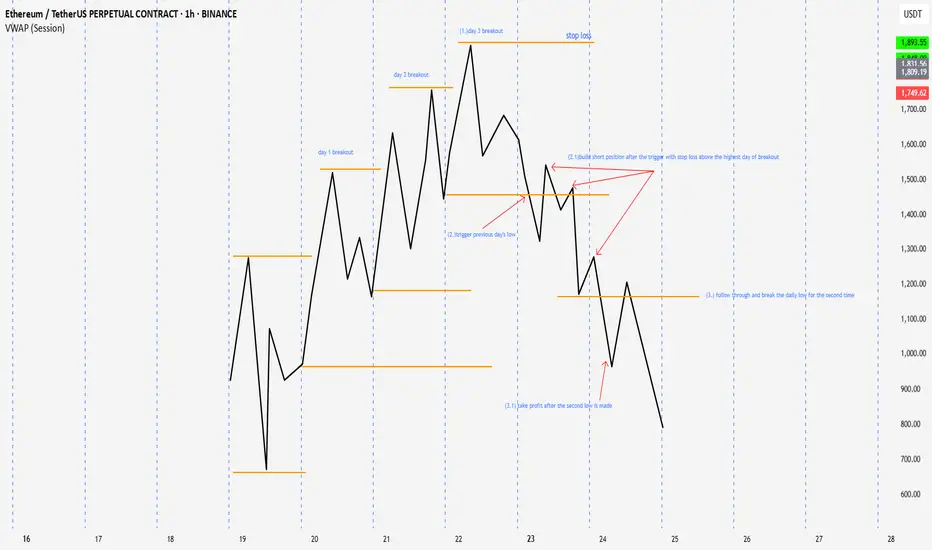
3 days of breakoutafter three days of break out and a break of daily level to the opposite side. it high probable that it will continue the break
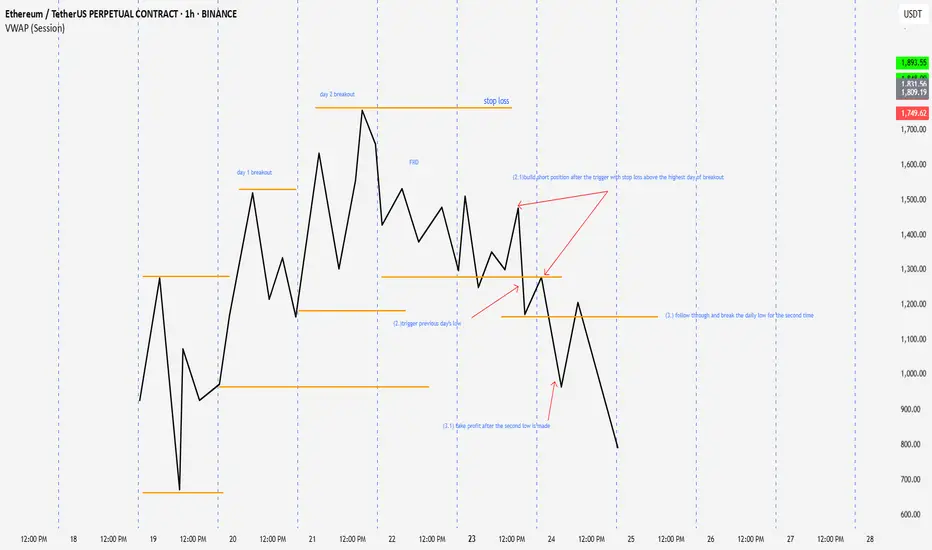
doing the homeworktesting 3days of breakout, frd,fgd, day one false break with the break of daily level as trigger to start to build position. for entry . buy if it dip below daily vwap during the sessions. stop is above the high or the low of the signal day. targeting the second push. for inside day, trying to capture the false break back to the other side or daily high or low 90% winrate. let see when I apply it in real time

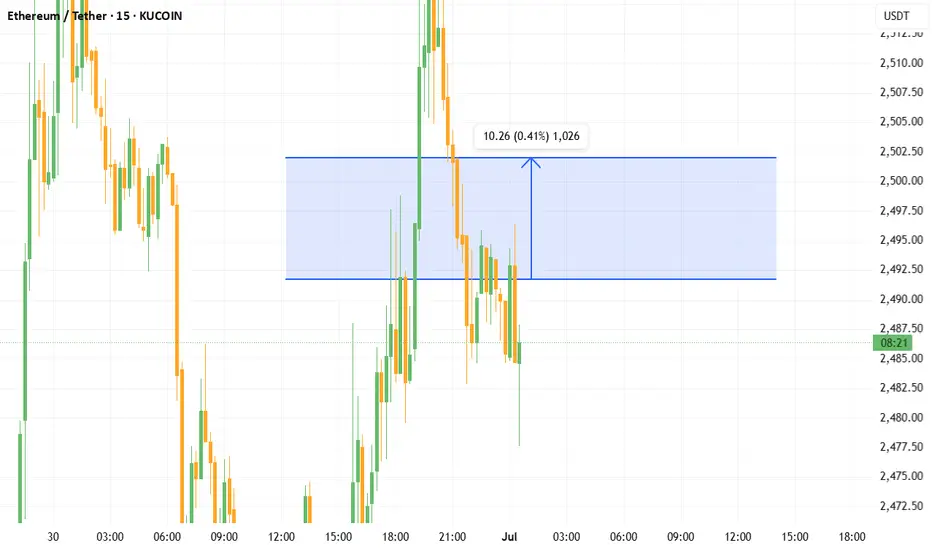
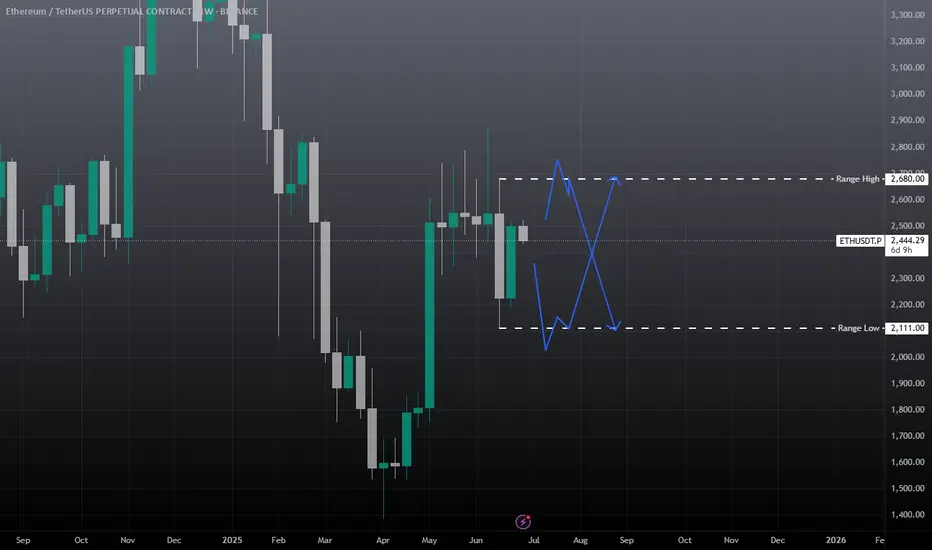
ethusdt no trade zoneETH is stuck in a range, wait for the sweep of range high, then closing below the range high and take the short, target weekly low. 2nd scenario is wait for to take out the weekly low and any daily candle closing failed to close below this level take the long entry and target the range high. Otherwise expecting this week choppy mean sideways. no major move. Will update if found any good trade.
Weekly trading plan for EthereumBINANCE:ETHUSDT Last week, price mostly traded in a range. For this week, I've updated key levels, marked them on the chart, and modeled several scenarios. We can expect a pullback—possibly a deeper correction—before another push toward resistance levels. If price breaks the local low but then reclaims the weekly pivot point, I'll consider opening long positions without waiting for a deeper pullback.
Write a comment with your coins & hit the like button and I will make an analysis for you
The author's opinion may differ from yours,
Consider your risks.
Wish you successful trades ! mura
