ETHUSDT.P trade ideas

ETH Started Another Impulsive Wave!ETH Started Another Impulsive Wave!
Today ETH ended another bullish wave and is expected to rise further.
The price reaction looks good so far. The market is expecting a rate cut by the FED during the September meeting. According to Reuters, the chances of a rate cut by the FED increase to 85.5%.
It seems that the cryptocurrency market is also absorbing the news and ETH could benefit from this volume in the short term to rise to 3850.
You may find more details in the chart!
Thank you and Good Luck!
PS: Please support with a like or comment if you find this analysis useful for your trading day
Drop to 4000 or trend reversal?We’ve been saying for days that Ethereum’s been climbing for no clear reason despite strong trend weakness, and now we can see it’s turning bearish for the moment. If this drop continues a bit more, many traders might FOMO-sell to lock in profits, potentially pushing the price down to 4000. It’s also possible that it finds support above 4000 and resumes the uptrend.

ETHEREUM USDT THE BREAK of KEY SUPPLY ROOF on daily will be watched and i hope that a retest to a broken supply roof holds firmly and i expect buyers to keep the buy energy into 4999-5000k based on the current structure.
#ethusdt #ethereum

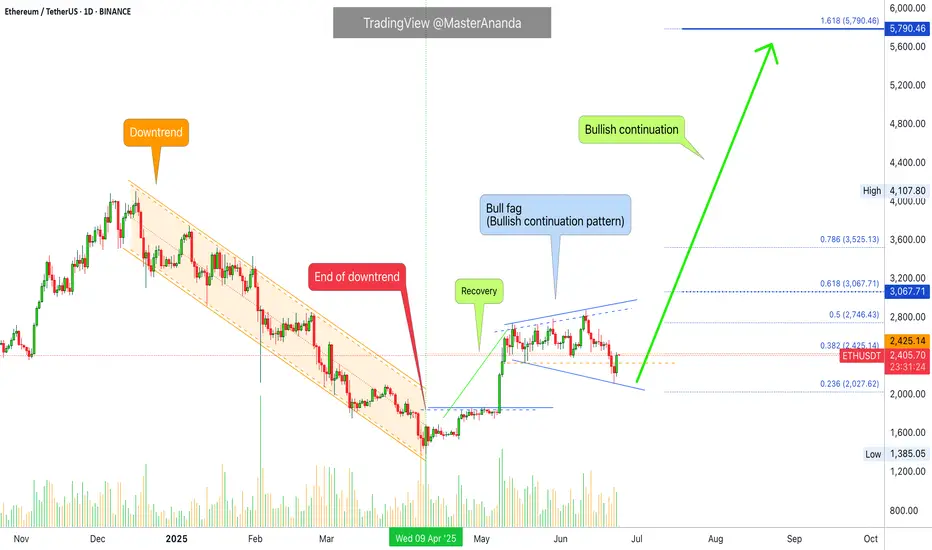
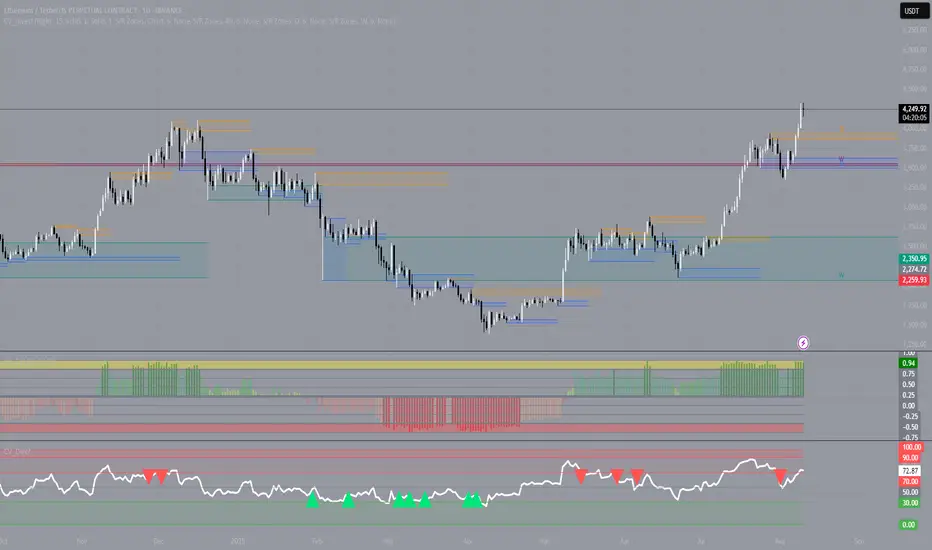
Ethereum vs Small Cap. & The 2025-26 Cryptocurrency Bull MarketThe last three days ended up being a very nice flush, a strong one but the action quickly recovered above the 18-May low.
Ethereum was trading above $2,300 since mid-May and always stayed above this level. It broke suddenly below, out of nowhere, but the action is bullish again. We can say that this was a stop-loss hunt event, a bear-trap and nothing more or else we would see a continuation of the bearish action rather than a strong inverse reaction, a bullish jump.
It is not only Ethereum of course that is experiencing this type of bullish action, some altcoins are going nuts. Really crazy right now producing so much momentum that people are still wondering if the market is going down... Or is it going up?
It is obviously up, just look at the 7-April low.
Ethereum hit a low of $1,385 on 7-April. The higher low yesterday ended at $2,111.
You see what I mean?
The market is ultra-bullish because the last low is so far away. It is impossible that it will be tested even less possible for it to break. Ok, so a market shakeout we agree but now that the shakeout is complete what is supposed to happen next?
Watch the smaller altcoins.
Thank you for reading.
Namaste.
ETH at resistance!Ok, finally ETH is making happy all his estimators but I jsut want to point out that it's close to ATH so maybe wait to see what happens before buying it. I'd wait for some short setup unless there's a stronk breakout!
I expect something like what I drawn there. I don't own a lot of ETH but remember that after ETH money will flows in big caps alts and that will make us happy.
Good luck!
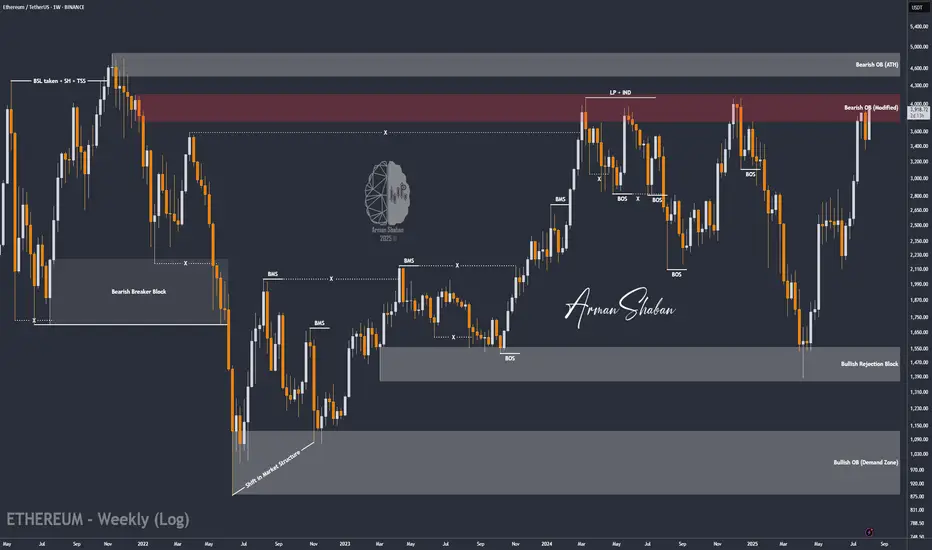
ETH/USDT | ETH Surges 18% – Next Targets Above $4000 in Sight!By analyzing the Ethereum chart on the weekly timeframe, we can see that, as expected, the price continued its rally, gaining over 18% and reaching $3969. It is now trading around $3915, and I expect this bullish momentum to continue, with the price soon pushing above $4000. The next targets are $4100, $4400, and $4900. This analysis will be updated soon!
Please support me with your likes and comments to motivate me to share more analysis with you and share your opinion about the possible trend of this chart with me !
Best Regards , Arman Shaban
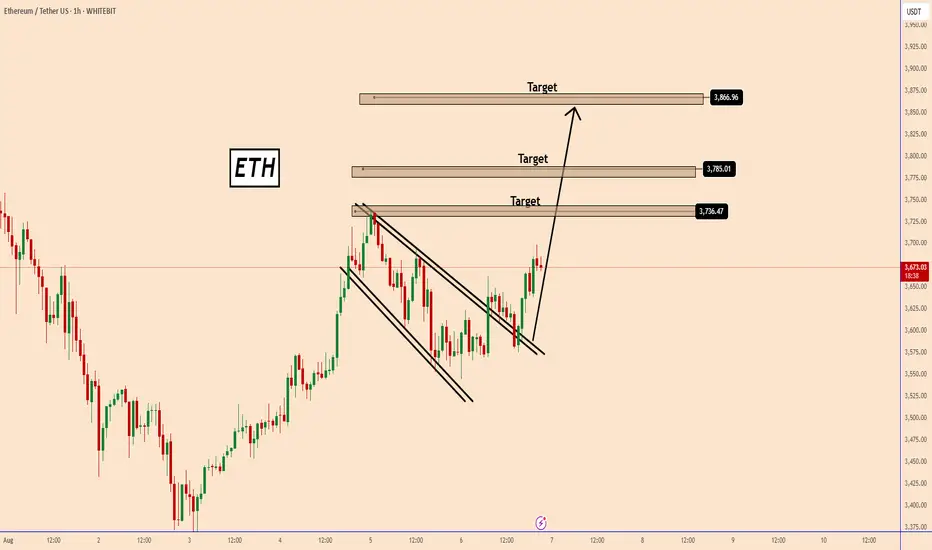
ETH/USDT at Crossroads — Bearish Divergence or Breakout Rally?Ethereum has been showing strong bullish momentum lately, but the chart is whispering a different story. On the 1-hour timeframe, I’ve spotted a Bearish Divergence, which often signals that buyers might be running out of steam.
📊 Trade Setup:
Pair: ETHUSDT
Timeframe: 1H
Trend: Bullish (short-term)
Divergence: Bearish
Bias: Neutral (waiting for confirmation)
Stop Loss (SL): 4383
Entry (EP): Sell Stop @ 4143
Take Profit (TP1): 3903
💡 Why I’m Watching This:
Ethereum has been holding strong above $4,000, supported by recent market optimism, ETF inflow discussions, and increasing network activity. However, macro data and BTC’s slowdown could cause ETH to retrace. Bearish divergence is often a warning sign that momentum is fading.
📈 My Plan:
If price breaks below 4143, I’m entering short towards 3903.
SL placed at 4383 to protect against sudden bullish spikes.
⚠ Risk Management:
Only risking 1% of my account on this trade. Remember — the market doesn’t care about emotions; it respects discipline.
💬 Your Turn:
What’s your bias on ETH right now — still bullish, or do you think a pullback is coming?
Drop your thoughts below 👇 and let’s discuss!
📌 Follow me for more live trade setups, technical breakdowns, and market insights.
💡 If you found this useful, share this post so more traders can spot the opportunity before it’s gone!
#ETH #CryptoSetup #BearishDivergence #TradingView #CryptoCommunity
#ETHUSDT #CryptoTrading #PriceAction #Ethereum #Divergence #CryptoCharts #TradingSetup #TechnicalAnalysis #SwingTrade #DayTrading #CryptoSignals #ResistanceBreakout #BearishDivergence #ChartAnalysis


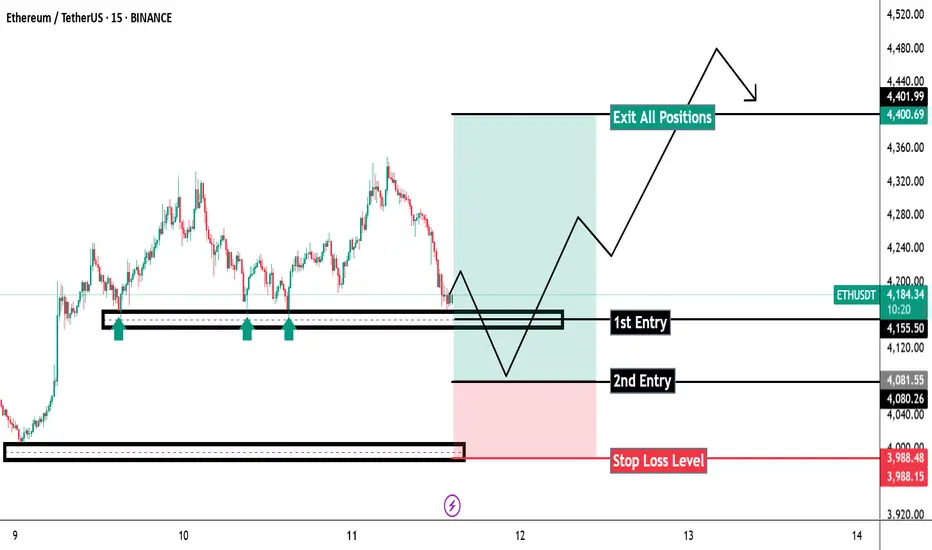
Can Ethereum Give Us Profit Before the Next Run to 4400?It feels safe to bid for BINANCE:ETHUSDT at 4100 right now and ride it up to 4400.
I will place my SL at 3.8k
Ignore this trade update if you don't know about position sizing and order scaling.
Let's see if this will cook.
What are your thoughts about this analysis? Let me know in the comments section.
If you like the analysis, like it and follow me for more trade updates.
ETH | Swing Long IdeaETH | Swing Long Idea
📊 Market Sentiment
Overall sentiment remains bullish, supported by expectations of a 0.25% rate cut in the upcoming FOMC meeting. A weakening USD and increased risk appetite across global markets are creating favorable conditions for further upside in crypto assets.
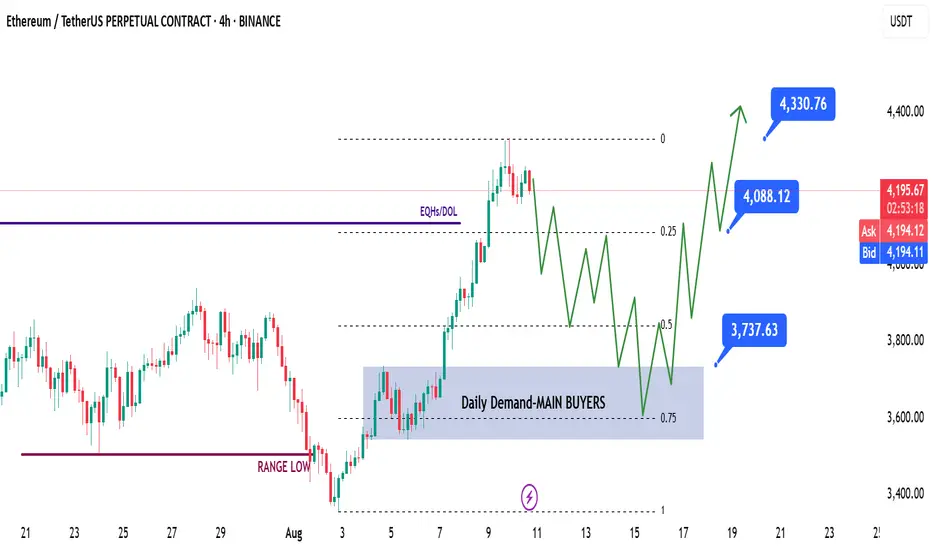
📈 Technical Analysis
Price has run the HTF liquidity level at $4100.
While the breakout above $4100 was aggressive, it appears price may require additional liquidity before pushing higher.
This idea focuses on a possible ETH retracement and continuation pattern over the coming days to weeks.
📌 Game Plan
If a deep retracement occurs, I’ll be watching the 0.5 Fibonacci discount zone and the 0.75 retracement level for optimal entries.
Key focus: daily demand zone at $3750 — ideally aligned with the 0.75 retracement.
I won’t wait for an exact touch of the 0.75 level; instead, I’ll watch for strength and a clear break of structure to trigger entries.
🎯 Setup Trigger
Look for a 12H–4H break of structure shift after the daily demand zone at $3750 is hit.
📋 Trade Management
Stoploss: 12H–4H swing low that caused the break of structure
Targets:
TP1: $4088
TP2: $4330
TP3: $5000 (possible swing point)
Will trail stops aggressively to secure profits as price moves in my favor.
💬 Like & follow if you found this breakdown helpful — more setups coming soon!
ETH Daily Recap & Game Plan – 15.08.2025ETH Daily Recap & Game Plan – 15.08.2025
📊 Market Sentiment
Overall sentiment remains bullish, supported by expectations of a 0.25% rate cut in the upcoming FOMC meeting. A weakening USD and increasing global risk appetite are creating favorable conditions for further upside in crypto assets.
Ethereum is approaching all-time highs, fueled by a $1B single-day ETF inflow. Additionally, rumors of potential SEC approval for Ethereum staking policy could directly boost ETH’s utility — strengthening the long bias.
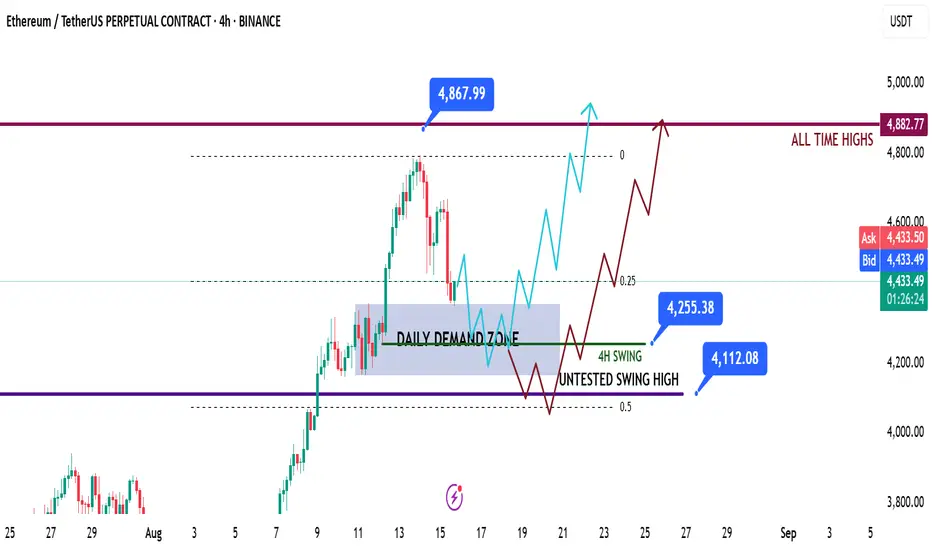
📈 Technical Analysis
Price has started a retracement move after Bitcoin reached new all-time highs.
Currently, ETH is testing the daily demand zone (blue box) — a level where we may see a reaction. For confirmation, I want to see a 4H break of structure before initiating any trades.
Since it’s the weekend, I expect some choppy price action and possibly a deeper retracement. I’m watching two potential scenarios (Blue vs. Red).
📌 Game Plan
Scenario 1 (Blue)
→ Price sweeps 4H swing liquidity at 4255$, then rejects.
Scenario 2 (Red)
→ Price dips deeper, tapping the untested swing high at 4112$ and possibly into the equilibrium discount zone (0.5 Fibonacci), before rejecting.
🎯 Setup Trigger
Waiting for a 4H break of structure before entering any position.
📋 Trade Management
Stoploss: 4H swing low confirming the BOS
Target: Run directly toward all-time highs at 4867$
💬 Like, follow, and comment if you find this setup valuable!
Disclaimer: This content is for informational and educational purposes only and does not constitute financial, investment, or trading advice. Always do your own research before making any financial decisions.
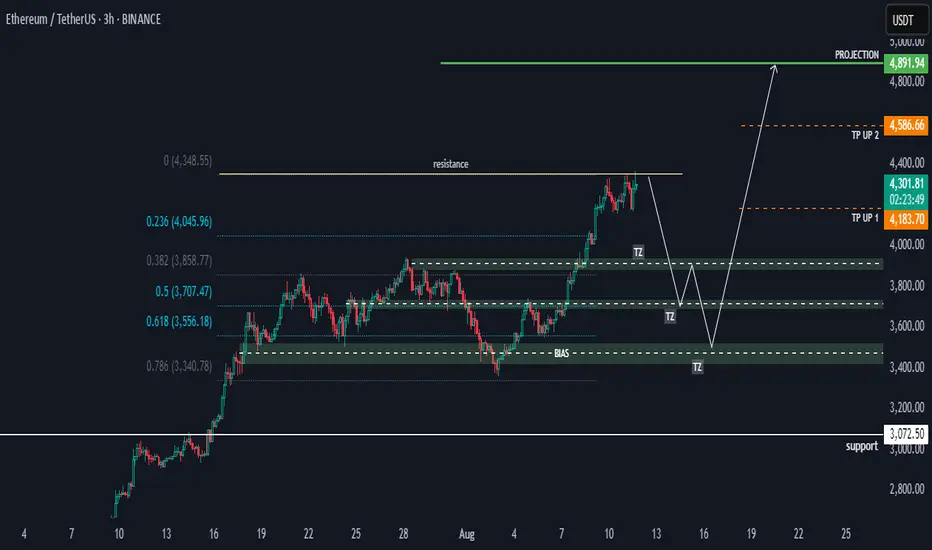
Ethereum (ETHUSDT) Momentum AnalysisHi there, let's take a look at ETHUSDT.
📱 Technical Overview:
- *Current Price: Approximately 4285, approaching a significant resistance zone.
- *Resistance Level: Near 4348, which has historically acted as a resistance level where price struggles to break through.
- *Support Zones: Identified around key Fibonacci retracement levels as follows:
- 0.236 at 4046
- 0.382 at 3859
- 0.5 at 3707
- 0.618 at 3556
- 0.786 at 3340
🎙️ Outlook:
- The price is consolidating near resistance right now, suggesting a potential bullish breakout or a rejection leading to a pullback due to the pin-bar price rejection.
- Fibonacci retracement levels indicate critical support zones, where price may find stability in those areas if a drop in prices occurs.
- Prior to starting an upward trend again, I anticipate a potential decline towards the support at about 3800.
- The projected targets (TP1 and TP2) suggest a bullish scenario where, following a retracement, Ethereum could rally towards 4890.
🧩 # Potential Scenarios:
1. *Bullish Breakout: If ETH manages to clear the resistance at 4348 with strong volume, then a rally towards higher targets could occur.
2. *Pullback and Rebound: If the resistance holds, then we can anticipate a drop to support levels near 3857 or 3556. A strong bounce from these levels could set the stage for future upward moves.
3. *Failure to Hold Support: A break below support zones could lead to deeper corrections; thus, it will need monitoring.
Happy Trading
Khiwe.
Not trading advice.
ETHEREUM bearish-divergenceA bearish divergence exists on Ethereum's daily RSI, but since $4,000 is broken, it should hold above that price.

ETHEREUM THE ETHEREUM STRUCTURE remains valid for now,the buy zone triggers in the face of profit taking ,watch the price action.

Altcoins and Altseason:How to Understand and Use Them in Trading
The cryptocurrency market has long moved beyond Bitcoin’s monopoly. Today, it consists of thousands of digital assets, each with its own technology, goals, and economic model. Among traders, two terms are frequently used — “altcoin” and “altseason,” and understanding them is essential for anyone aiming to earn consistently in crypto.
An altcoin is any cryptocurrency other than Bitcoin. The first alternative coins appeared in 2011, when developers sought to improve BTC by offering faster transactions, new algorithms, or additional features. Today, some of the most well-known altcoins include:
Ethereum (ETH) — the leader in smart contracts and decentralized applications.
Ripple (XRP) — focused on fast international transfers.
Cardano (ADA) — known for its scientific approach and energy efficiency.
Solana (SOL) — prioritizes ultra-fast transaction speeds.
Polygon (MATIC) — tackles blockchain scalability issues.
Altseason refers to a period when altcoins become the main growth drivers of the market, outperforming Bitcoin in both speed and volume of price gains. During this time, investors often take profits from BTC and move capital into other projects. As Bitcoin’s dominance declines, space opens up for alternative coins to rally. In such phases, traders shift their attention to promising technologies and big news stories, with many altcoin charts showing growth that far exceeds that of Bitcoin.
For a trader, altseason is not just a flashy market phase — it’s a period of maximum opportunity. With the right analysis, it can deliver returns that are hard to achieve during normal market conditions. However, the potential for high profit also comes with high risk. The altcoin market is known for sharp volatility, and choosing the wrong asset can result in losses just as significant as potential gains.
That’s why it’s crucial not only to understand what altcoins and altseason are but also to recognize them in time. This requires a combination of fundamental and technical analysis, tracking Bitcoin dominance trends, and using reliable trading tools that can spot shifts in market cycles. With a thoughtful approach, altseason can become the window of opportunity that opens the door to new results in trading.
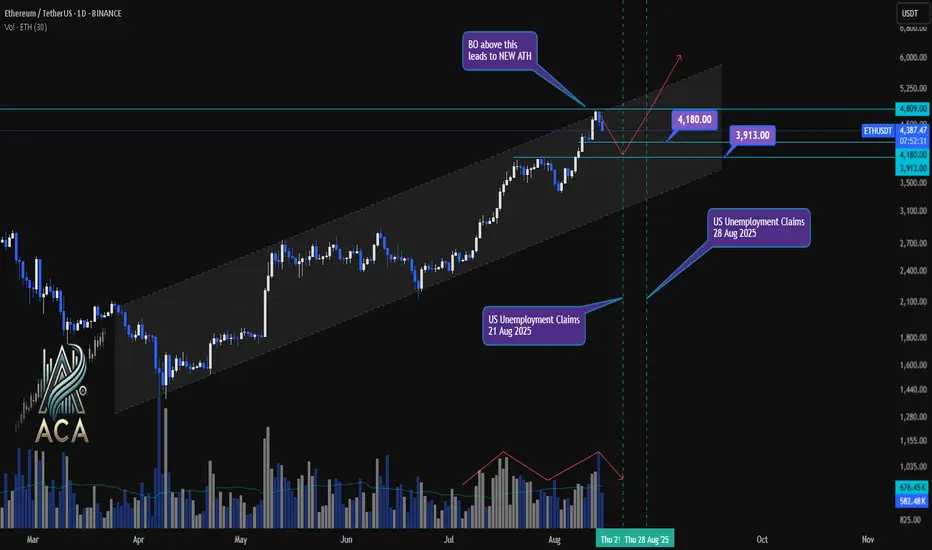
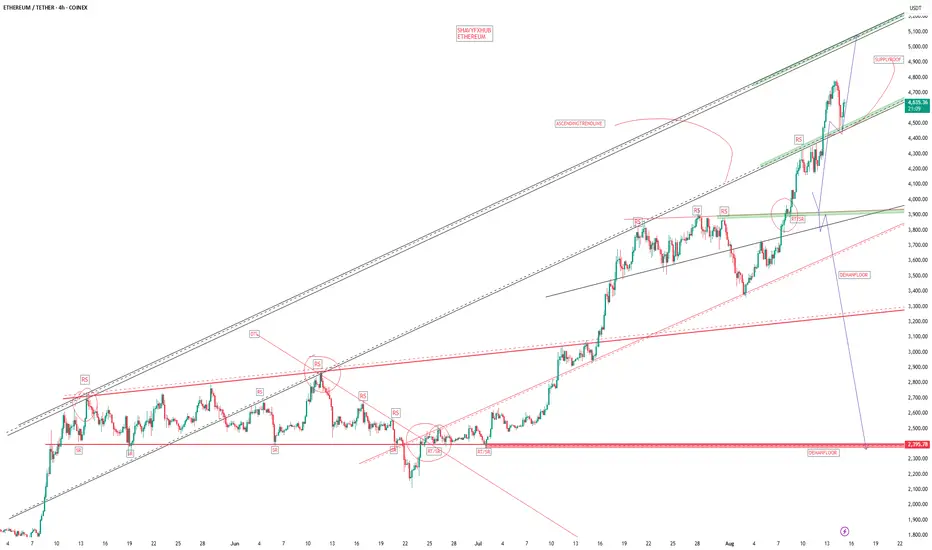
ETHUSDT 1D Chart Update | Channel Structure, Economic EventsETHUSDT 1D Chart Update | Channel Structure, Economic Events & ATH in Focus
🔍 Here’s the latest breakdown of ETH/USDT price action on the daily chart—channel dynamics, correction levels, and upcoming catalysts.
⏳ Daily Overview
Ethereum is trending strongly within an ascending channel, respecting both mid-level and upper resistance. After a local correction, price is rebounding with sturdy volume participation—signaling renewed interest from buyers.
📉 Correction Levels & Volume
- Recent correction found support at the $3,913 zone, with the $4,180 mark now acting as next key level.
- Volume has picked up on bullish candles, confirming the strength of this bounce.
- Correction appears healthy: price stayed within the channel, higher lows maintained.
📊 Channel, Economic Events & Breakout Setup
- ETH continues trading inside the established channel, posting higher highs and higher lows.
- Two major US economic events ahead—Unemployment Claims releases on Aug 21 and Aug 28, 2025—that could trigger volatility.
- Watch for a breakout (BO) above $4,809: crossing this sets the stage for a new all-time high (ATH).
🎯 Key Levels & Scenario
- $3,913: Correction support zone; ideal spot for high RR (risk/reward) long entries if retested.
- $4,180: Immediate resistance; flipping this could attract trend-following bulls.
- $4,809: Channel top and major breakout threshold. If price closes above, expect acceleration toward new ATH territory.
🚨 Conclusion:
ETH is pushing firmly inside its channel, with correction and volume patterns favoring bullish continuation. Key economic events may provide the volatility needed for a breakout move. Above $4,809, watch for new ATHs; dips to $3,913–$4,180 offer attractive re-entry zones for aggressive traders. Stay adaptive as August catalysts unfold.
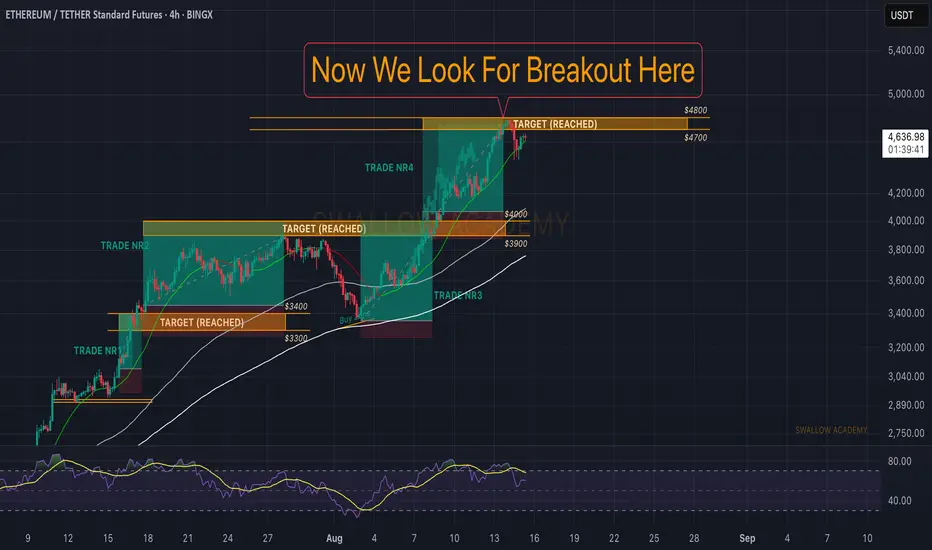
Ethereum (ETH): Still Looking For Proper Breakout | Not RushingEthereum has not yet broken the ATH zone, which means we are doing nothing!
Currently it is not very clear if we see that breakout or not or even when do we see it, but what we know is, if we see the breakout here, this will explode the chart heavily and that'here our r buy ent most probably will be sitting at as well.
Swallow Academy
ETHEREUM THE analysis is correct as we posted,ethusdt could retest that roof again and capping 5000k and above is possible and correction is likely too.
trade with caution and manage your risk.
#ethereum
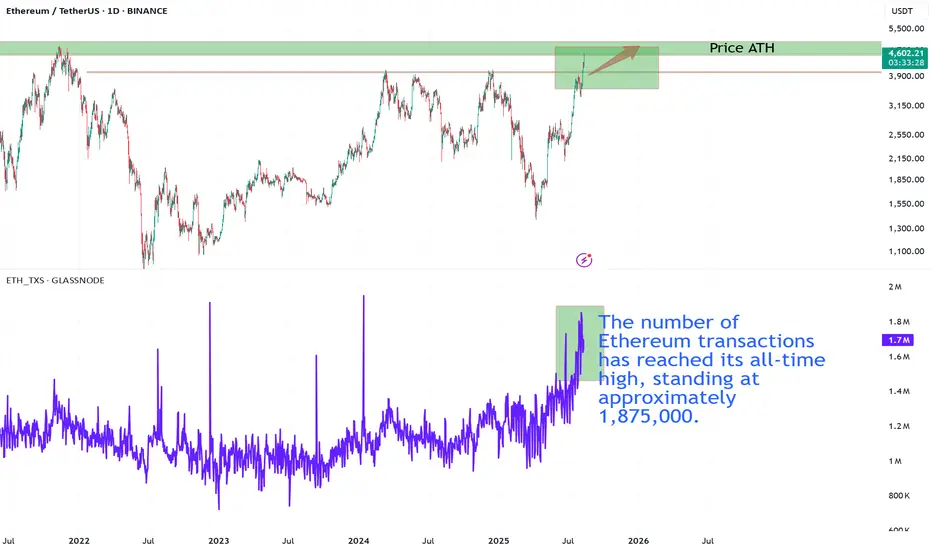
Ethereum Approaching Price ATH While Transaction Count Hits RecoEthereum’s network activity has surged to unprecedented levels, with daily transactions reaching an all-time high of approximately 1.875 million. This parabolic rise in on-chain activity reflects heightened user engagement and growing demand for block space.
On the price chart, ETH is now testing the critical resistance zone just below its historical all-time high (~$4,750). This is a confluence point — price is approaching a major supply area, while network fundamentals show peak activity.
Key points to watch:
A breakout above $4,750 with sustained transaction momentum could ignite a price discovery phase.
If sellers defend the ATH zone, short-term consolidation or a pullback toward $3,950 support is likely.
On-chain highs combined with price stagnation could indicate network overextension, warranting caution.
In summary, Ethereum is sitting at a junction where record network usage meets historical price resistance — the next few sessions could determine whether we see a decisive breakout or a rejection.
ETHEREUM THE DAILY KEY DESCENDING TRENDLINE HAS BEEN BROKEN,ethusdt is seeing buying momentum and if they keep this pace ,the trend could hit all time retest and a possible breakout.
#ethereum #ethusdt #cryto

Haven't Posted in a Bit, Here's a Solid Chart for You All!Alright, been a while, but here's the deal: still no altseason in sight.
Meanwhile, ETHUSDT dropping some serious hints of a wild bull run on this fractal chart. It s got that 2020 vibe, though the timing s a tad off especially when you factor in Bitcoin s cycles.
Gonna be a blast watching this play out!

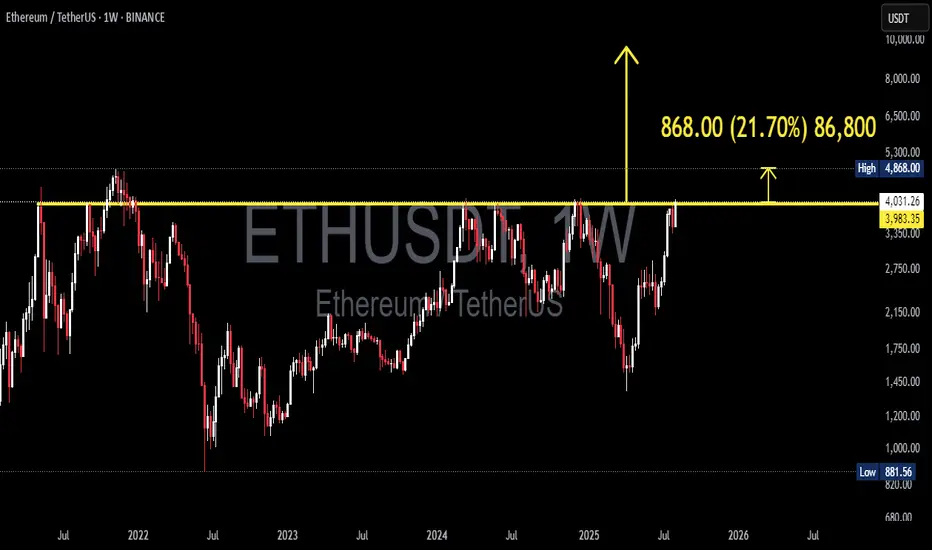
ETH/USDT — Resistance Around $4.0k: Breakout or Rejection?Summary
The weekly chart shows Ethereum testing a multi-year horizontal resistance zone around $3.9k–$4.1k, a level repeatedly tested since 2021. The measured move on the chart projects a potential target of $4,868 — about +$868 or ~21–22% upside — if a confirmed breakout occurs on the weekly timeframe.
---
Technical Analysis (based on chart)
Timeframe: Weekly (1W). The current test is highly significant due to the higher timeframe, with medium- to long-term implications.
Key Levels:
Major resistance zone: ≈ $3,950 – $4,100 (yellow line).
Breakout target: $4,868 (≈ +$868 or ~+21–22% from the breakout zone).
First support if rejected: ≈ $3,300 – $3,600. Stronger support at $2,100 – $2,750.
Price Action: Price has made multiple peaks at this zone (multiple tops), signaling strong supply. However, recent higher lows suggest growing bullish momentum — if a breakout occurs.
Pattern: Multi-year horizontal resistance. Possible outcomes:
Rejection: Acts as a triple-top / horizontal supply zone.
Breakout: Transitions into a range breakout setup with measured target.
---
Bullish Scenario (confirmation needed)
1. Confirmation signal: Weekly close above $4.0k zone with strong follow-through in the next week.
2. Entry strategies:
Conservative: Wait for a retest (resistance → support) before entering, with stop below retest (~$3.7k).
Aggressive: Enter on breakout, stop below breakout candle low.
3. Target: First target ~$4,868 (measured move). If momentum persists, higher targets may be reached.
4. Invalidation: Weekly close back below $3.7k–3.8k after breakout.
---
Bearish Scenario (if rejection occurs)
1. Confirmation signal: Bearish rejection candle (pin bar / engulfing) on weekly + no breakout close.
2. Entry strategies: Short or take profit on longs after confirmed rejection; ideally backed by bearish follow-through next week.
3. Target downside: First support $3.3k–3.6k; stronger drop could retest $2.1k–2.8k zone.
4. Invalidation: Weekly close back above $4.1k with strong bullish volume.
---
Risk Management & Notes
Weekly close is key — avoid reacting solely to intraday wicks.
Volume matters: No volume = higher risk of false breakout.
Position sizing: Keep risk controlled (e.g., 1–2% per trade), stops in logical zones.
Multi-timeframe check: Use daily chart for precise entries and watch for orderflow/news catalysts.
---
Pattern Notes
Multiple Tops / Horizontal Supply: Sellers have consistently defended this level.
Ascending pressure: Higher lows into resistance can increase breakout probability.
Measured Move: Distance from breakout zone to target is about $868 — matching the chart’s projection.
---
Hashtags
#ETH #ETHUSDT #Ethereum #Crypto #Breakout #Resistance #WeeklyChart #CryptoAnalysis #TechnicalAnalysis