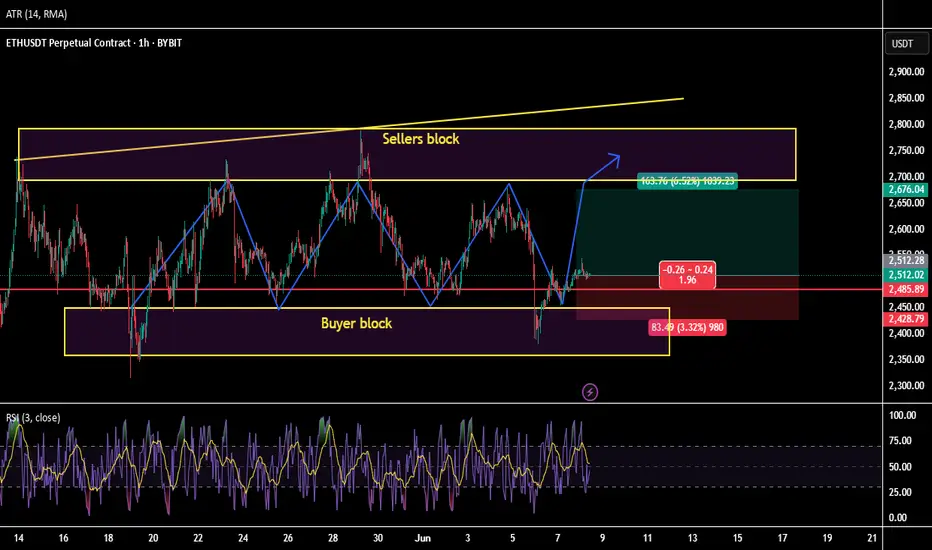
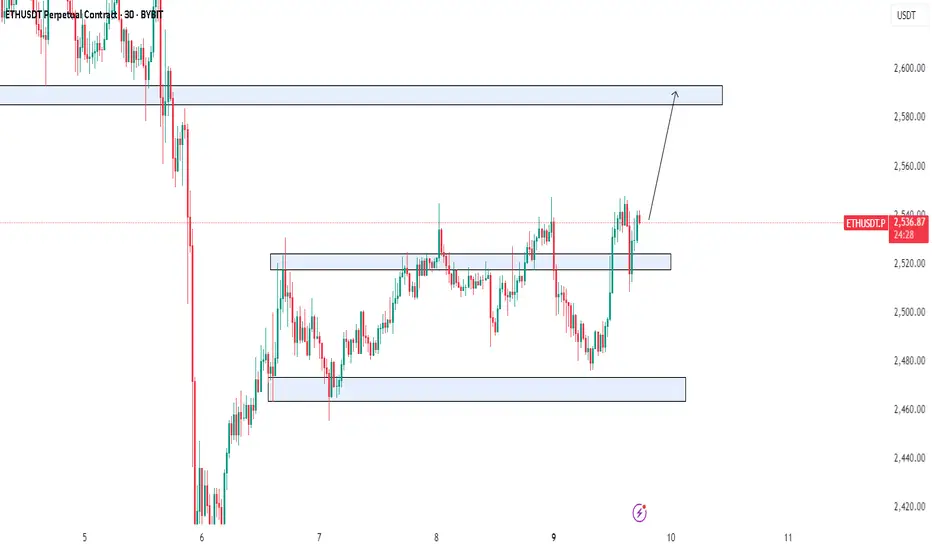
ETHUSDT/ Swing between blocks.Ethereum is moving towards the block. Volumes indirectly confirm the strength of buyers.
RR of the deal is greater than 2.
ETHUSDT.P trade ideas
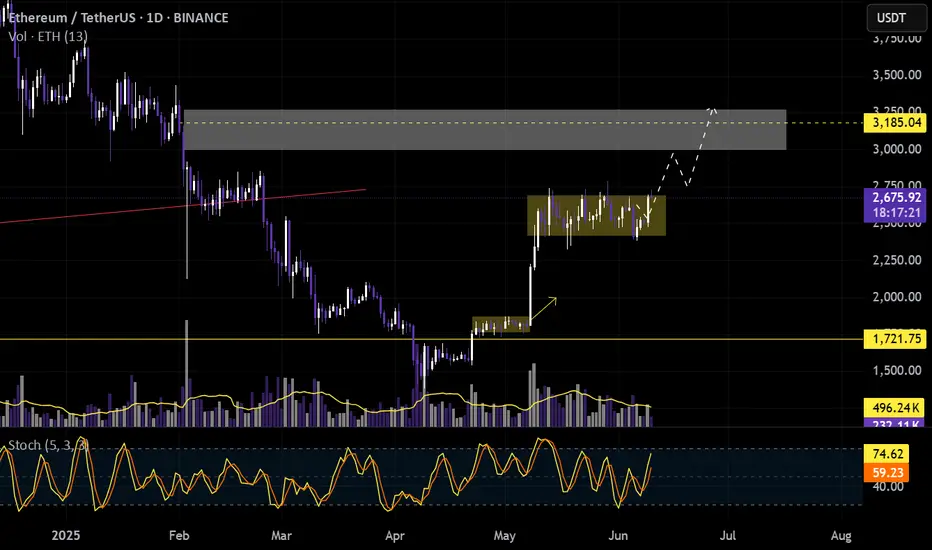
ETH is going for itAfter reclaiming the range, now the breakout on the daily RSI. Everything looks set for ETH.

$ETH Breakout Holding Support, Targeting $4KBITSTAMP:ETHUSD has broken out of its long-term downtrend and is now holding above key support at $2,440–$2,500.
Once strong resistance, this zone has flipped to support after a clean breakout and retest.
#Ethereum could rally toward $4,000 if this level holds a potential 66% upside.
Bullish structure, but always manage your risk.
DYRO, NFA

ETH/USDT possible breakout and buy continuationThe price hasn't made any new lows and is showing strong signs of buy trend continuation....since it already made a break and return to the zone its a possibility of a nice late trade.
ETH Road to RecoveryWhile the spotlight often shifts to short-term price action, Ethereum (ETH) is laying the groundwork for structural expansion that could surprise even seasoned investors.

ETH SELL SIGNAL 🚨 ETH SELL SIGNAL 🚨
Ethereum is flashing red on the charts! 🔻
📉 Target: $2496
High-probability setup based on price action + volume dynamics.
Perfect time to lock in gains or short the dip! 💰
Follow for more real-time crypto signals, smart entries, and profit-taking strategies. 🚀
#ETH #Ethereum #CryptoSignals #SellSignal #TradingView #CryptoTrader #Altcoins #ETHAnalysis
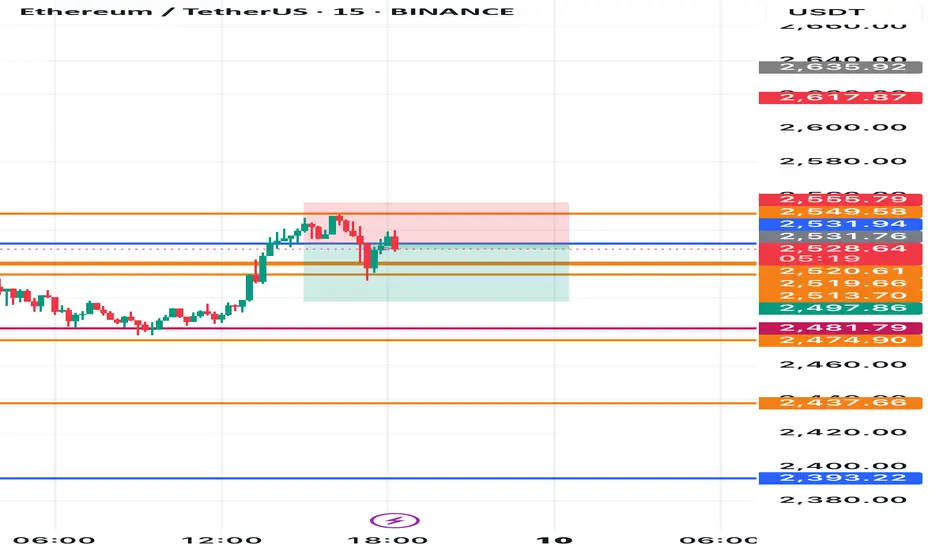
ETH play the boxes (Analyst Crypto Tantrik)📈 Your Strategy Guide: Trade with Confidence! 📉
Ready to elevate your trading? Here's a quick guide to understanding my strategy, designed to help you spot key entry and exit points.
🔵 Blue Zone: Your Bullish Base
* Bullish from blue zone: When the price is in the blue zone, it signals a strong potential for upward movement. Look for buying opportunities here!
* Bearish if breaks out blue zone: If the price falls *below* the blue zone, it indicates a weakening trend. This is your cue to consider bearish positions or exit long trades.
🔴 Red Zone: Your Bearish Barrier
* Bearish from red zone: When the price enters the red zone, it suggests a high probability of downward movement. Prepare for potential selling opportunities.
* Bullish if breaks out red zone: If the price surges *above* the red zone, it's a powerful sign of bullish momentum. This could be an excellent time to enter long positions.
🚀 Key Takeaway: The blue and red zones act as critical support and resistance levels. Understanding how the price interacts with them is key to making informed trading decisions.
Stay disciplined, follow your plan, and happy trading!
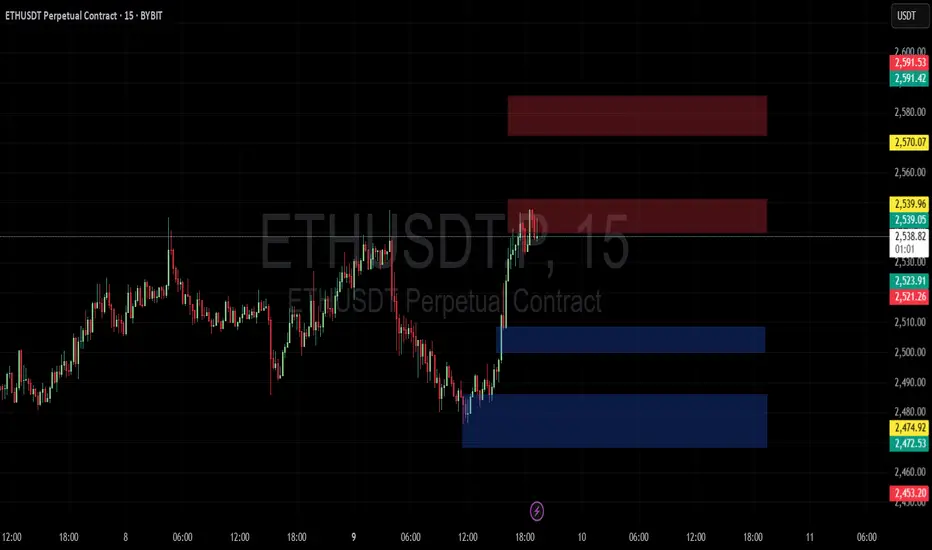
ETH DistributionThere is a potential extended model 1 going over into a model 2 on ETH. I look for entries at this extreme supply. The supply above and the speed its coming up is not optimal so let's see what happens.
ETH/USDT Price Action Analysis — Bullish Continuation Expected 📊 ETH/USDT Price Action Analysis — Bullish Continuation Expected 🚀
🔍 Chart Overview (as of June 9, 2025):
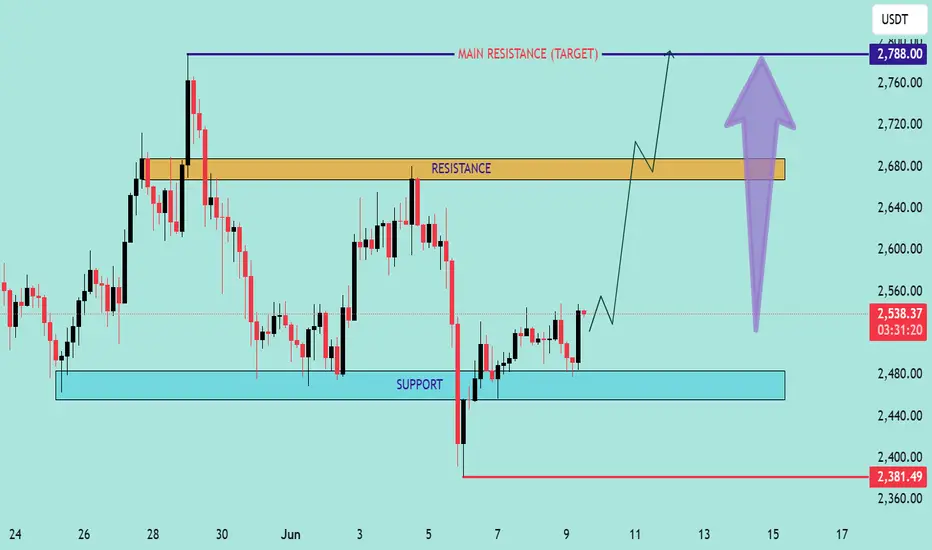
This chart of ETH/USDT highlights a well-defined support and resistance structure, projecting a potential bullish move toward a main resistance target at $2,788.00.
🧱 Key Zones:
🔵 Support Zone: $2,440 – $2,480
Price rebounded strongly from this area, showing buyer interest and liquidity absorption.
🟠 Resistance Zone: $2,660 – $2,690
Previously rejected zone where supply overtook demand. Price must break and hold above this for further upside.
🔺 Main Resistance Target: $2,788.00
If resistance is cleared, this is the next major supply area, acting as a potential take-profit level.
📈 Price Action Insight:
Price is currently hovering near $2,538.37, approaching resistance.
The chart suggests a potential breakout scenario after a short consolidation.
A bullish breakout above $2,690 could trigger a sharp rally toward the $2,788 target.
The chart projects a pullback-retest pattern (break, retest, and continuation) before the final leg up.
⚠️ Risk Management:
Invalidation Level: $2,381.49
A break below this level would invalidate the bullish setup and could lead to further downside.
✅ Summary:
Bias: Bullish 📈
Entry Area: Break and retest above resistance zone ($2,660–2,690) 🔓
Target: $2,788 🎯
Invalidation: Below $2,381.49 🚫
📌 Note: Always use proper risk management and confirm breakouts with volume or momentum indicators (e.g., RSI, MACD).
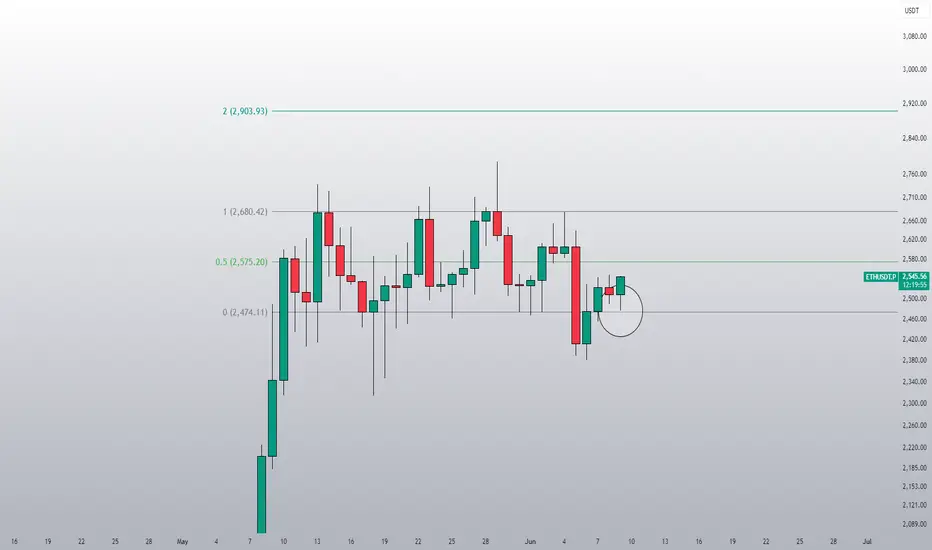
HolderStat┆ETHUSD retests 2300 pivotCRYPTOCAP:ETH dips to the 2 300 pivot where Ethereum bulls last ignited upside. Price still hugs an up-sloping guide; reclaiming 2 600 would re-target 2 800-2 900, though the 3 100 sell zone remains the big hurdle overhead.

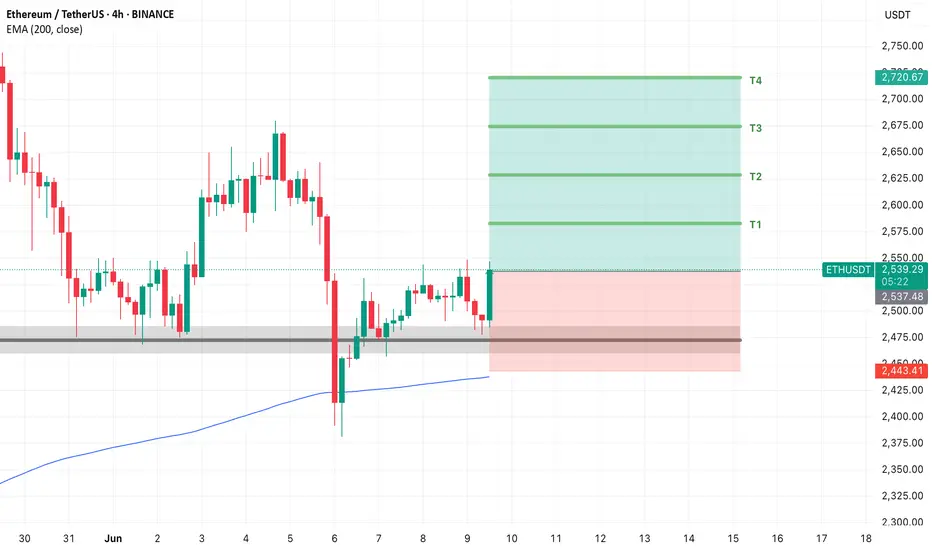
ETH USDT LONG TRADE SETUPETH/USDT is currently holding at a strong support zone, with a high probability of an upward price move. Additionally, the 200 EMA is providing strong support during the retest.
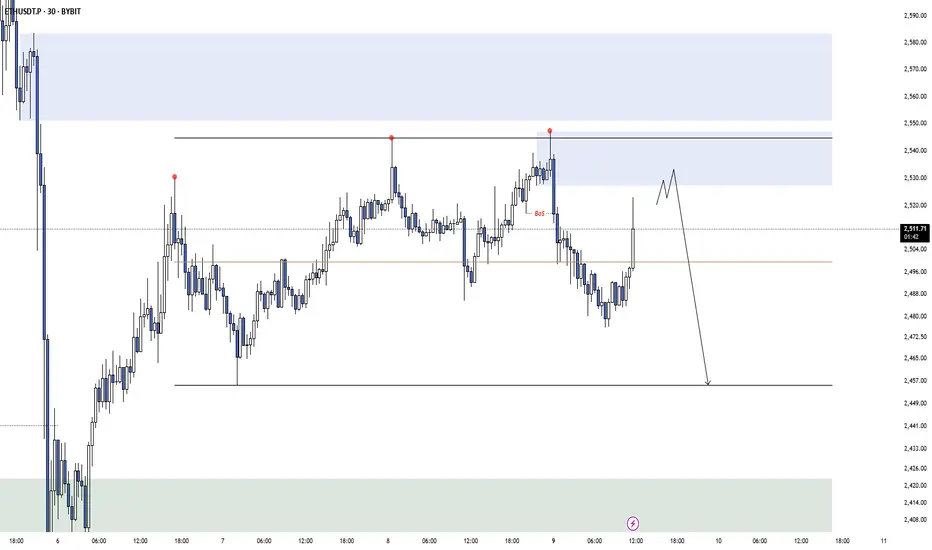
This is a textbook example of price action on ETH!After trading back above it, the price retreated to the lower band of the range. This is exactly the price action we want to see in order to confirm that the break below the range was a fakeout. This suggests that we will most likely see a real breakout above the range at some point, with much upside potential.
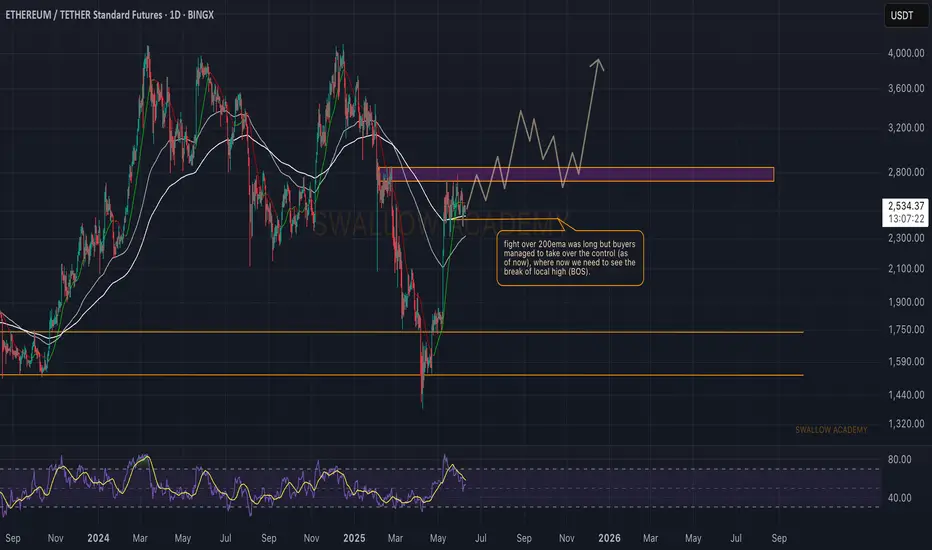
Ethereum (ETH): Fight Over 200EMA | RSI Stable | Bullish AFEthereum is back at 200 EMA, where buyers are not giving the area away so easily, yet sellers still show the pressure. What we noticed was that RSI stabilized here, giving us an opportunity for a proper breakout to happen, which would lead us to our upper targets being reached on a bigger timeframe.
Swallow Academy
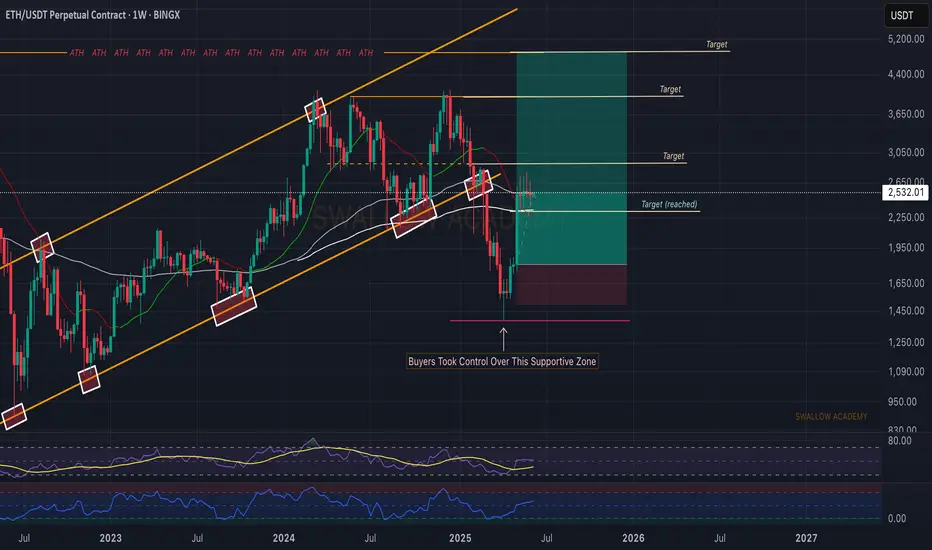
Ethereum (ETH): Time For ETH To Shine | Bullish!Ethereum has done very well so far, where we have established the bottom for the weekly timeframe and also got a good entry for the long position here.
Now, while we reached our first target we are still looking for further movement to upper zones, filling rest of our target. This would be the next step for upcoming bull market, where liquidity will fall into ETH and coins on ETH ecosystem.
Swallow Academy