ETHUSDT Bullish Continuation Setup Targeting Major ResistanceTrade Setup Analysis
Timeframe: 4H (Four Hour)
Position Type: Long (Buy)
Entry Point: 3,954.58
Positioned exactly between the stop loss and take profit zones, indicating a strategic entry at the base of the bullish setup.
Stop Loss (SL): 3,693.78
Placed below a key structural support. A drop below this level would invalidate the bullish scenario. Risk is approximately -6.59% from entry.
Take Profit (TP): 5,097.24
Target set at a major resistance zone, offering a potential upside of around +28.89% from entry.
Risk/Reward Ratio: 4.38
A strong setup with over four times the reward potential compared to the risk.
Technical Outlook:
ETHUSDT remains in a strong uptrend, with the current setup leveraging a pullback entry before a potential continuation toward higher resistance levels. The large reward potential makes this an attractive swing opportunity.
Bullish Scenario: Holding above 3,954 could trigger renewed buying, pushing price toward 5,097.
Bearish Invalidation: A breakdown below 3,693 would indicate momentum loss and potential reversal.
Summary:
This setup aims to capture a strong bullish continuation from a favorable entry point, with a tight stop under structural support and a target aligned with the next resistance level.
ETHUSDT.P trade ideas

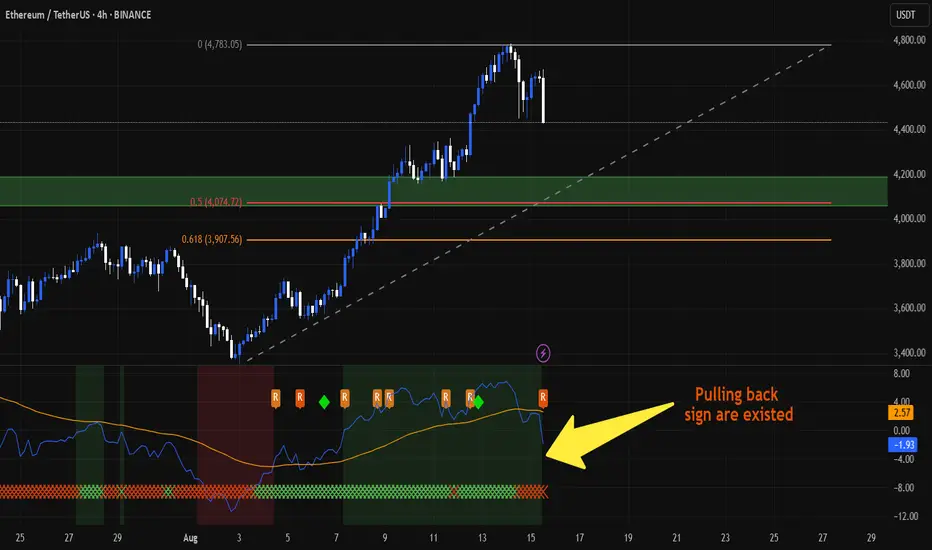
Ethereum PullbackETH is dipping to the 🔥 $4,000 zone — strong resistance + 50% Fibonacci level.
💡 Could this be the perfect entry for the ones left behind? 🚀
Pullback sing in the NEW RSI indicator.
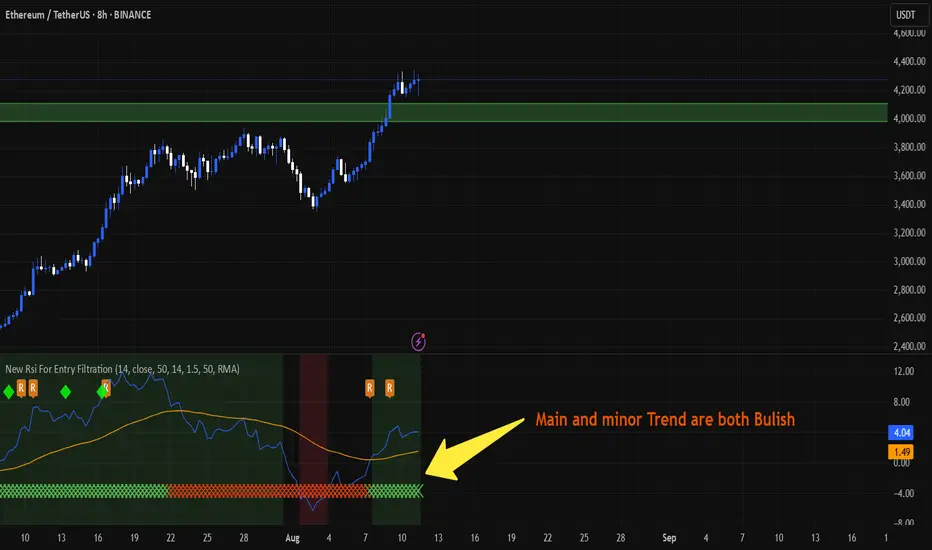
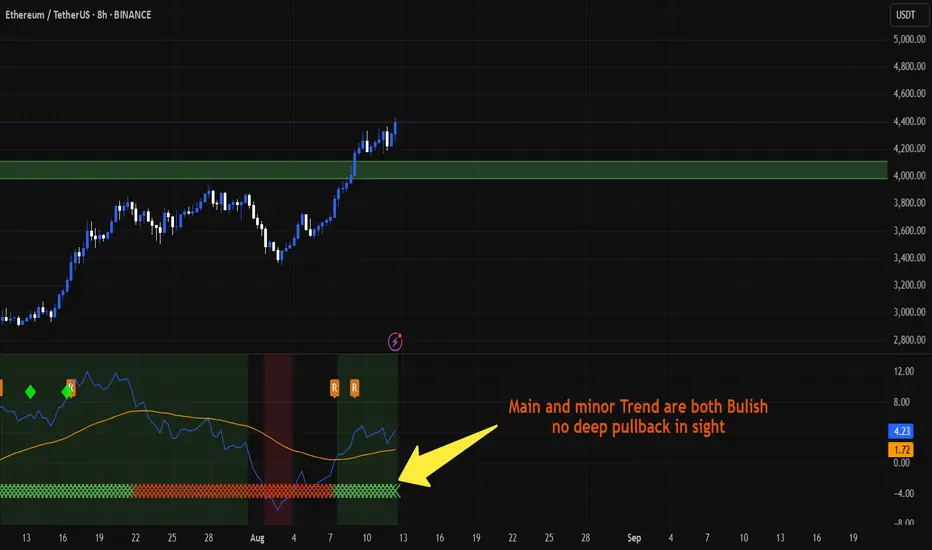
Ethereum bullish expectations?Ethereum has been consolidating above $4,000 for a few days. There is no sign of a pullback in the 8-hour timeframe. If Bitcoin does not fall, it is likely to move towards $5,000. Of course, the Fed rate at the upcoming meeting is very crucial.
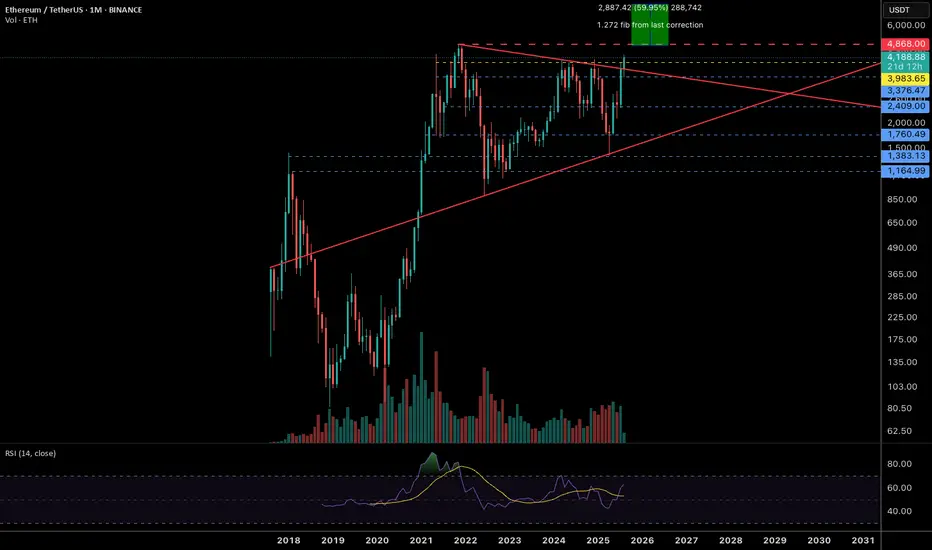
ETH/USDT Monthly ChartJust another learning experience. Thinking ETH hits the fib 1.272 spot from the correction once it clears ATH.
Ethereum above the $4300 level ┆ HolderStatOKX:ETHUSDT broke above the $4,000 mark after a healthy -14% pullback, signaling continuation toward $5,000–$5,200. Support at $4,000 remains the key level for bulls.

ETHUSDT is in Bullish TrendETHUSDT is showing a good bullish trend but there is a divergence showing on daily chart which indicate it can be slow down or it can make an lower high and if the price maintain between 4000 to 3800 then it can go for the next higher high and continue the bullish trend for a while or if the price breaks down side then it can go toward 2800 which is good for buyers
$ETH Weekly Analysis – ATH soon?ETH is testing the upper boundary of the green zone (~4340–4350), which is acting as key resistance, very close to its ATH.
Scenarios for this trading week:
Bullish : a confirmed breakout and close above 4350 opens the door to the 4,600–4650 target zone, with strong resistance ahead at 4860 (previous all time high zone). If buyers show strength, we can see new All-time High (~4900-5000).
Sideways/Correction : price could move in the 4000–4200 range for consolidation.
Bearish : а drop below 4000 could push ETH down to 3500–3650, even toward the key support around 3300 if the selling pressure grows.
Daily RSI is at 74, that means it's deeply overbought, so be cautious about your long positions.
Disclaimer: The author’s opinion may not align with yours.
BYBIT:ETHUSDT
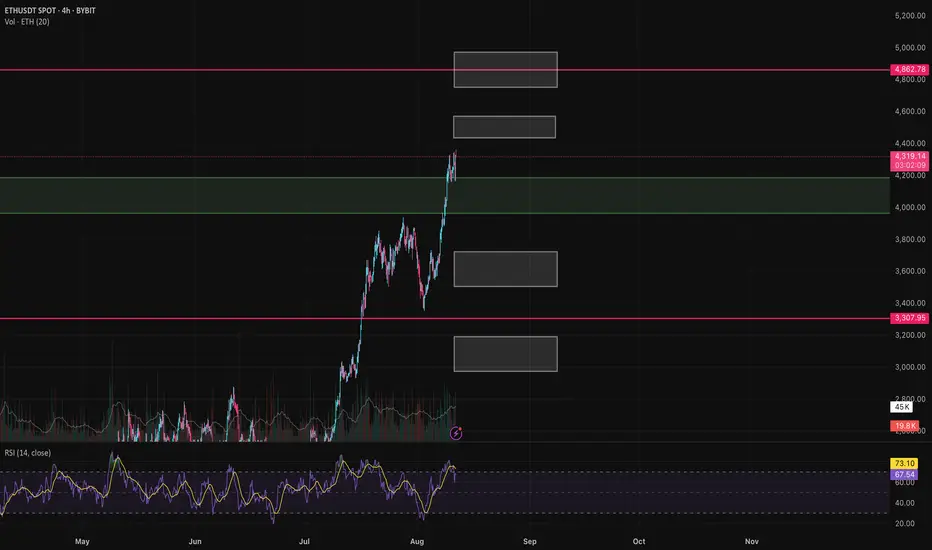
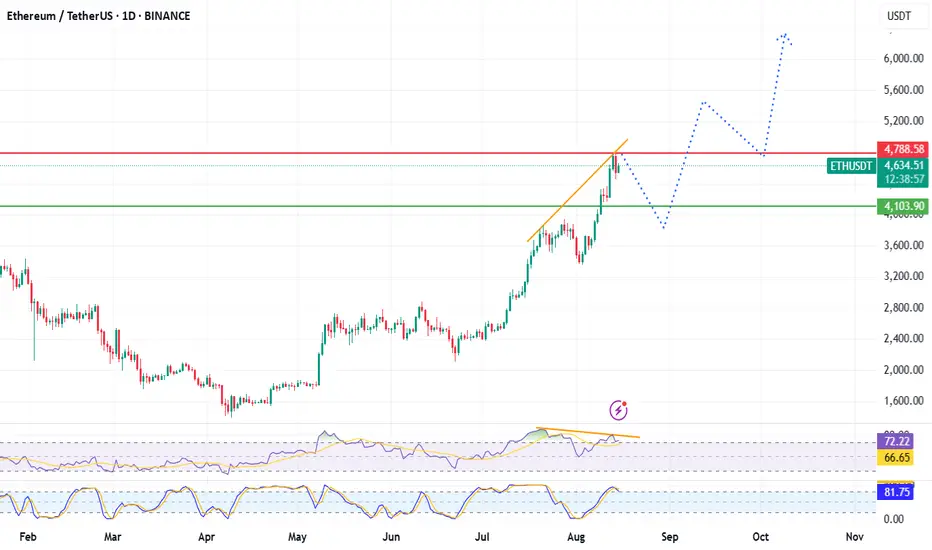
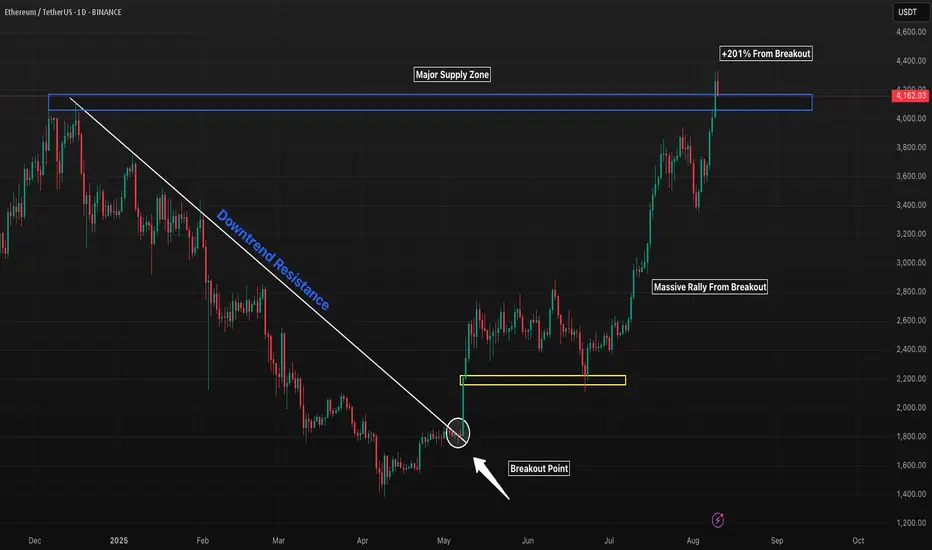
ETH 1D Breakout Returns Price to December HighsEthereum broke a long-term downtrend in May, retested the breakout zone, and launched into a powerful rally that has now brought price back to the December 2024 high supply zone. This area is a key decision point — a clean breakout could lead to new highs, while rejection here may trigger the first real pullback since the rally began.
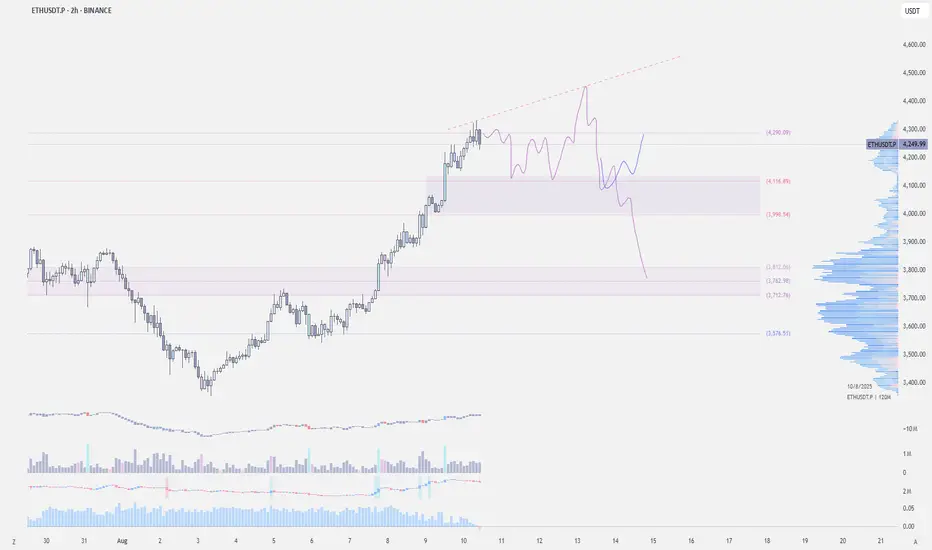
$ETH - Secondary Upthrust CRYPTOCAP:ETH | 2h
Possible LTF setup:
- Bounce around 4.1k–4k
- Initial supply retest at 4.2k–4.3k
- Retrace at 4.1k
- Secondary upthrust towards 4.4k–4.5k
local support 4k - holds for bullish continuation
Break below - likely test of 3.8k–3.7k
ETHEREUMETHEREUM continues to see influx of institutional demand and if the chart go as predicted Ethereum could get to 6k or more.
12th and 14 th will present strong UNITED STATE economic (CPI AND CORE PPI) outlook which give forward guidance for Ethereum.
trade with caution and think like a hunter
YOUR RISK TO REWARD COMES FIRST.
YOUR LIQUIDITY IS YOUR ONLY POWER IN THIS SPACE.
PROTECT IT.

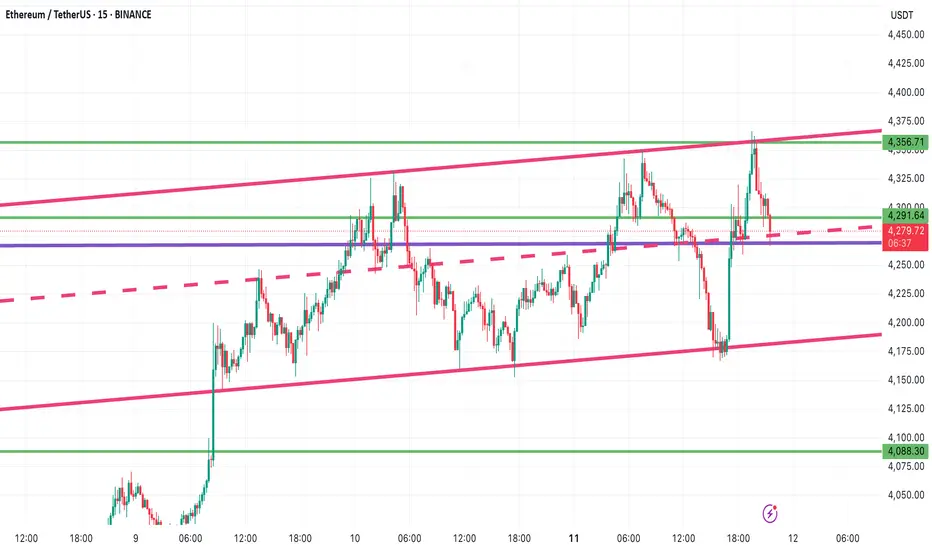
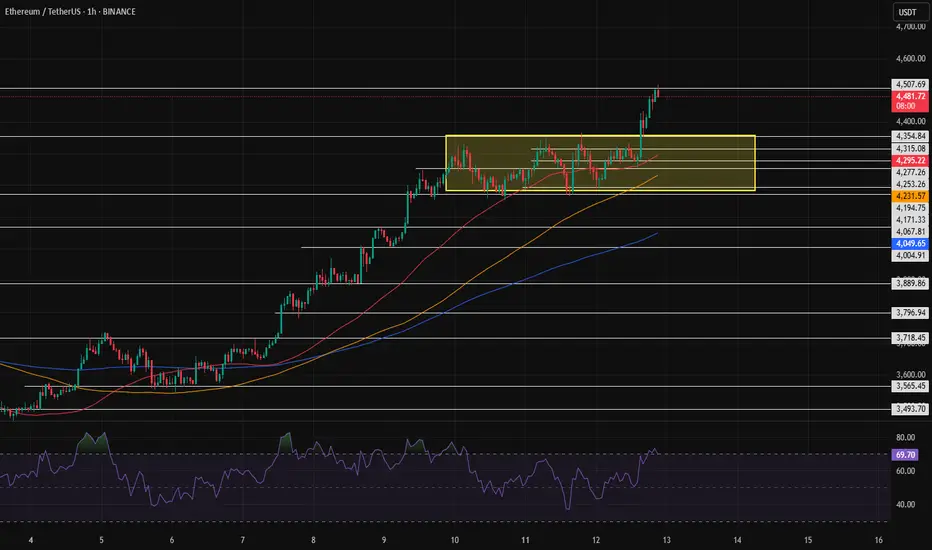
Ethereum (ETHUSDT) Technical Analysis – August 11, 2025📊 Ethereum (ETHUSDT) Technical Analysis – August 11, 2025
Ethereum is currently moving inside an ascending channel.
📈 Bullish Scenario:
If ETH holds the midline of the channel as strong support, the first target will be $4,317.
Next targets: $4,335 and $4,356 if this level breaks.
📉 Bearish Scenario:
If ETH breaks below the channel midline, the next supports are $4,248 and $4,226.
Losing these supports could push the price toward the channel bottom.
⚠️ Note: Wait for strong candlestick confirmation before entering any trade.
#Ethereum #ETHUSDT #Crypto #TechnicalAnalysis #PriceAction #Trading #ETH #CryptoTrading #Altcoins #Blockchain
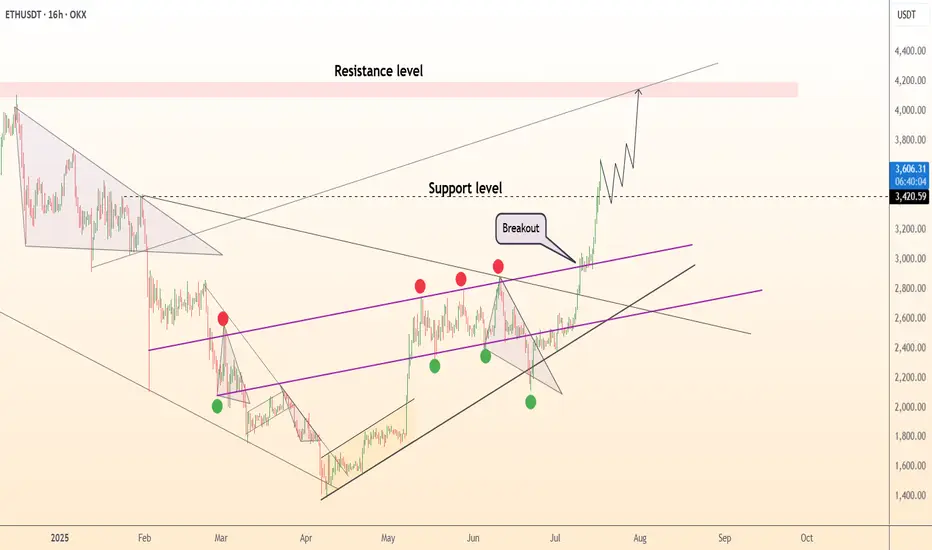
DeGRAM | ETHUSD retest of the support level📊 Technical Analysis
● ETH exploded out of the purple median channel, invalidating March-July lower-highs; retest of 3 210 held as a fresh higher-low, confirming trend acceleration.
● Price is now travelling the channel’s outer parallel; flag pole projected from the 2 430→3 210 thrust aligns with the 4 150-4 250 supply zone shown in pink.
💡 Fundamental Analysis
● CME ether futures OI hit a 14-month high on 17 Jul while exchange balances dropped to a five-year low, signalling strong institutional demand and tight float ahead of expected spot-ETF approvals.
✨ Summary
Long 3 210-3 300; hold above 3 210 targets 3 600 → 4 200. Bull view void on a 16 h close below 3 020.
-------------------
Share your opinion in the comments and support the idea with like. Thanks for your support!
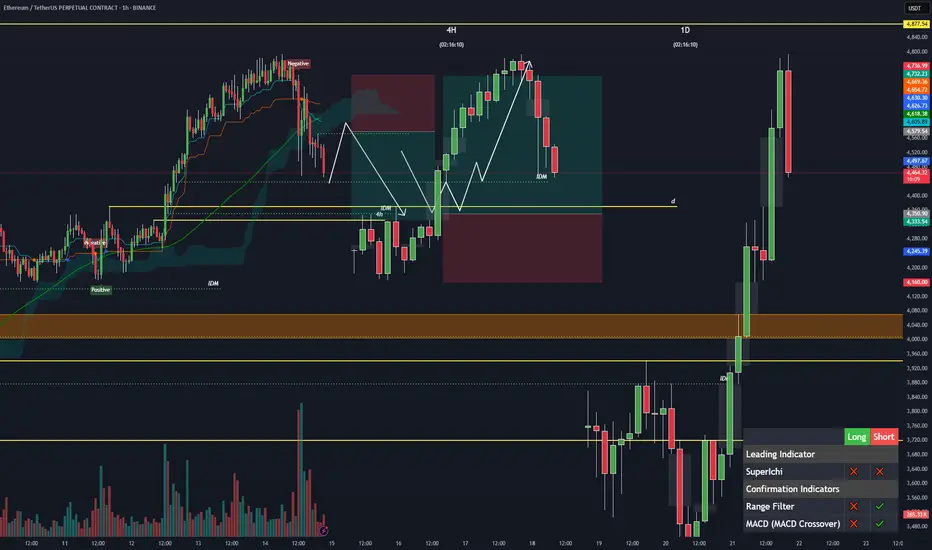
ETHUSDTmy expectation it is but there is most important thing is that even if eth drop to 4000 usd then there will not be any change on chart. Our way will just up but if we are in bull market then we have to push idm fvg and mitigation which is daily or weekly. I have to see that 3 combination.
Let see!!
Market update for EthereumAs for BINANCE:ETHUSDT , setting a new ATH is only a matter of time — most likely today or tomorrow.
The price is currently in the resistance zone, with red candles appearing, so a slight pullback to 4,500 is possible before breaking the ATH. It’s easier to track this on a lower timeframe — just don’t even think about shorting the highs.
The first two targets have already been reached, and the final target is right at the ATH level.
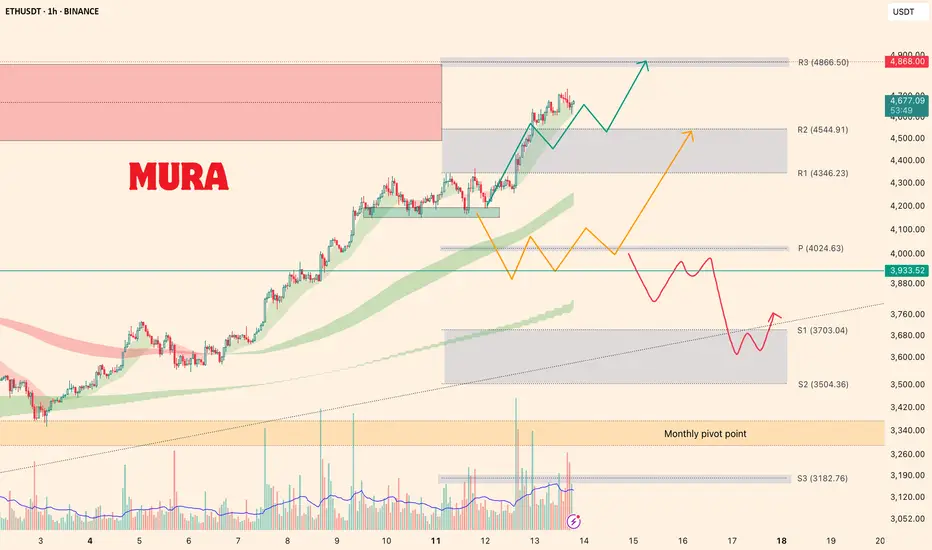
Crypto Alert: Ethereum Nears ATH—The Next Bull Run AwaitsEthereum Market Analysis
Over the past week, Ethereum has outperformed every other major asset. The primary driver behind this rally has been significant institutional inflows, largely due to ETFs attracting substantial capital. Additionally, today’s CPI report delivered highly positive data, further boosting momentum.
Ethereum has now crossed the $4,500 mark and is attempting to break its all-time high (ATH). The probability of breaking the ATH is high, after which I expect a retracement towards the $3,800 range.
At present, if ETH secures a daily close above $4,600, we are likely to see a new ATH. However, if it fails to close above that level, the chart shows two Imbalance (IMB) zones below. In that case, I expect a pullback towards those levels before another strong upward move.
My plan is to initiate buying from those lower levels and hold for long-term targets of $5,000–$6,000. Ultimately, I see Ethereum potentially reaching $10,000 in the future.
BINANCE:ETHUSD
How far does it want to go?Ethereum has been showing trend weakness for a long time, yet it keeps climbing. It’s not offering any entry points, and right now it’s at a very risky spot for buying, since a correction could happen at any moment.
is ETH about to steal the show?Despite a slight drop in Bitcoin, Ethereum continues to be strong. Currently, the NEW RSI indicator shows overall bullish conditions and there is no news of a deep pullback.
Ethereum (ETH) Price Hits 3.5 Year High; Nears ATH Of $4,891BINANCE:ETHUSDT is approaching a significant milestone in August, trading at $4,182, a 3.5-year high . The altcoin breached the $4,000 mark over the weekend, setting its sights on the next target of $4,891. This strong upward momentum suggests Ethereum could make history if it sustains its growth.
At $4,303, BINANCE:ETHUSDT is 17% away from its all-time high (ATH) of $4,891 . To reach this ATH, ETH must first secure $4,500 as a stable support level. A successful consolidation above this threshold could set the stage for ETH to continue its bullish ascent towards the ATH.
However, if investor sentiment shifts and selling pressure increases, BINANCE:ETHUSDT could struggle to maintain its position above $4,000 . A decline below this level would invalidate the bullish outlook, potentially reversing the recent gains and sending ETH lower.

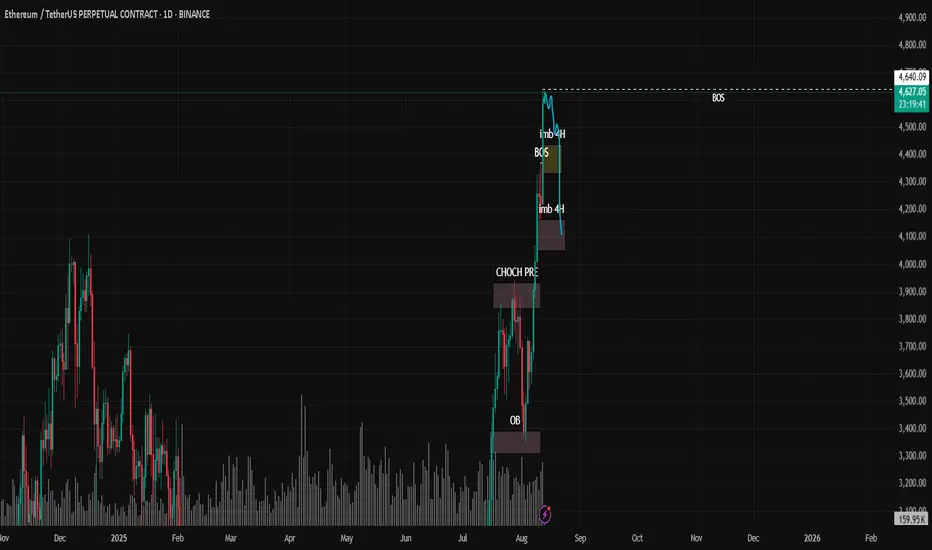
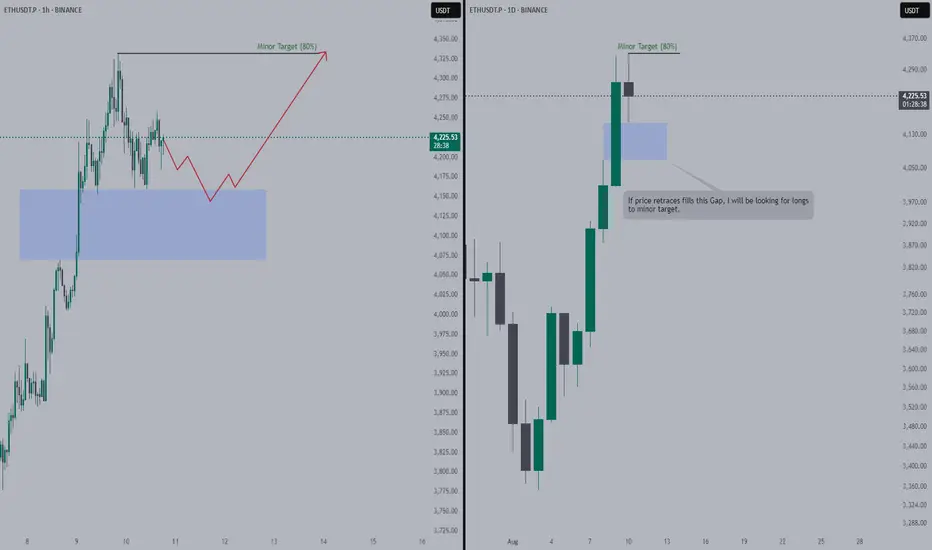
Ethereum Will Retrace to Fill the Daily GapConfirmation: Once price fills the imbalance/gap
Opportunity: I will be looking for longs between the Gap and the Target.
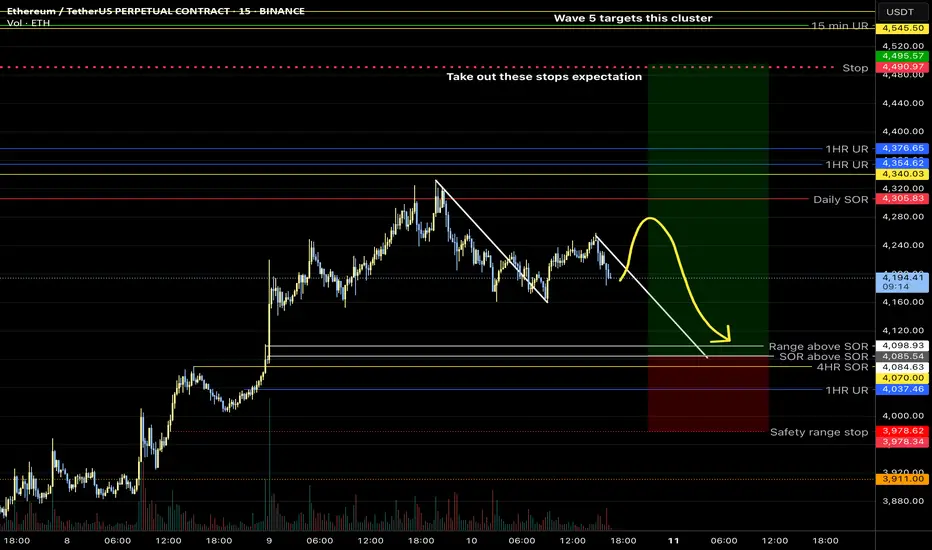
3.8 RRThe target for this trade is somewhat ambitious. Therefore, if the entry is filled, at either of the white lines, please protect profits once entered. One could exit sooner for a safer trade.
Etherum to test resistance BINANCE:ETHUSDT My prediction 5% increase till monday. no more bear cycle here. gonna test resistance at 4500 if it clears, then resistance at 4600. resistance at 4600 seems weak, so we can expect target closer to 4700.

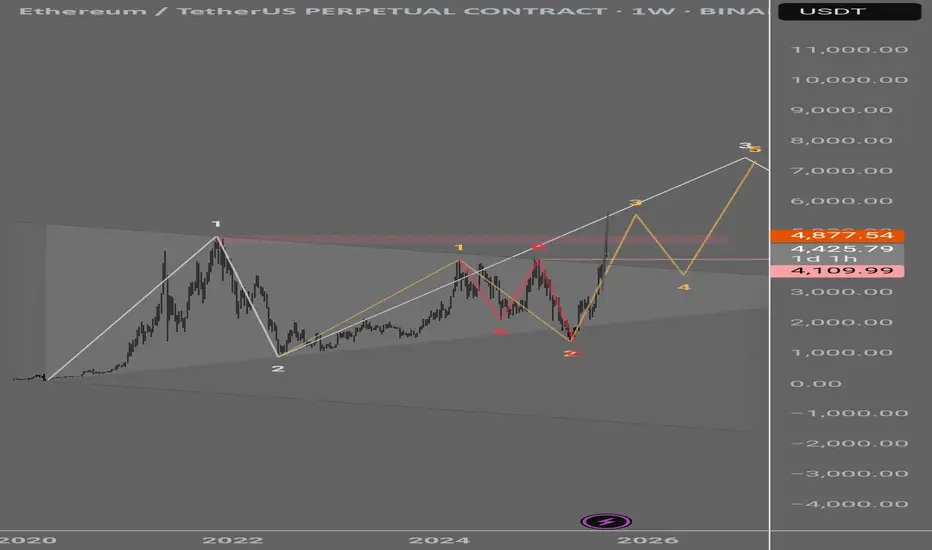
ETH on track for new All-Time Highcurrently, Ethereum is moving within a channel on the daily timeframe and the midline of the channel has temporarily limited further price growth. this price correction could present an entry opportunity for those who missed the 2000$, or a chance for re-accumulation. however the overall trend remains bullish. the support lines are clearly marked on the chart and it is expected that ETH will reach a new all-time high in the future, with the potential to grow up to $8000
ichimoku analysis was also used, but it has been removed for chart clarity.
