Will $ETH remain bullish below $4,000?Ethereum hasn’t yet broken above its previous ATH.
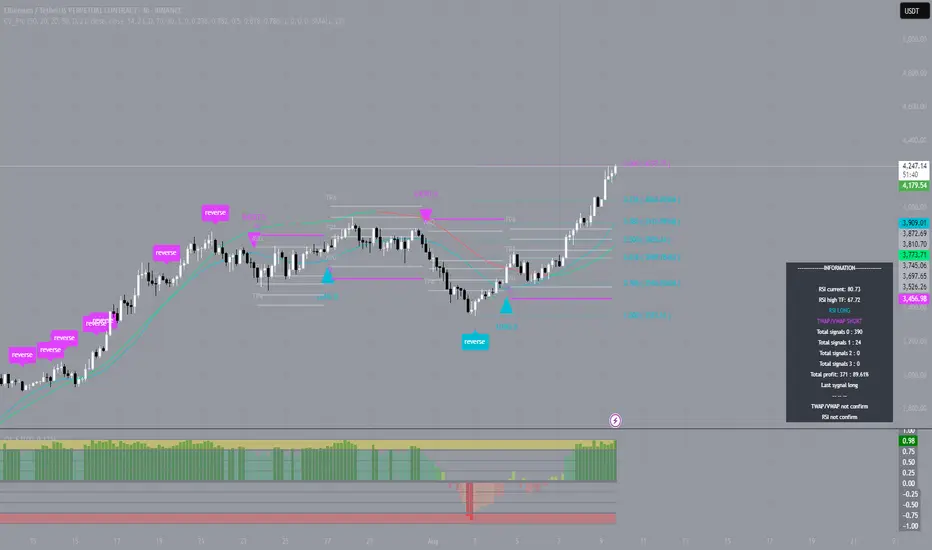
The colorful lines you see are mostly Fibonacci retracement & extension levels, tools traders use to identify potential support and resistance zones.
• Support: a level where price might stop falling and bounce (e.g., $4,141, blue line).
• Resistance: a level where price might struggle to go higher (e.g., $4,728 and $4,781, red lines).
The RSI (Relative Strength Index) shows market momentum:
• Above 70 = overbought (possible pullback).
• Below 30 = oversold (possible bounce).
Currently, RSI is at 25.82, indicating oversold conditions, which could lead to a bounce, though oversold doesn’t guarantee an immediate reversal.
ETHUSDT.P trade ideas

ETH ROAD TO 20K+ plan BAs far as we are getting closer to the final accumulation stage on ETH we can see a potential shape of huge channel in log scale but even bigger I posted previous time due to price action and ETH going better I thought.
Still after forming median of the channel I would like to see a big and fast correction from here towards 2900 support which must hold imo.
Top of that channel depends on timing so the later the better I guess.

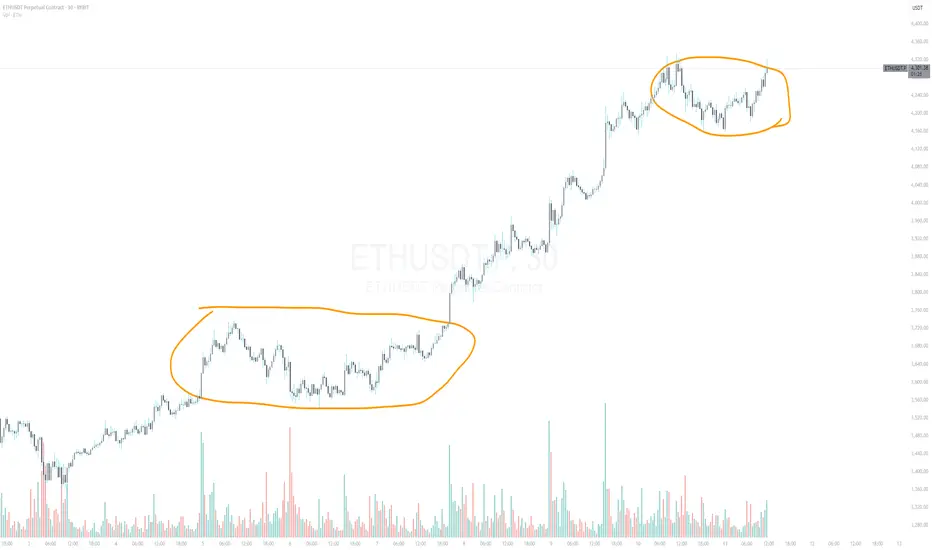
ETH well over extended but almost identical patternsETH well over extended but almost identical patterns before marking up hard.
question is whether the ETH narrative is strong enough to get through the profit takers..
We have a big BTC CME gap below which means we will likely get a close sometime soon back down to fill it in the NY session or soon after.
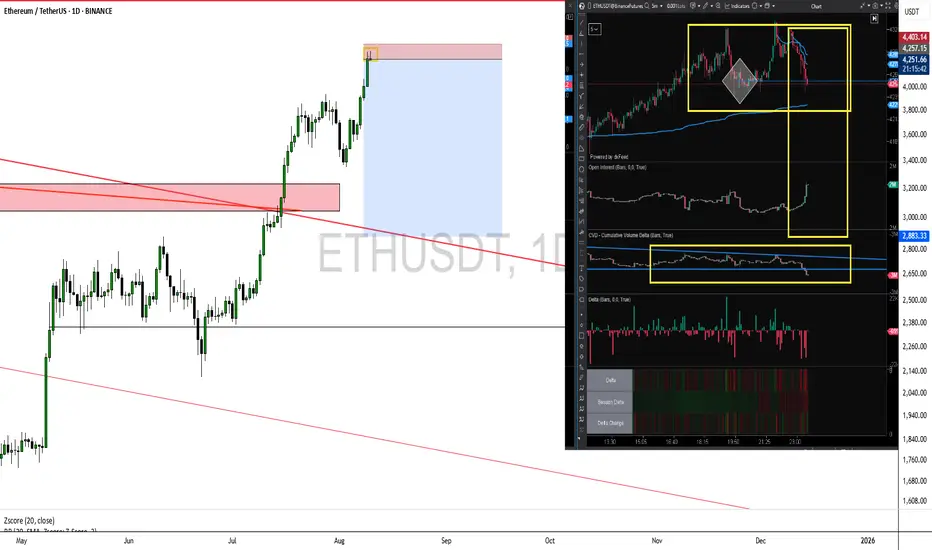
Let the show begin! ETHThe old saying never fails: tops are for selling!
Today, ETH gave us a textbook example of what happens when FOMO (Fear of Missing Out) takes over the market… lots of traders buying at the peak, thinking “this is it!”, but the basics still work: prices go up, exhaust, and then… dump.
In my last attempt, I traded hedged — I was long on ETH and sold the derivative to protect my portfolio. Now, I’ve closed all my longs and, with a clear flow signal + heavy FOMO kicking in, I’m going short.
📊 Flow, CVD, and Open Interest are showing that selling pressure is building up. Time to leave greed aside and trade with your head, not your heart.
Good luck everyone!
📉 Remember: discipline > emotion.
--
💥 Que comece o show! 💥
O velho ditado nunca falha: topo se vende!
Hoje, o ETH mostrou o que acontece quando o FOMO (medo de ficar de fora) toma conta do mercado… muita gente comprando no pico, acreditando que "agora vai", mas o básico continua funcionando: preços sobem, esgotam, e depois… despejam.
Na minha última tentativa, operei hedgeado — estava comprado no ETH e vendi o derivativo para proteger minha carteira. Agora, zerei todas as compras e, com o sinal claro de fluxo + o FOMO batendo forte, estou entrando vendido.
📊 Fluxo, CVD e Open Interest mostram que a pressão de venda está ganhando força. É hora de deixar a ganância de lado e operar com a cabeça, não com o coração.
Boa sorte a todos!
📉 Lembrem-se: disciplina > emoção.
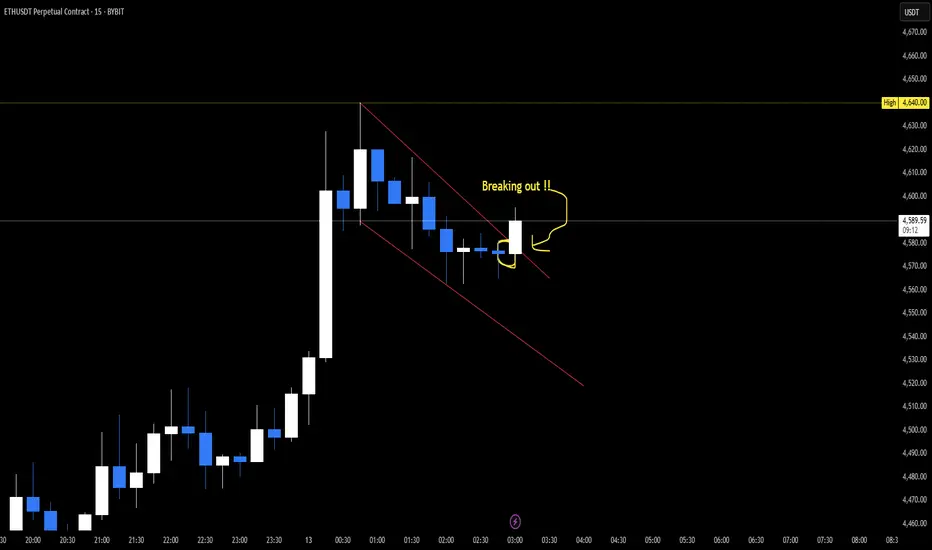
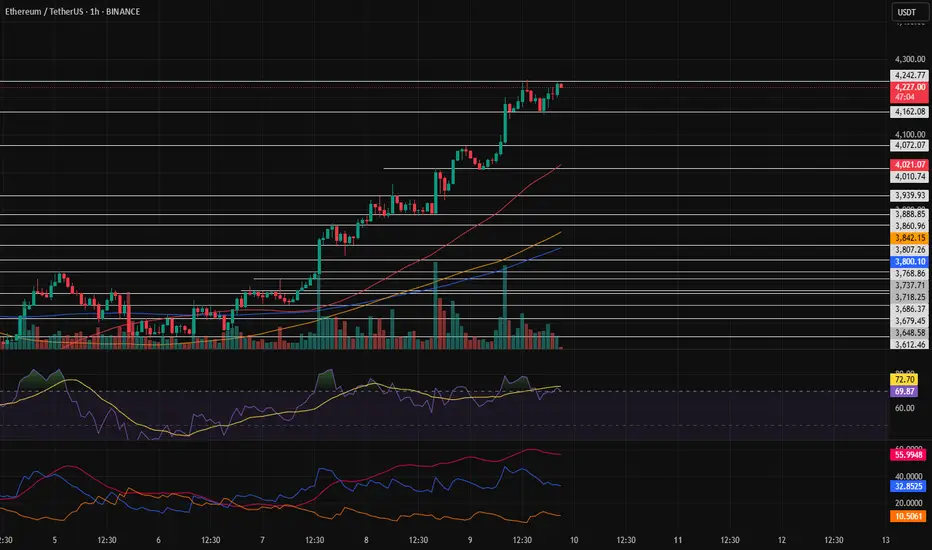
$ETH | Ready to fly (Inverted head and shoulders)BINANCE:ETHUSDT.P
On 1H TF, the price is forming inverted head and shoulders pattern, which is a strong bullish pattern.
The price has retested the trendline support and bounced back.
Expecting it to breakout above yellow line soon.
A breakout above the yellow line will be a bullish and pattern confirmation.
We can initiate a long entry from here.
Please do proper risk management and must use stop loss.
NFA, DYOR

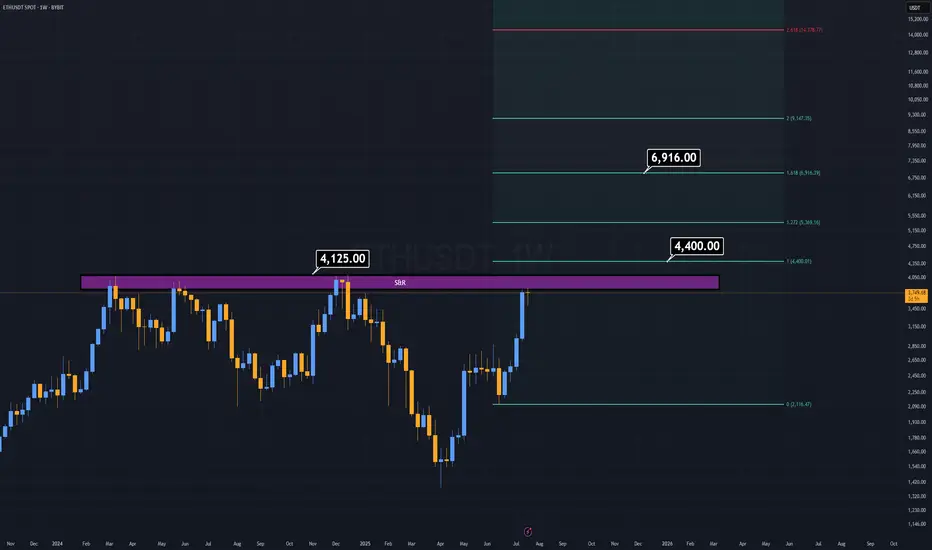
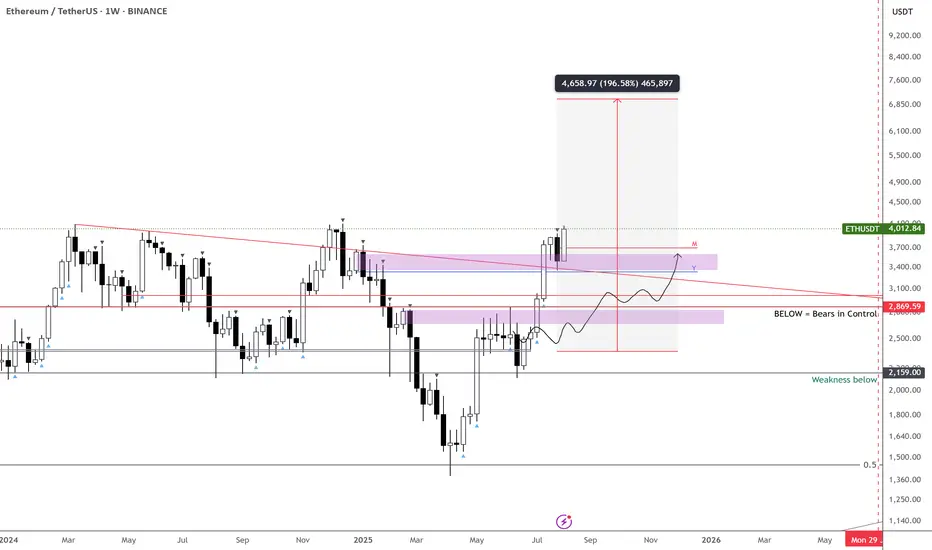
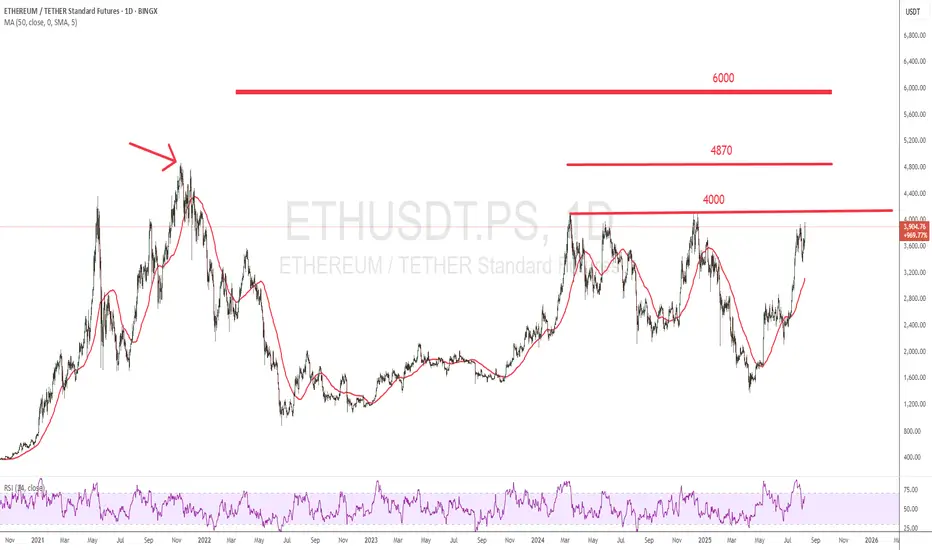
ETH Analysis (1W)Here I am, presenting the asset I personally dislike the most — ETH.
But the chart doesn’t care about feelings. ETH looks ultra bullish, but only if it breaks above the $4,125 level.
Why this level?
The $3,800–$4,100 range has historically acted as a major distribution zone — a place where market participants have consistently taken profit for years.
If this resistance is finally broken, we could see ETH rally toward $6,900 as a minimum target.
This level is based on the breakout projection of the long-standing macro structure.
Honestly, the target looks even better than the asset itself :)
Good Luck.
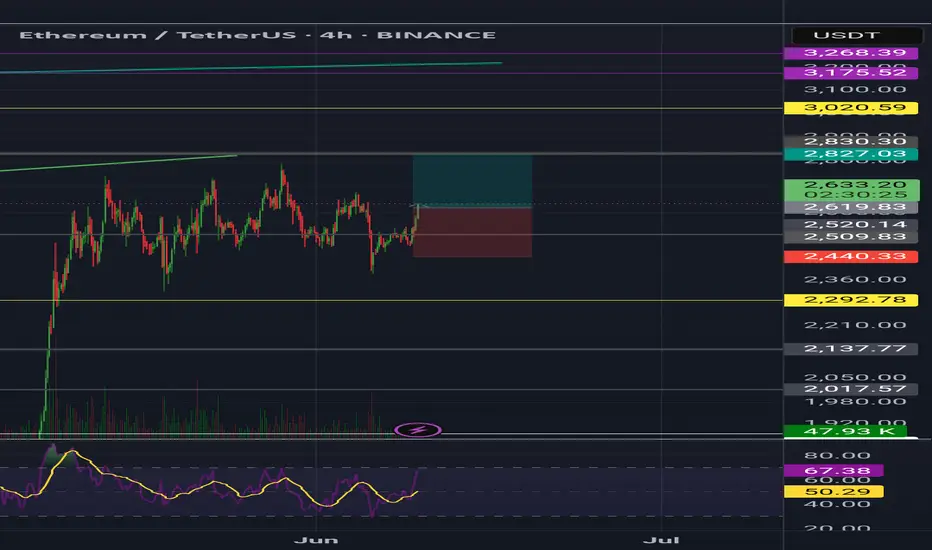
Rest in the uptrend?In my opinion, after this strong and prolonged rally, the price needs a rest before moving higher. My view and analysis are that the price could rest around the 4,072.07 area, where it can then decide whether to move higher and set a new all-time high or take a deeper rest.
Ethereum is heading towards $5,000 and above.Ethereum broke the $4,000 level after months. Congratulations to all its patient holders. My analysis is that the price is heading towards $5,000. Because Bitcoin dominance is also on a downward trend below 60%.
This analysis is not a financial recommendation. Crypto is a very risky market and you may lose some or all of your money in it. Especially futures trading.
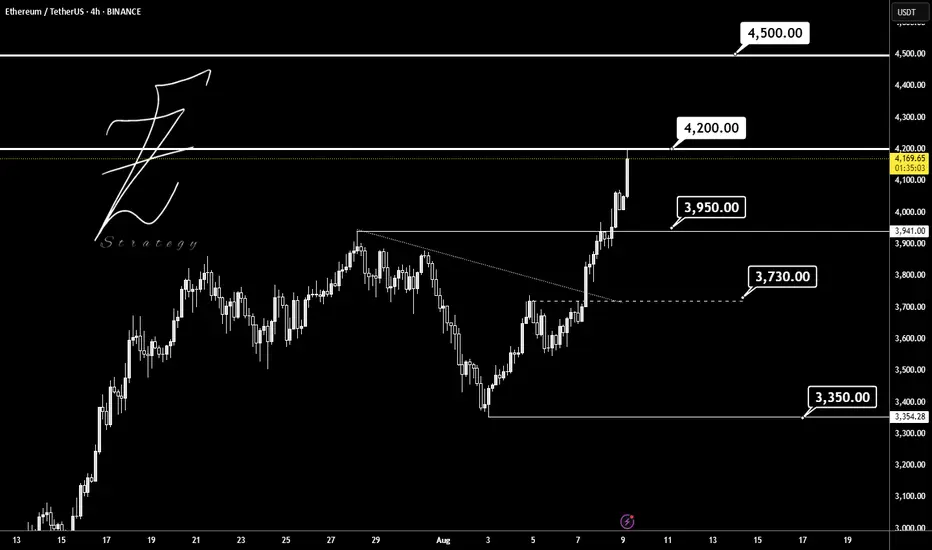
ETHUSDTBINANCE:ETHUSDT is overall trend in the 4-hour timeframe is bullish, with strong buying momentum. The price is currently at the 4200 USD resistance, and if this level breaks, the next target will be around 4500 USD.
Supports:3950 USD, 3730 USD, 3350 USD
Resistances: 4200 USD, 4500 USD
⚠️Always apply proper risk management.
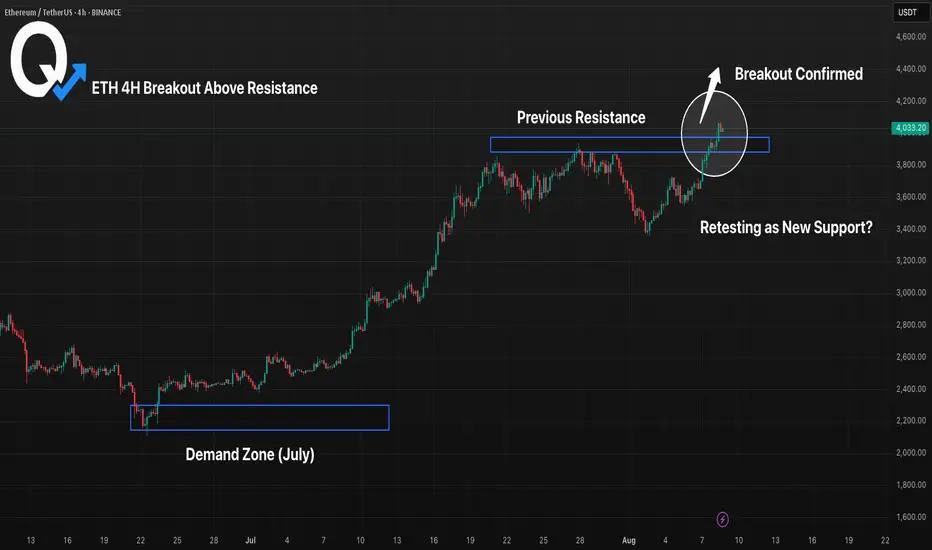
ETH 4H Breakout Above Resistance, Will Retest Hold as Support?ETH has broken out above its previous resistance around the 3,880–3,940 range, with buyers pushing price into the low 4,100s. The key focus now is whether this level can flip into support on a retest. Holding here would confirm bullish continuation toward higher targets, while a failure could send ETH back inside the prior range. Momentum remains in bulls’ favor unless this breakout is quickly invalidated.
$ETH - Rising WedgeCRYPTOCAP:ETH | 4h
Price remains within the ascending wedge on the 4h chart, showing a triple tap on the trendline.
On lower timeframes, watching 3880 as local support for a possible bounce.
Upside levels to monitor are 4120–4215 for potential rejection, though an ideal pullback would see the lower trendline tested at 3770–3680.

$ETH - New monthly Signal! Been focusing heavily on CRYPTOCAP:ETH lately — price action remains clean, easy to read, and primed for a push into new highs.
By now, most of you should already have a solid position in $Ethereum. We’ve been calling some great entry spots, and if you’re still indecisive… this might be your last real chance.
The $3,400 zone held strong, and in my opinion, that’s the low for the next couple of months. We’ve also just triggered a fresh monthly signal inside this massive multi-month consolidation. If you’re expecting lower prices, you might be waiting a long, long time.
I’ve been eyeing the possibility of $10K since last month’s breakout opened the gate. Keeping our analysis grounded, $7K is the realistic target we should see this year — maybe even within the next two months.
Until the signal expires or the target is hit… keep holding.
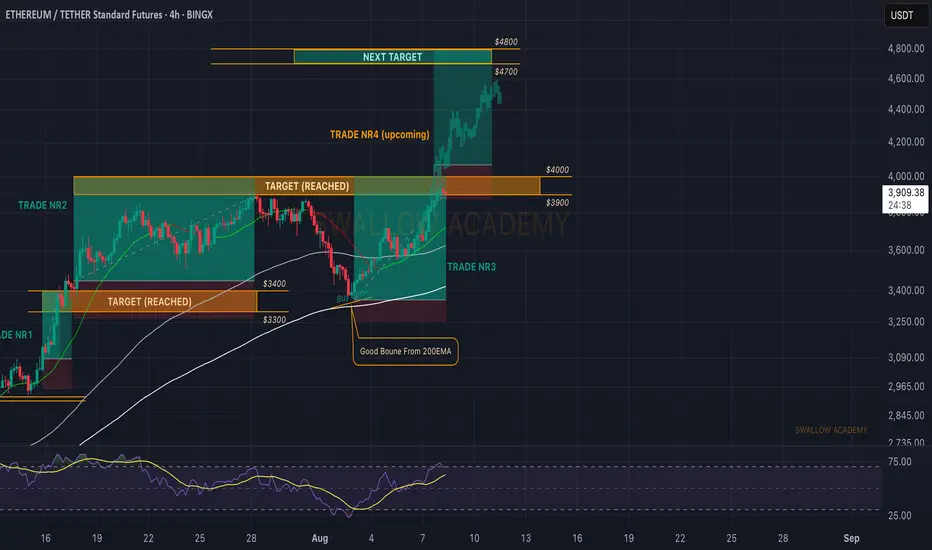
Ethereum (ETH): Caught 45% of Movement in Total | $4800 Is Next3 trades we had on ETH, in combined 45% of market price movement. Now that we are at the end of the current week, we are going to look for a proper breakout from $4000, where then we will be opening yet another long with the target being at $4800.
Swallow Academy
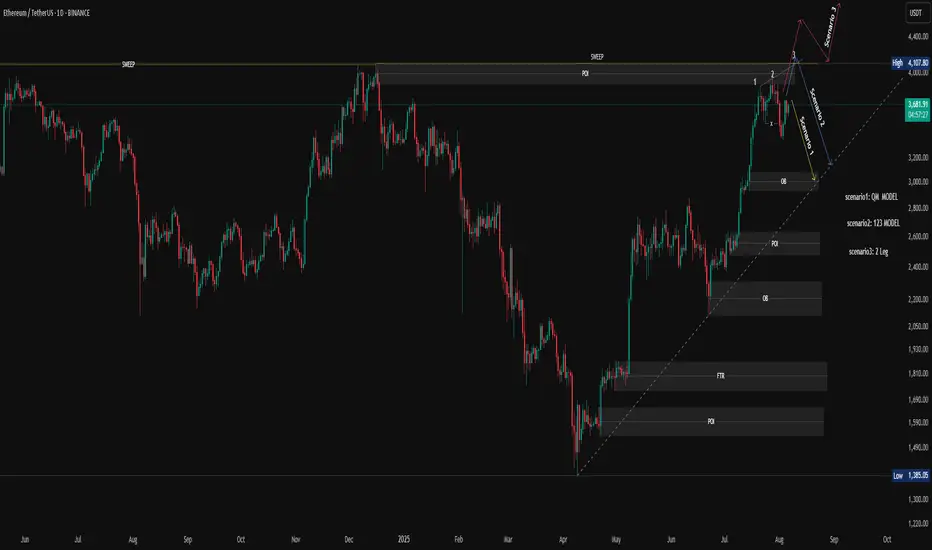
Market update for EthereumThe price managed to hold above the weekly pivot point, triggering growth according to the bullish (green) scenario. At this point, the price has reached the first two targets and set a new local high. However, it is now in a resistance zone, and only 4% remains before breaking a key level.
If the 4,116 level is broken, the path toward 4,600 will open, potentially leading to a new ATH. But if the price breaks below 3,736 , the bearish (orange) scenario is likely to play out, and the price may start to decline.

Should we expect Ethereum price growth?Ethereum is moving back towards $4,000 after the pull-back I said earlier. Will this level finally be broken and the queen of crypto will move towards $5,000? I think it depends on many parameters. There is news that money is flowing into altcoins. If the $4000 level is broken with strong volume, we should expect good news for this popular digital currency.
Ethereum - DAILYHi
Ethereum Daily on Sell position...
Be careful and take advantage of the opportunity.
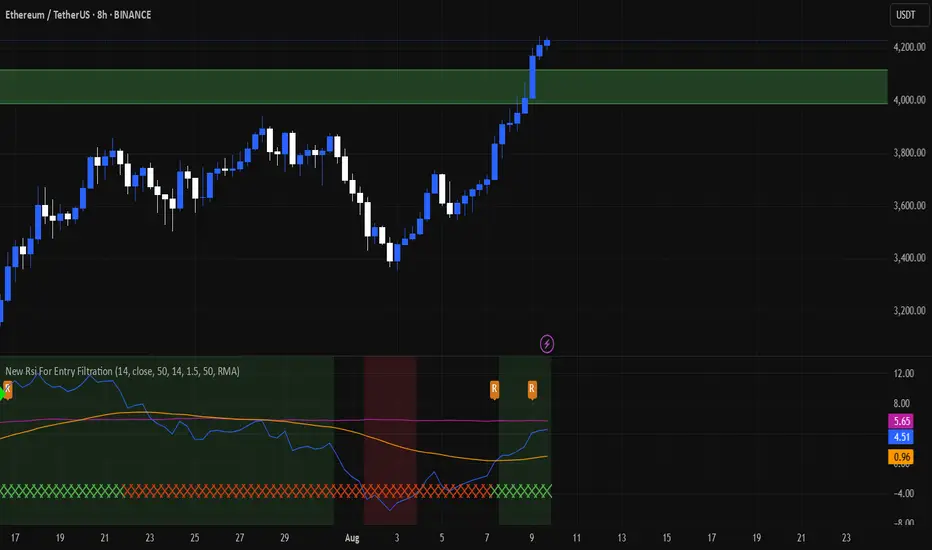
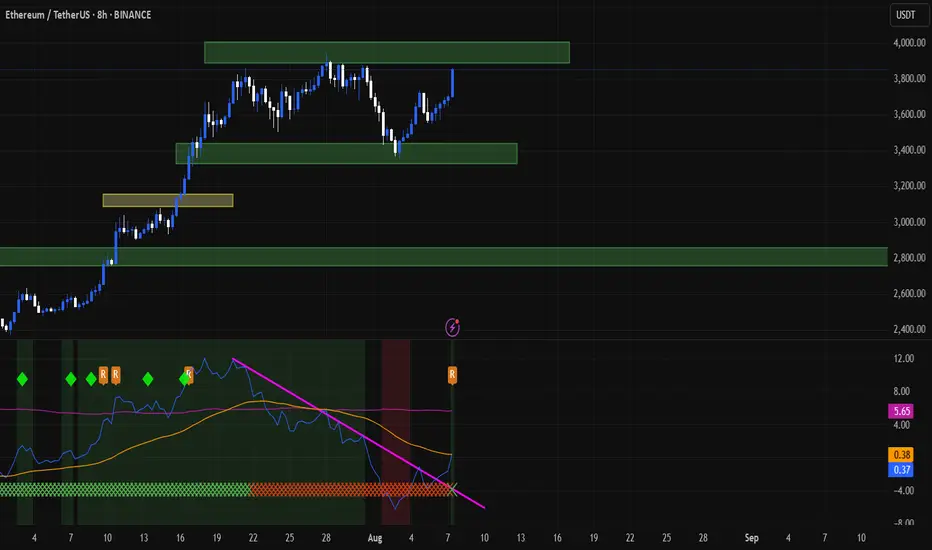
Ethereum (ETH): Seeing Struggle But Nothing Serious | Bullish AFETH still looks bullish to us, with the price staying above the local 200EMA, where last time we had a decent bounce from it.
Now, as many remember and know, we are bullish on ETH only due to 1 big reason: the liquidity of BTC has to go somewhere, and as investors have already had their fun (most of it, at least) with BTC, now they need to relocate their money and ETH is the next step.
$4000 is still our target (once again, as we already reached it once basically), and the current zone seems like a good bounce area with the 100 EMA and the middle line of the BB sitting there, in addition to lots of liquidity being distributed here (based on the order book we use)!
Swallow Academy

Ethereum Holds Above $4,000: The Start of a New Altcoin Rally?Ethereum (ETH), the largest altcoin by market capitalization, has become the main driver of the current cryptocurrency market surge. Amid Bitcoin dominance falling below its two-year trendline and capital flowing into altcoins, ETH has posted an impressive 20% weekly gain.
After a strong rebound from the $3,354 support level, ETH broke through the key psychological barrier of $4,000, reaching a local high at $4,206. This move has become a clear signal not only for investors but also for traders, who see it as confirmation of a new bullish momentum.
📈 Technical Overview:
ETH broke above its 50-day SMA and consolidated there, strengthening buyers’ positions.
Trading volumes on both spot and derivatives markets increased by 18% compared to the previous week.
RSI and MACD indicators show a growing trend with no signs of overbought conditions.
Bitcoin dominance dropping from 66% to 60% in just two months suggests a capital rotation toward altcoins, with Ethereum—being the sector’s flagship—benefiting the most from this shift.
🚀 What’s Next?
If Ethereum holds the $4,000–$4,050 range as support, the next technical target lies in the $4,450–$4,600 zone. The strengthening trend in the ETH/BTC pair also points to further potential growth, even if Bitcoin moves sideways.
The market is already calling this the beginning of the 2025 Altcoin Season, and Ethereum appears set to be its leading locomotive.
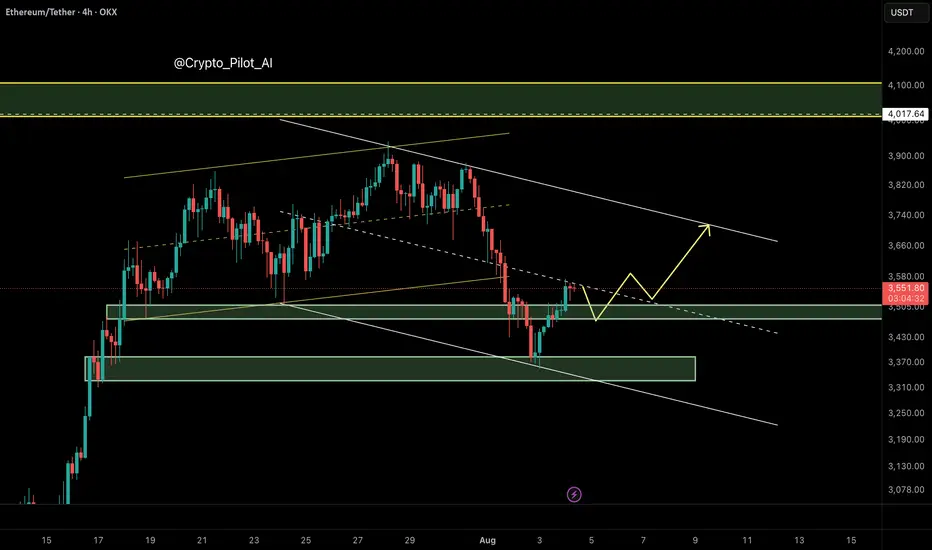
Ethereum (ETH/USDT) – Bearish Channel Structure Developing
⸻
🔍 Technical Overview
Ethereum has broken down from its ascending channel, invalidating the earlier bullish projection toward $4,000. After failing to hold the channel midline around $3,577, price dropped sharply to $3,360, forming a new bearish descending channel.
Currently, ETH is trading near the midline of this bearish channel, which typically acts as a decision point — not a buying zone — in smart money models.
⸻
🧠 NEoWave Interpretation
We may be inside a Complex Corrective Wave, possibly a Running or Contracting Flat evolving after the March top. The current structure resembles a B-wave trap, where price fakes out the upside before shifting momentum sharply downward. The break below the ascending channel midline confirms this bearish shift.
⸻
📊 Smart Money Summary
• 🟥 BOS confirmed on 1H and 4H (lower highs and lower lows)
• 🔻 Midline failure acted as a smart money trap, followed by a liquidity sweep below $3,490
• 📦 Bullish Order Block around $3,490–$3,520 has been tapped, prompting a minor reaction
• 🟡 Current resistance sits near the channel top ~ $3,715
⸻
🎯 Trade Scenarios
📌 Bearish Continuation:
If price fails to reclaim above $3,715, a retest and rejection from the channel top could trigger continuation toward $3,300–$3,250.
📌 Bullish Reversal (less likely for now):
Only a clean break and hold above $3,720 would suggest that bulls are regaining control, opening path toward $3,900–$4,000 — though this scenario is weakened after structural damage.
⸻
⚠️ Trader Tip:
Avoid buying into midline reactions in weak channels. Better long setups form after stop-hunts, ideally near bullish OBs + internal BOS confirmations.
⸻
✅ Conclusion
Ethereum remains under bearish pressure after losing its ascending structure. Unless price reclaims the $3,715 resistance zone with momentum, downside continuation remains likely.
⸻
📌 Save this analysis
💬 Share your thoughts or alt wave counts in the comments.
ETH updateIF you remember this:
Current chart show prospective, not targets (sure they are), but step-by-step)
Good luck
ETH 4k to 3.2kThere is a major fib here which I don't think will break.
Price has been going up consistantly to remove shorts from the market.
