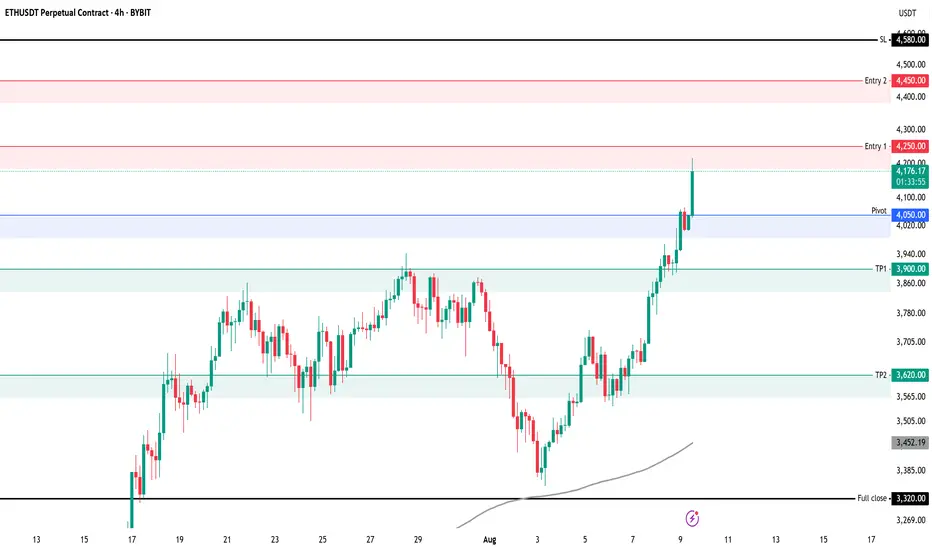
ETHUSDT ShortThese are the key areas we are looking for on ETH 4H
Risk per entry 0.25%
Entry 1: 4250
Entry 2: 4450
TP 1: 3900 or Pivot 4050
TP 2: 3620
Full TP: 3320
SL: 4580
Always manage your own risk. None of the above is financial advice.
ETHUSDT.P trade ideas
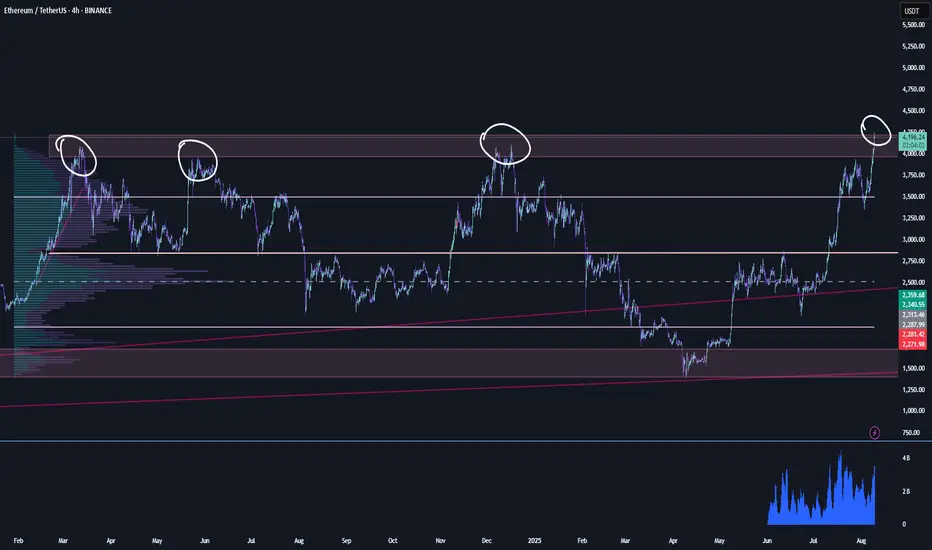
Ethereum currently on an important crossroadAs you can see, the current levels for BINANCE:ETHUSDT haven't been broken since march 24, 3 attempts so far, this time it's the 4th. IF it breaks, it'll bring in an eth related altseason (which means alts that correspond with ethereum).
Let's see and hope. BINANCE:OPUSDT trade still open
Ethereum Long Trigger Just Got Valid — Don’t Miss This SetupHey, it’s Skeptic from Skeptic Lab.
In this breakdown, we’re looking at a fresh long opportunity on Ethereum after a clean 45% move from our last trigger.
I’ll walk you through the daily and 4H timeframes, explain why the correction looks weak, and where the next breakout trigger is setting up.
Plus, I’ll show you how ETHBTC can help confirm the move and improve your risk/reward.
If this gave you clarity or value, give it a boost — and I’ll catch you in the next one.
Disclaimer: This is not financial advice. Always do your own research before making any trading decisions.

ATH FOR Ethereum!!!Hello friends🙌
As you know, Ethereum has been on an upward trend these days and we can say that buyers have entered, but not completely...👀
🔊Now, considering the resistance that Ethereum is facing, namely the number 3900 to 4100, we need to see what reaction the price will see this time when the price reaches this resistance for the 4th time?
✔We will most likely make a small correction and this time this major resistance will be broken again and we will witness a higher ceiling.
✔Otherwise, I have an important and key support that we have identified for you and if the price drops, this support is a good area to buy again.
And finally, observe risk and capital management⚠
🔥Follow us for more signals🔥
*Trade safely with us*

ETH ready for ATH?Might be but for now lets wait for Structure shift on H1 or H4 short it and than from the zone wait for bullish shift and kabooom...
The zone is not refined the pullback can be deep so always look for bullish market structure shift.
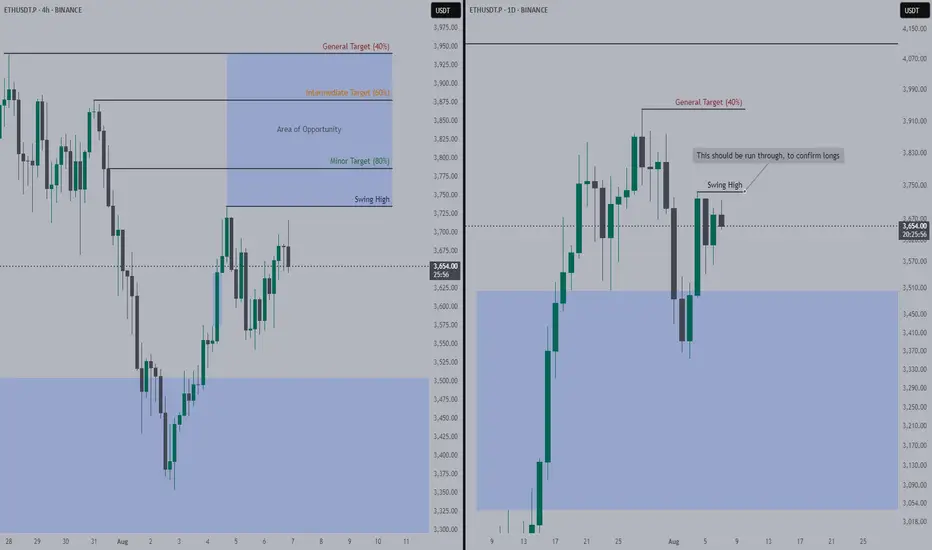
Ethereum Needs to RUN Swing High (Latest)To confirm longs and look for entries, we need price to run through Swing High.
If price closes above Swing High in 4H price action, I will be looking for longs within Area of Opportunity (AoO).
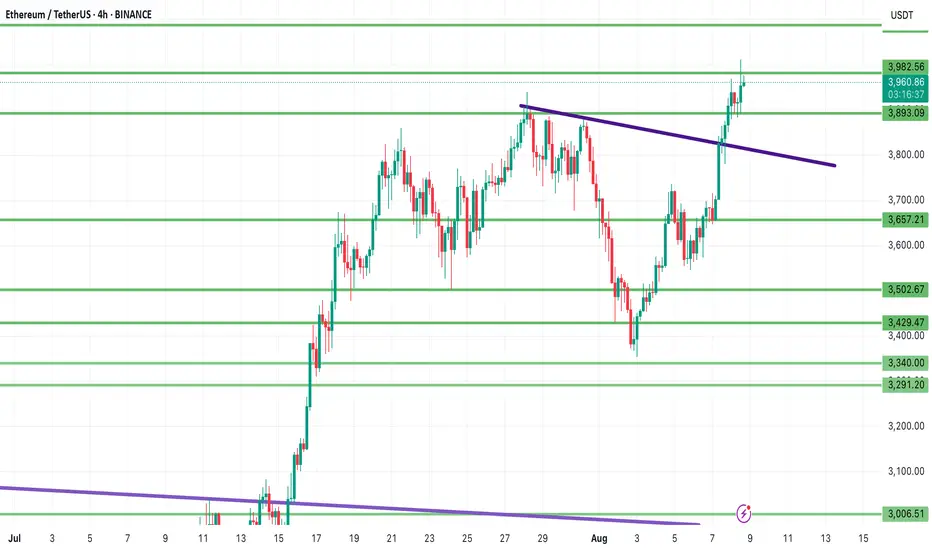
Ethereum Technical Analysis | August 8, 2025📊 Ethereum Technical Analysis | August 8, 2025
Ethereum has shown a strong bullish reaction after bouncing from the key $3,893 support zone, confirming the move with a solid bullish candle. If this support holds and further bullish signals appear, the next upside targets will be:
$4,088
$4,140
And potentially $4,291.
🔻 However, if the $3,893 support fails and price closes below it, the next important support to watch is around $3,757, which could act as a barrier against deeper declines.
📌 Summary:
Holding above $3,893 keeps the bullish scenario alive for Ethereum, while losing this level may increase selling pressure. Mark these key levels on your chart to make more precise trading decisions.
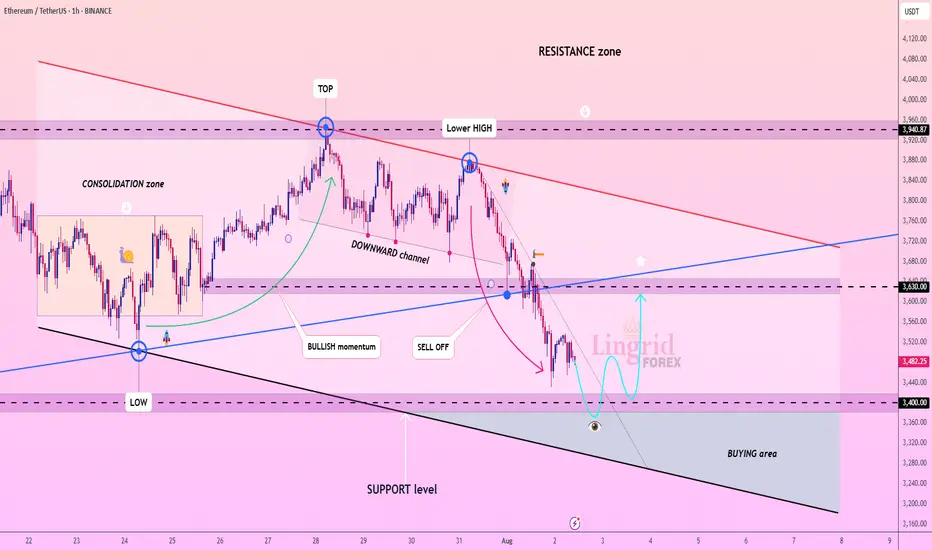
Lingrid | ETHUSDT Short-Term Move: Buying Opportunity at SupportThe price perfectly fulfilled my last idea . BINANCE:ETHUSDT is attempting a bounce after dipping into the lower boundary of its channel near the $3,400 support level. Price action has followed a descending structure with lower highs inside a broad downward channel. As long as the $3,400 zone holds, a rebound toward the mid-range resistance at $3,630 remains viable. Current positioning inside the "BUYING area" suggests momentum may flip bullish if a reversal structure forms.
📉 Key Levels
Buy trigger: Break above $3,630
Buy zone: $3,250 – $3,400
Target: $3,630 – $3,720
Invalidation: Break below $3,250
💡 Risks
Momentum still favors sellers from the recent sell-off
Failure to reclaim mid-range resistance could cap upside
Broader trend remains within a bearish channel structure
If this idea resonates with you or you have your own opinion, traders, hit the comments. I’m excited to read your thoughts!
ETH: LIVE TRADEHello friends🙌
✅Given the good rise we had, we had a small correction that was a buying opportunity and there is another support area where we can buy the second step in case of further correction.
We have also specified targets for you, be careful and do not act emotionally and observe capital and risk management.
🔥Follow us for more signals🔥
*Trade safely with us*

ETH Highly chance to go bearish Basic structure levels are indicating the sell there's a huge supply to sell

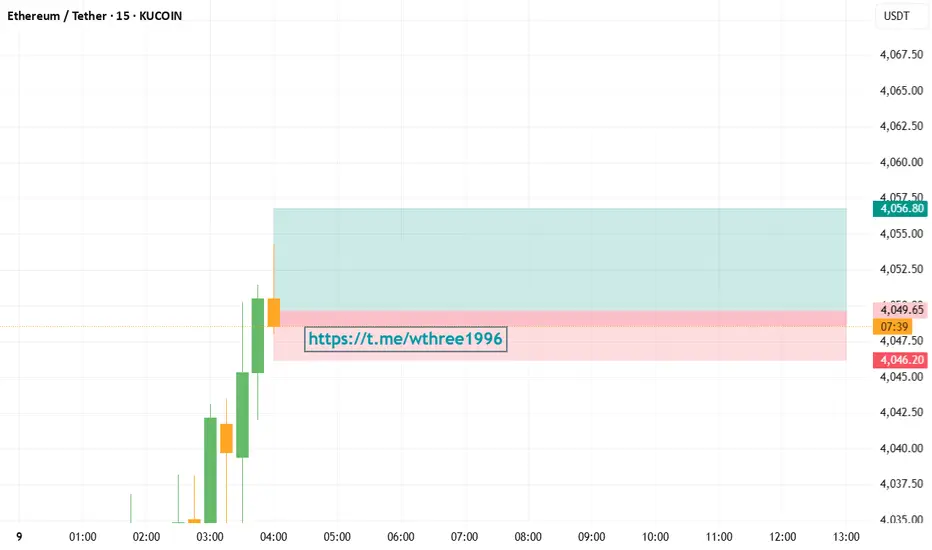
ETHUSDT LONG- Signal: LONG
- Entry: ETHUSDT 4,048.0 ~ 4,049.5
- Take Profit: 4,056.8 / Stop Loss: 4,046.2
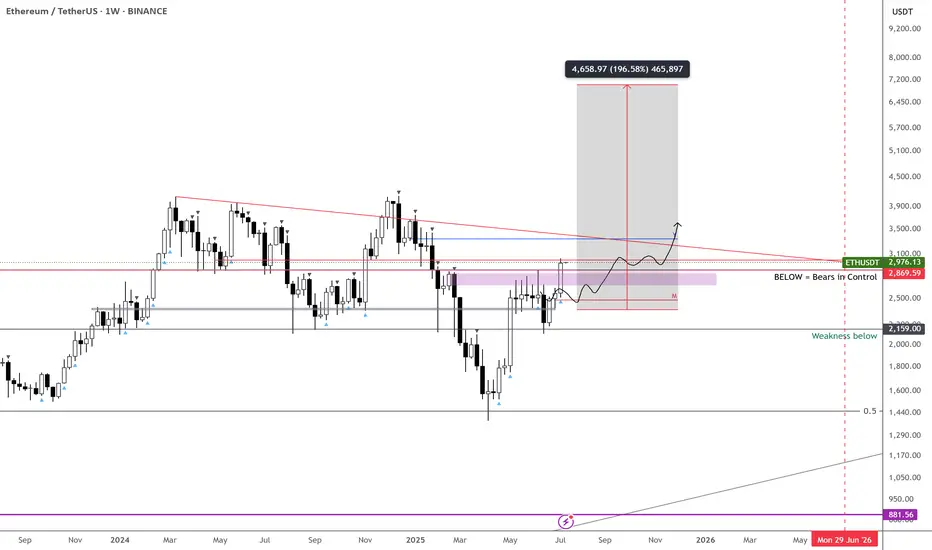
ETH – $7k Target in Sight
7k incoming on CRYPTOCAP:ETH —timing is up in the air, but the chart looks stellar.
A decisive break above $3,500 should kick off aggressive expansion.
Meanwhile, ETHBTC has been rallying hard off its lows; I’m eyeing a 50% gain against BTC over the next 2–3 months.
Holding through this strength makes sense—it’s been a long time since we’ve seen these setups.
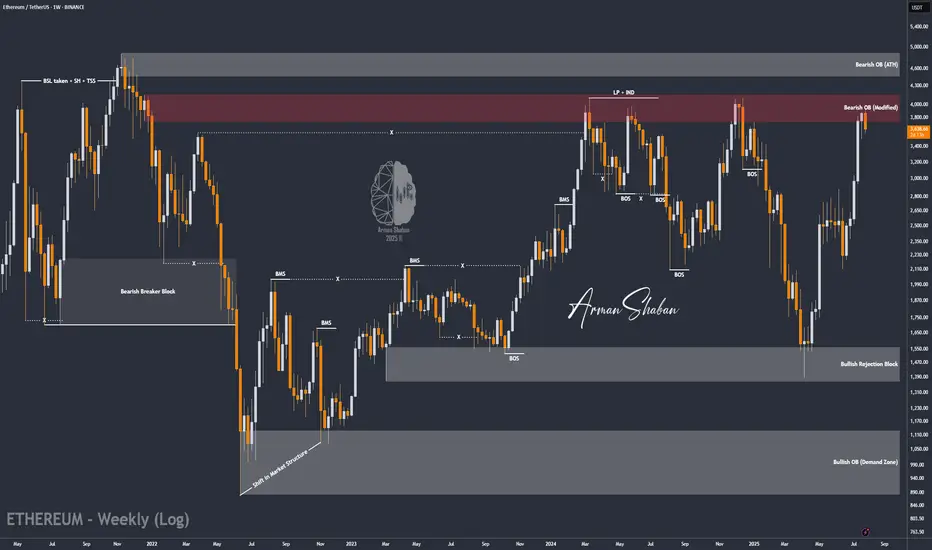
ETH/USDT | ETH Under Pressure – Watch $3500 Support!By analyzing the Ethereum chart on the weekly timeframe, we can see that after reaching the $3940 zone, ETH faced selling pressure and is now trading around $3540. If the price fails to hold the key $3500 support, a deeper decline is likely, with potential targets at $3040 first and possibly $2680 as the second bearish target.
Please support me with your likes and comments to motivate me to share more analysis with you and share your opinion about the possible trend of this chart with me !
Best Regards , Arman Shaban
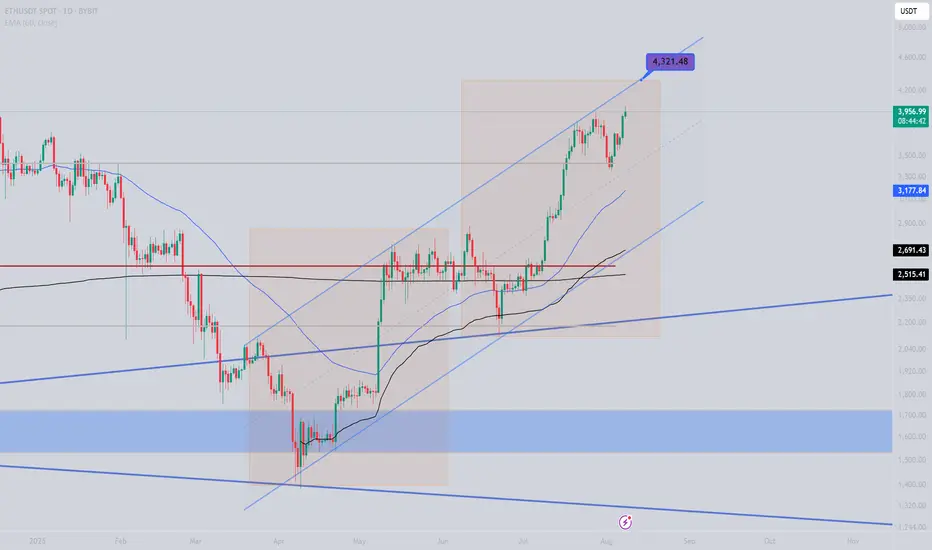
ETHUSDTConsidering Ethereum’s movement steps, 4320 is the end of Ethereum’s second leg. As big whales are adding to their holdings and there is a lot of optimism, we would expect to see higher numbers for Ethereum in the long term.
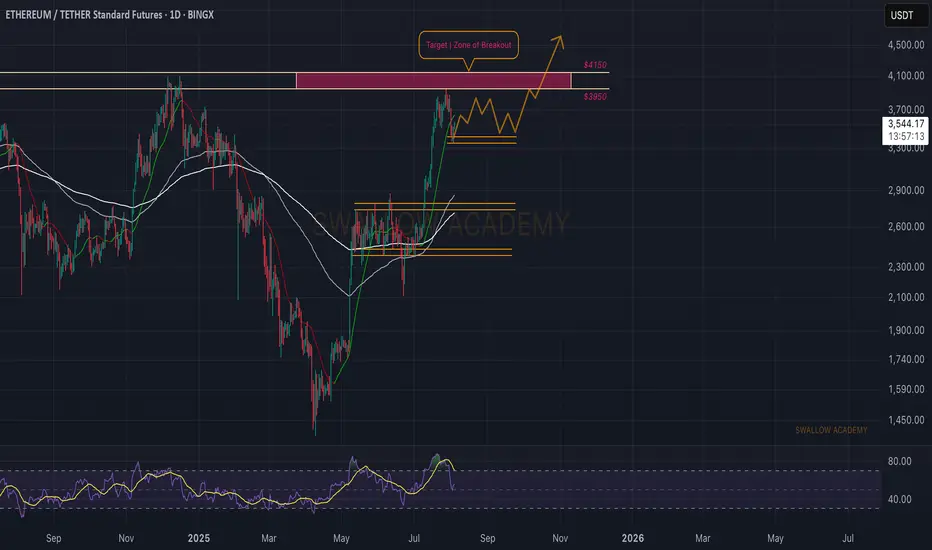
Ethereum (ETH): Zone of Rejection Turning Into Zone of BreakoutSince last time, we were looking for a zone of rejection, which happened as well, where price had a smaller pullback, and now upon the start of a new week, we might be seeing the start of recovery as well.
Which means, as long as we are above the $3,350 zone (which is the local low area), we are bullish; if we break that zone, this would be the ideal area for a short!
Swallow Academy
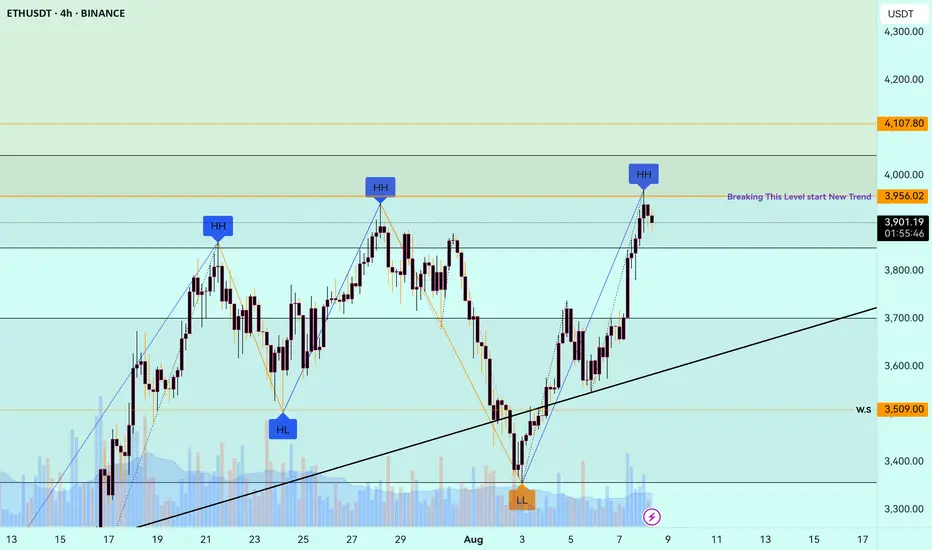
ETH Important Update 08.08.2025🚀 #ETH Update 🚀
This is the third attempt on the major timeframe for ETH to break through this yellow resistance zone. 📊
I strongly believe that this time ETH has a high chance to break it.
📌 Possible Scenario:
* ETH pushes up to this zone
* Small retracement 🔄
* Then a strong breakout 💥
We’ll monitor closely to catch the move.
⚡ Important Point:
If ETH starts retracing while:
1️⃣ Bitcoin stays in range
2️⃣ Bitcoin dominance drops 📉
➡️ Then we could see a solid rally in TOTAL3 (altcoins excluding ETH) — meaning a lot of altcoins will have good upside potential.
💡 Be prepared with liquidity — opportunities don’t wait! Insha’Allah, we’ll ride this wave together. 🌊
🔥 Stay focused. Stay ready. This could be the moment the market wakes up!
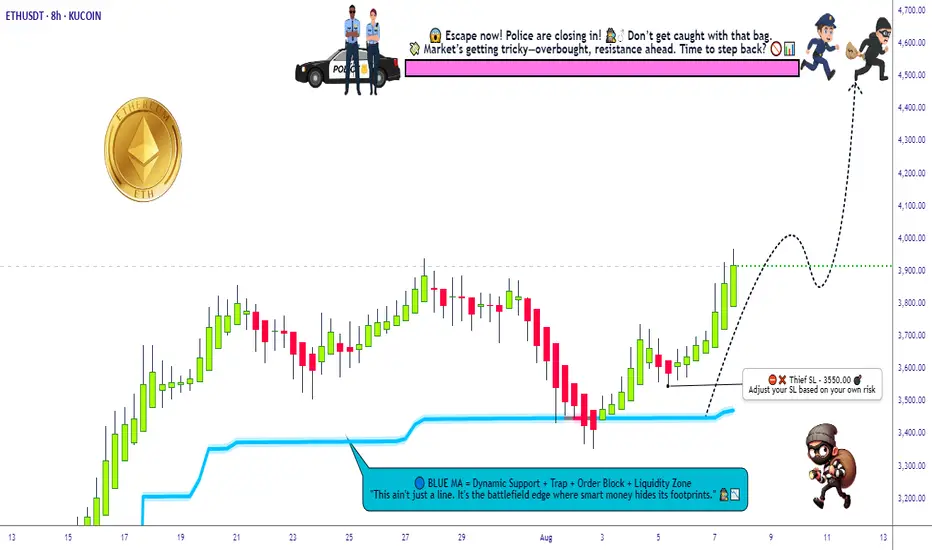
ETH/USDT Grid Plan » Bullish Loadout » Stealing the Top🚨ETH/USDT Crypto Heist Plan 🔓💰
Asset: ETH/USDT "Ethereum vs Tether"
Plan: 🟢 Bullish – Multi-Layered Entry Grid
Strategy: Thief-style limit orders (GRID / DCA stacking)
Entry: Any Dip is a Heist Opportunity 💸
Stop Loss: 🔻 3550.00
Target: 🎯 4500.00
👋 Hey Thieves & Money Makers!
Get your gear ready – it's time to loot the Ethereum Vault 💎🚀
🔥Thief Trader's ETH/USDT Master Robbery Blueprint🔥
This ain’t your average plan — we break in with layered entries, lock in on breakout volatility, and ride the bullish train to the moon 🌕.
💼 Entry Strategy:
No need to overthink. Any dip = loot zone!
Stack multiple limit orders like a pro (15M–1H level).
We're playing the grid game. The more dips, the bigger the stash! 🧱🪙
🚨 Stop Loss:
Set SL at 🔻3550 or under recent swing lows.
Adjust by risk appetite and how many entries you stack.
Thieves don’t chase – they calculate risk.
🎯 Target Zone:
We're eyeing the 4500 mark. But remember – exit before the vault shuts if momentum slows. 🏃♂️💨💰
🔁 Scalpers Alert:
Only long. Only bullish. Only profit. 🧲💥
Stack it, trail it, and let it run with a sniper's precision. 🎯🧠
📊 Market Context:
ETH bulls gaining control post-accumulation.
Strong on-chain metrics, solid macro tailwinds.
Bears trapped in the shadows – we move in daylight. 🐂🆚🐻
📰 Warning – News Bombs Ahead!
💣 Avoid fresh positions during high-impact events.
🎯 Use Trailing SLs to protect your loot.
Smart robbers never get caught unguarded.
💥BOOST This Idea if you're part of the robbery crew 🔐💰
Every boost powers our next move.
Let's rob the crypto market together – one breakout at a time! 🏴☠️📈🤑
Thief Trader™ – Locking Targets. Looting Charts.
💎🕵️♂️📊 #CryptoHeist #ThiefStyle #ETHBreakout #GridGang #BullMode
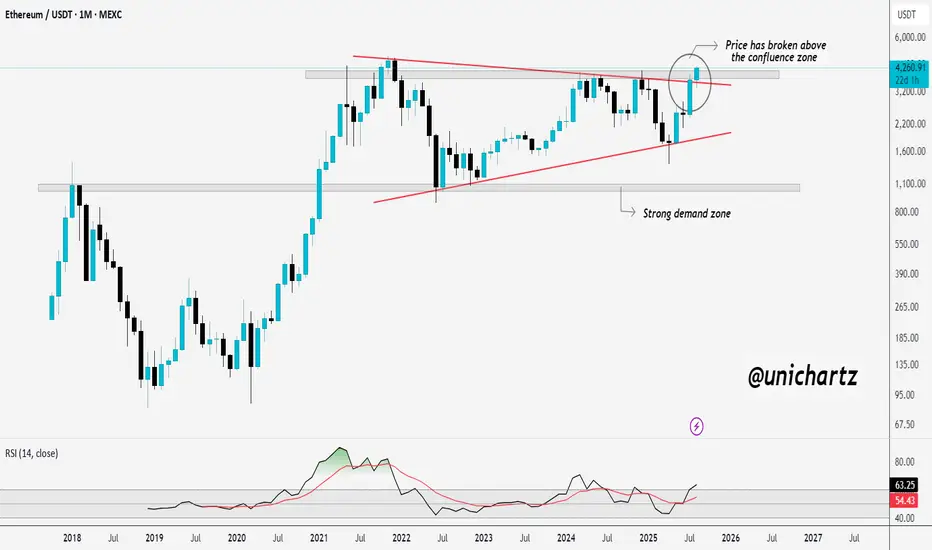
$ETH Breaks Confluence Barrier — Next Stop ATH? CRYPTOCAP:ETH has broken above a major confluence zone, where long-term resistance and trendline pressure have been holding price back. This breakout signals renewed bullish momentum and opens the door for a potential push toward the previous all-time highs.
The strong demand zone below continues to act as a solid foundation, and RSI momentum suggests buyers are still in control. As long as ETH holds above this breakout level, the bullish outlook remains intact.
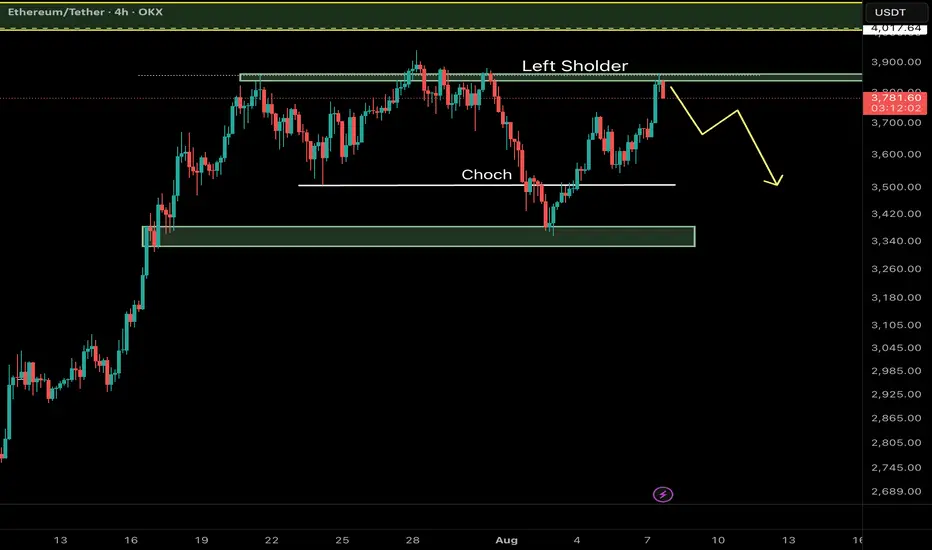
Ethereum (ETH/USDT) – Key Reversal Zone RetestAfter a major CHoCH (Change of Character) on the 4H timeframe, Ethereum has shown a strong bullish move from a high-probability demand zone and is now retesting a critical resistance area aligned with the Left Shoulder of a classic RTM pattern.
⸻
🔍 Key Technical Elements:
• CHoCH confirms the shift from a distribution phase to accumulation.
• Strong reaction from a demand zone near $3,340–$3,380.
• Price is now testing the Left Shoulder, which often acts as a reaction zone before continuation.
⸻
📌 Potential Scenarios:
🔼 Bullish Case (Primary):
If ETH breaks and closes above $3,870, a move toward the next liquidity pool around $4,010–$4,050 is likely.
🔽 Bearish Case (Alternative):
Failure to hold above the current resistance may lead to a pullback toward the $3,340–$3,380 demand zone for another accumulation attempt.
⸻
💡 Educational Note:
In RTM methodology, retests of the Left Shoulder after CHoCH are considered one of the most efficient entry zones — especially when confluence with liquidity voids or imbalance exists.
Follow for more Smart Money & RTM insights.
ETHUSDT LONG- Signal: LONG
- Entry: ETHUSDT 4,220.8 ~ 4,222.5
- Take Profit: 4,232.6 / Stop Loss: 4,218.4

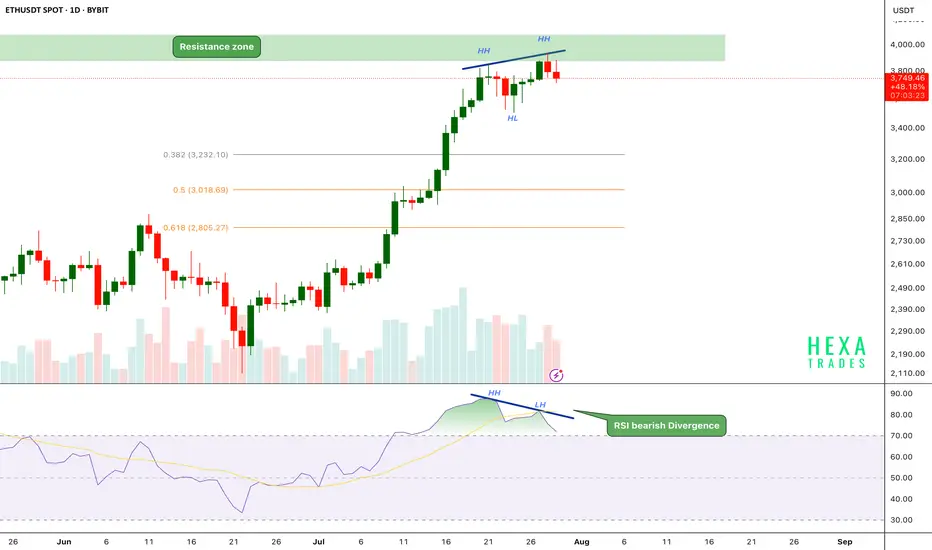
ETH Bearish Divergence!CRYPTOCAP:ETH has been in a strong uptrend, printing consistent higher highs (HH) and higher lows (HL). However, on the daily chart, the price has now reached a critical resistance zone near the $3,800–$4,000 range.
Key Points:
🔸 Bearish RSI Divergence
While price action has formed a new higher high, the RSI has printed a lower high, signaling bearish divergence.
This indicates that upward momentum is weakening even as price attempts to push higher — a common early warning of a possible short-term reversal.
🔸 Fibonacci Retracement Levels
The fib 0.382 at $3240 and 0.5 and 0.618 retracement levels are sitting around $3,000 and $2,800, respectively, potential targets if a correction follows.
🔸 Volume Profile
Volume is gradually declining as price approaches resistance, suggesting buyer exhaustion.
If the price breaks above the $4,000 psychological resistance, we could see a strong bullish move.
ETH is facing strong resistance after a powerful rally, with RSI bearish divergence and weakening momentum hinting at a possible short-term pullback. We should be cautious entering fresh longs here without confirmation.
Support: $3,200, $3,000, and $2,800
Cheers
Hexa
BINANCE:ETHUSDT BITSTAMP:ETHUSD
ETH ~ Ive given him some laxatives!okay, me giving him laxative means you know what gonna happen and till where it gonna fall loololl
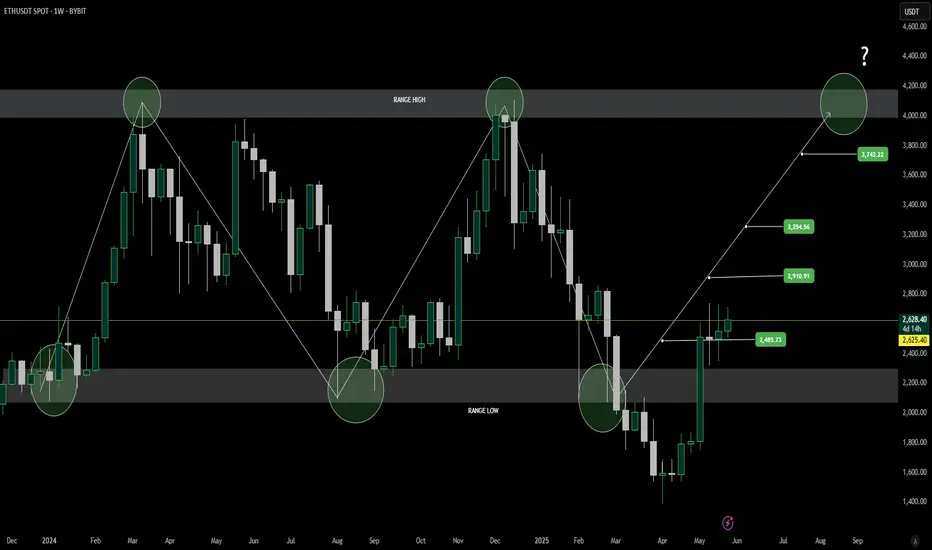
Ethereum (ETH) Weekly Outlook: Momentum Builds After Range BreakEthereum’s weekly chart continues to follow a well-defined trading range, oscillating between its historical range lows and highs. Recently, ETH closed decisively above the $2,200 level, marking a key structural break and reinforcing bullish sentiment. This move has already led to the first upside target at $2,484 being successfully hit.
Historically, Ethereum has shown a cyclical range-bound pattern — bouncing from the range low and encountering resistance at the top. With the lower boundary now acting as support and the first resistance target cleared, ETH may be entering a momentum phase with eyes on higher resistance levels.
The next major targets to watch are $2,910, $3,254, and $3,743, with $4,200 remaining the critical breakout level. A close above this zone could trigger a strong bullish continuation, potentially entering a new price discovery phase. However, failure to push past these upper resistance levels could see Ethereum revert to its range-based behavior.
The recent price structure, combined with strengthening weekly closes, provides confidence for bulls — but confirmation at each stage remains vital. Traders should monitor volume surges, price reactions at resistance, and macroeconomic catalysts that could affect sentiment.
As always, disciplined risk management is essential as Ethereum navigates these key technical zones. With a breakout above $2,200 confirmed and the first target reached, the market may be gearing up for its next move — and it's one worth watching closely.