ETH | Ethereum Game Plan - Swing Long IdeaETH | Ethereum Game Plan - Swing Long Idea
📊 Market Sentiment
Market sentiment remains bullish, supported by expectations of a 0.25% rate cut at the upcoming FOMC meeting. The weakening USD and rising risk appetite across global markets are favoring crypto assets in particular.
📈 Technical Analysis
Price swept the range low (Weekly Fair Value Gap), resulting in a deviation.
It then aggressively reclaimed higher levels and closed above key resistance.
A 12H demand zone was formed during this move.
We’re now seeing a retracement towards that 12H demand zone.
📌 Game Plan
I’m looking for price to hit the 12H demand zone at $3,530 and show a strong reaction.
This level is also below the 0.5 Fibonacci retracement, placing it in the discount area — an ideal entry zone for me.
🎯 Setup Trigger
After price taps the demand zone, I want to see a 1H–4H bullish break of structure to confirm the reversal before entering.
📋 Trade Management
Stoploss: Below 1H–4H swing low
Targets:
• TP1: $3,872
• TP2: $4,090
I’ll trail my stop to lock in profits aggressively as price moves in my favor.
💬 Like, follow, and comment if this breakdown supports your trading!
More setups and market insights coming soon — stay connected!
ETHUSDT.P trade ideas

Sell Short trade Good probability in eth to sell off daily and weekly
has bearish diversion and price took liquidity from recent top

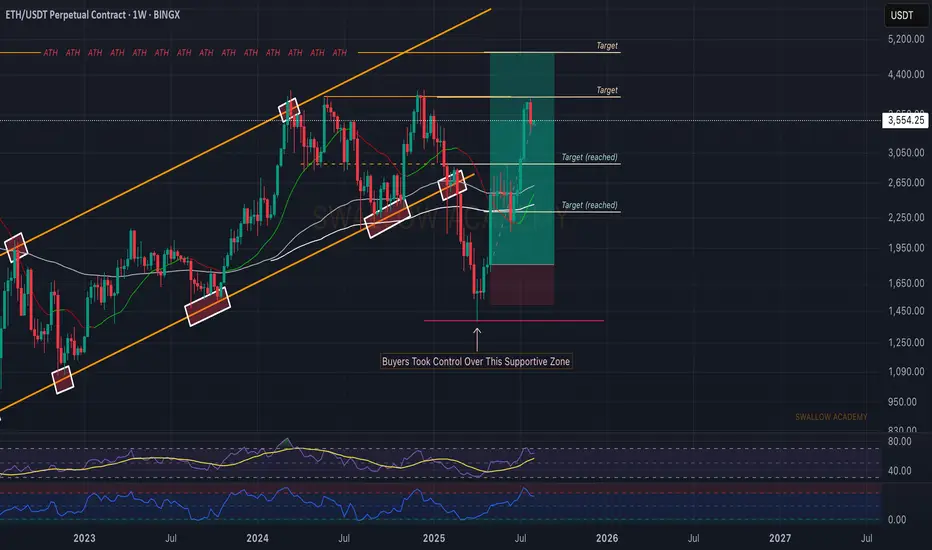
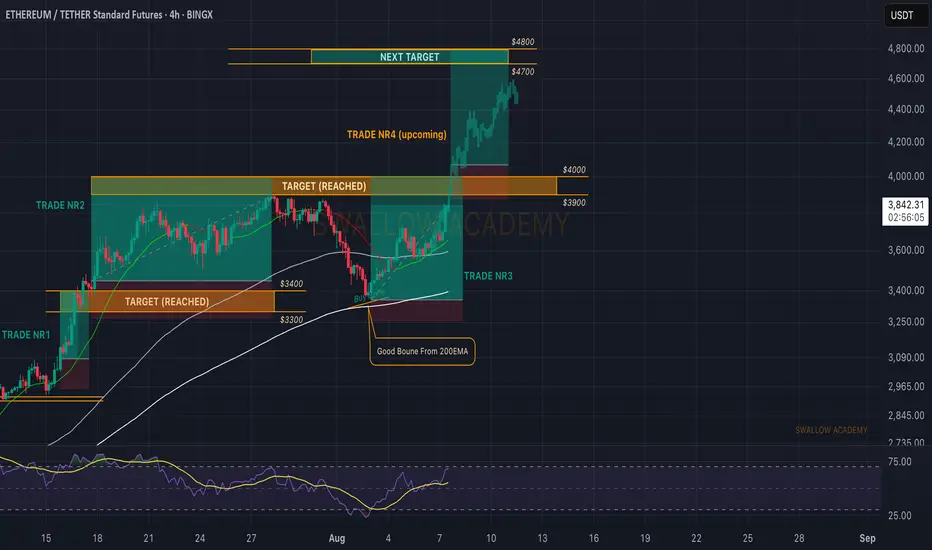
Ethereum (ETH): Looking For Break of $4000 | We Are BullishETH is still bullish in our opinion;recently we had a really good upside movement that got stopped right before reaching the $4000 zone.
Now we had a smaller pullback, which is normal as we had a really strong upside movement so we see it as a natural pullback, which will give us another bounce opportunity (accumulation zone).
Since our entry we have had a good movement, and we are keeping the position open until we reach the ATH zone!
Swallow Academy
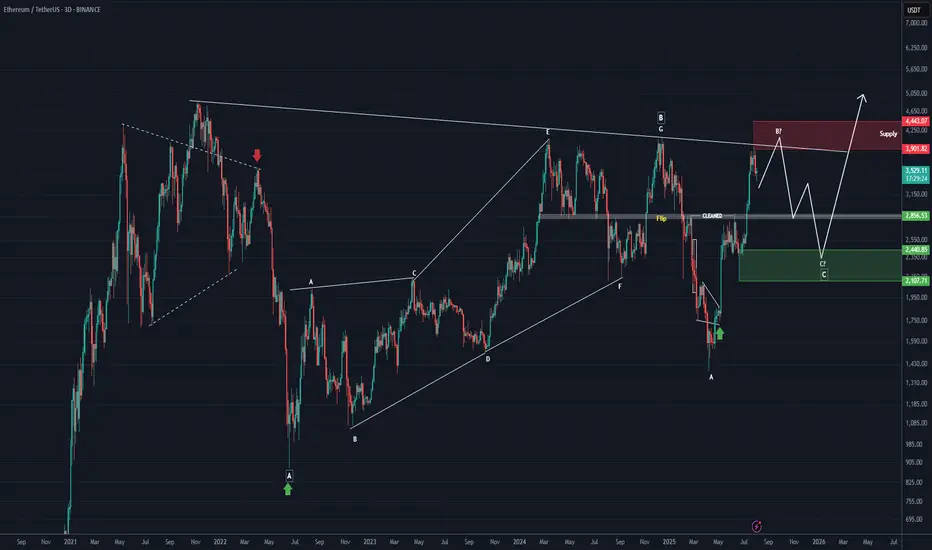
ETH Looks Bearish (3D)Ethereum approached the weekly trendline and experienced a correction. It seems likely that we may see one more push upward to create a false bullish sentiment on this coin. There is even a possibility of a fake breakout above the descending trendline. However, before any major move, a significant correction toward the green zone appears likely | after which the main bullish move is expected to occur.
On higher timeframes, this is currently our outlook on Ethereum.
A daily candle closing above or below the invalidation levels would negate the current buy or sell bias.
For risk management, please don't forget stop loss and capital management
Comment if you have any questions
Thank You
Ethereum Forms Symmetrical Triangle and Bullish PennantETH is currently consolidating in a symmetrical triangle - a narrowing range created by alternating lower highs and higher lows. This pattern is considered neutral, but when broken through it usually gives a strong impulse to movement, you also need to take into account the information from the previous analysis of ETH
A pennant is also being formed - after a strong impulse, the price contracts, creating a small narrow channel (pennant), which often continues to move in the same direction after the breakout
Current price: $3.684
Probable price of the upper breakout from $4100 to $4800, then most likely there will be a small price drop
The probability that we will go down is extremely small now, but the price may fall to the level of $3400 or $3300
ETH | Short | 3hrs This technical analysis is for informational and educational purposes only. It does not constitute financial advice. Remember to always research and consult with a professional before making investment decisions. Good luck! 📈💼🚀

Ethereum (ETH): On Fire, Heading For Another Breakout Attempt ETH is on fire, where the price is catching the buyside momentum and probably going for that $4000K breakout attempt once again, where our trade will be closed as well (in the region of $3950-$4000).
So we wait for that zone to be reached and once we break it there, we will be looking for another entry for a long to $4800!
Swallow Academy
Ethereum ETH at Key Resistance: Here's My Trade PlanEthereum (ETH) has maintained a fairly bullish structure overall 🟢, but price is now trading into a significant resistance level 🧱📈. I’m closely monitoring for a reaction at this zone — ideally a rejection that leads to a pullback into a key support area 🔄📉.
If ETH finds support and we get a clean bullish break in market structure from there 📊🚀, that could present a high-probability setup to the long side — contingent on price action confirming the bias. 🔍 Not financial advice ⚠️.

ETH/USDT Short Setup – Bearish Rejection from Supply Zone!Ethereum is showing signs of weakness after getting rejected from a key 1H supply zone between $3,680 – $3,720. Price failed to break above this level and has started pulling back, suggesting potential downside momentum.
🔍 Technical Breakdown:
Supply Zone (Resistance): $3,680 – $3,720 (Highlighted in blue)
Current Price: $3,666 (Rejection candle forming below resistance)
Immediate Support (TP1): $3,552 (previous structure support)
Key Demand Zone (TP2): $3,417 – $3,342 (strong buying interest previously seen here)
❌ Rejection Evidence:
Price tapped into high-volume area and sold off
Lower highs forming after rejection
Bearish engulfing candles starting to show on 1H
📌 Trade Idea:
If price stays below $3,680 and breaks below $3,640:
Entry: $3,660 – $3,670 (current price zone)
SL: Above $3,720 (above supply zone)
TP1: $3,552
TP2: $3,417
TP3 (Max target): $3,342
🧠 Notes:
Watch for clean break of $3,552 to confirm momentum
Retest of broken support could offer a second entry
ETH remains volatile – use good risk management
🔴 Bias: Bearish Until $3,720 Is Broken

ETHUSD Long to 3700 BITSTAMP:ETHUSD Long trade, with my back testing of this strategy, ETHUSD need to touch 3700
This is good trade, don't overload your risk like greedy, be disciplined trader, this is good trade.
Use proper risk management
Looks like good trade.
Lets monitor.
Use proper risk management.
Disclaimer: only idea, not advice

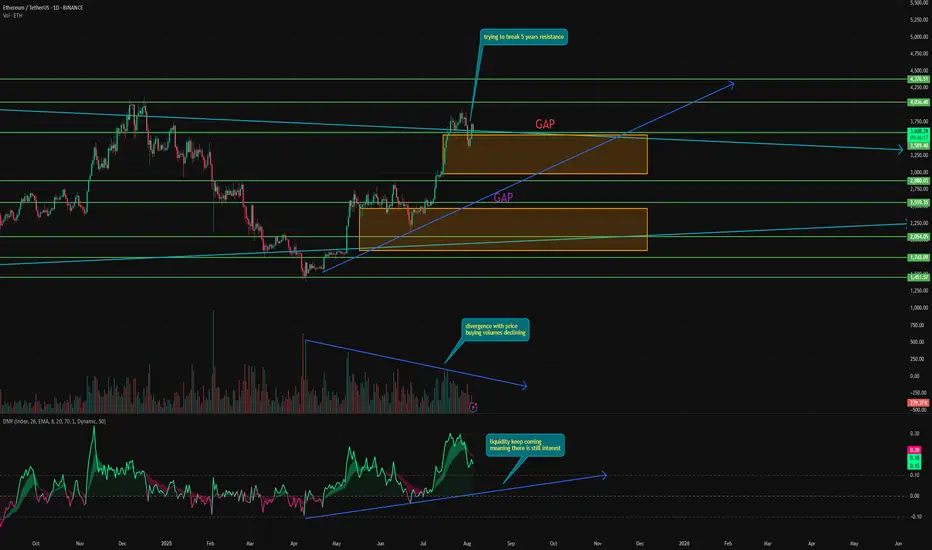
Time to take some profits in ETH⚡️ Hello everyone! Over the past week, the market has been actively correcting, which, ironically for ETH, coincided with reaching the $3,650 level, where its 5-year resistance line is located.
This is obviously a powerful level, which the price already broke through in December last year, but after spending less than a week above it, it went into correction.
If the price can really consolidate above this level, it will open the way for tremendous growth. Even $5,000 will seem like a joke.
⚙️ But is there a real chance of this happening? Let's take a look:
During its growth, ETH moved extremely sharply and powerfully, forming two gaps from below at $3,560–2,987 and $2,483–1,848. As we know, in 99% of cases, gaps close sooner or later. So there is a high probability of a downward movement. In addition, one of the gaps has already partially closed.
Volume - purchase volumes continue to diverge from the price, indicating waning interest in ETH. This often leads to a trend reversal.
Money Flow - Interestingly, liquidity continues to flow into the asset, unlike Bitcoin. And now it is at a fairly high level. In addition, there is harmony with the price.
📌 Conclusion:
Right now, ETH looks strong enough to finally break through resistance and open the way to new heights. However, this will also depend on the overall state of the market.
No matter how strong ETH is, if Bitcoin goes into correction, ETH will go with it.
But if we remove all emotions and thoughts and look at it technically, ETH has reached five-year resistance. And good traders buy on support and sell on resistance.
Have a nice day, everyone!
Here I go long on Ethereum at $4,000Here I go long on Ethereum at $4,000
time to make Ethereum great again By borrowing more tethers and placing market orders triggering Ethereum supply shock
right now.
borrowing and placing market orders starting at $4,000.
tether's reserves are hitting Ethereum hard through me here now.
I think I'm triggering the major Ethereum supply shock here now.
THE MAJOR ETHEREUM SUPLLY SHOCK IS HAPPENING HERE NOW.
Cut the random guesses and hopes and just let the pro do it AT THE RIGHT TIME.
MEGA
I wanna make ethereum great again and it's going to be today and it's going to be now. And old btc prices will become new eth prices
Now Ethereum run is officially confirmed by the same director that triggered bitcoin and ripple supply shock.The Martin Scorcese of the market.
birdman sharkman
CASH MONEY HEROES
when i hit ni* hit me full of that caaaash
more money than I seen in a garbage caaan
stunna island money and the power
That's how we do it make it rain make it shower
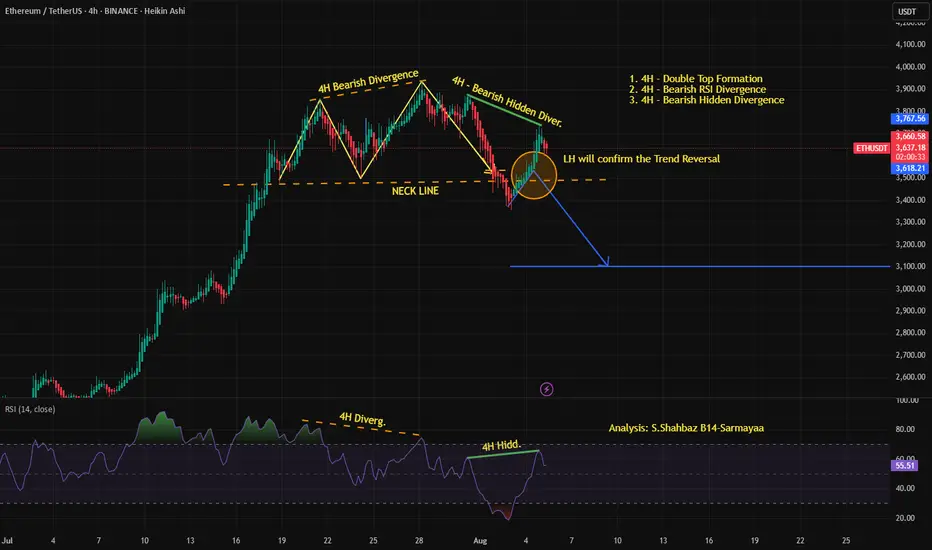
ETH/USDT - 4H Bearish Reversal Setup Confirmed by Double Top &..This 4H chart of Ethereum (ETH/USDT) is indicating a strong bearish reversal setup. A double top formation has formed near the $3,770 zone, accompanied by both a regular bearish divergence and a bearish hidden divergence on the RSI.
Price has broken down below the neckline of the double top, and a possible retest zone is marked, which may act as resistance.
If the price gets rejected from this retest area, the 4H confirmation candle will validate a trend reversal, potentially targeting the $3,100–3,000 zone.
$ETHso who all recon we deviate back here? or in this zone??
a retest of $4k will come not sure when but have marked that out
for now looking for blue line above
dominance still pissing around with the trend line
God candles pending on alts
PTSD is making me cautious but also time to put your pedal to the metal

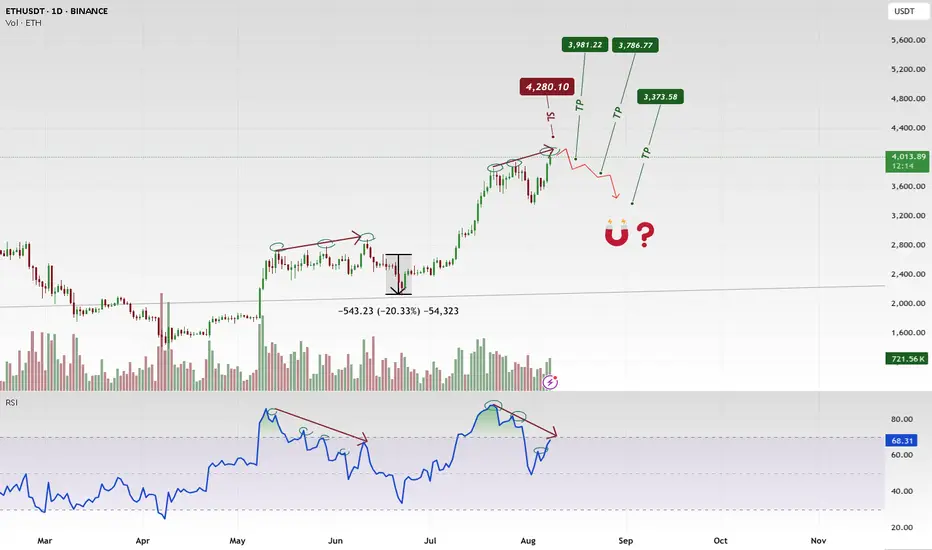
ETHUSDTBearish RSI divergence at $4,280 suggests weakening momentum. Possible correction toward $3,981 → $3,786 → $3,373. Liquidity around $3,000 could attract price before the next leg. I expect a pullback before any strong bullish continuation.
BINANCE:ETHUSDT.P
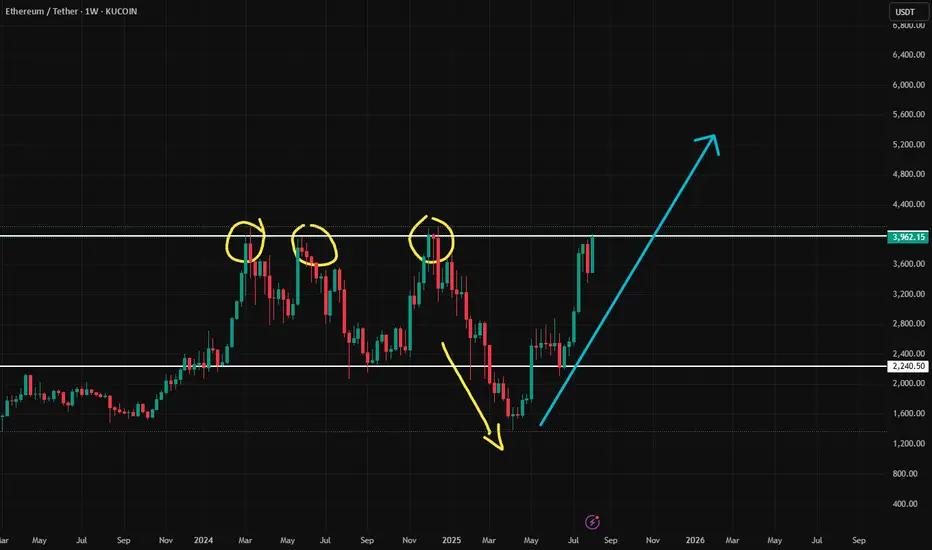
ETHUSDT - Multi-year Symmetrical Triangle ETH has formed a massive symmetrical triangle since the 2021 top (~$4,800).
This triangle has been tightening since 2022 with:
- Lower highs from $4,800 → ~$4,000
- Higher lows from ~$850 → $1,370 → $1,850+
We now close to the apex, meaning a major breakout or breakdown is imminent in the coming weeks/months.
Price Action
ETH is pressing against the upper resistance of the triangle (~$3,850–3,950).
A monthly close above $4,000 would be the first breakout in over 2 years.
Volume
Volume has decreased over time, typical for a symmetrical triangle.
We are looking for volume increase on breakout to confirm it’s on the right track.
Momentum (Laguerre RSI: 0.67)
Momentum is rising, supportive of a bullish breakout.
RSI is not yet overbought, so there’s room for continuation.
Scenarios
Bullish Breakout Scenario:
Trigger: Monthly close above $4,000–4,200
Target: ~$7,000–7,500
Timeline: Could play out over 3–6 months
Bearish Breakdown Scenario
Trigger: Monthly close below $2,500
Target Zone: $1,850 → $1,300 (last major supports)
Would invalidate the higher low structure
I am bullish but it is hard to not to be cautious given its crypto and this is a pretty tough resistance.
Do your own research and make responsible decisions all.
Peace out.

ETH – Possible Pullback After Sharp Rally | Watching Buy ZoneAfter a strong breakout toward the 4014 USDT area on ETH/USDT, we might be seeing signs of a local top forming. Based on technical analysis, I’m watching for a potential pullback to the support zone around 3447 USDT, which is where I’ve placed a Buy limit order.
Key levels:
Sell zone: 4000–4100 USDT (already reached) SELL NOW
Buy zone: around 3447 USDT (waiting for possible dip)
Strategy: Buy the dip and prepare to sell on the next upward move
🔁 Repeating the cycle: Buy low – Sell high
⚠️ This is not financial advice – just my personal market view.
Let me know in the comments if you’re watching similar levels or using the same kind of strategy.
Trade active
Trade was activated
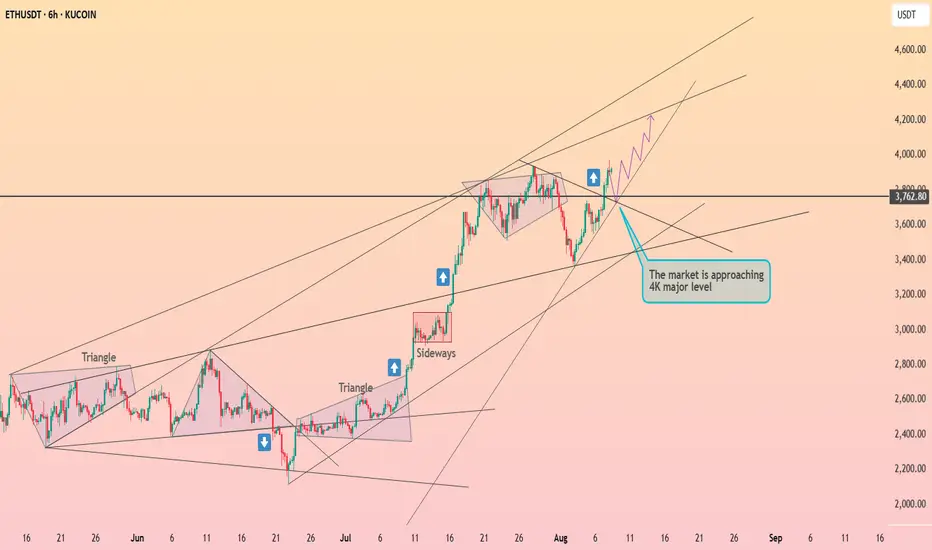
Ethereum is seeking to break through the $4k ┆ HolderStatKUCOIN:ETHUSDT recovered from a swift correction into rising trend support and is pressing back toward the 3.76–3.80k pivot. The broader pattern shows sequential triangle breakouts and a strong sideway accumulation that launched the last vertical leg. If 3.55–3.60k holds on dips, targets sit at 3.85k, 3.95k and the round‑number magnet at 4k. Only a decisive daily close beneath 3.50k would threaten the higher‑low sequence and re‑open 3.35k–3.40k. With breadth improving, the bias remains upward while price consolidates beneath resistance.
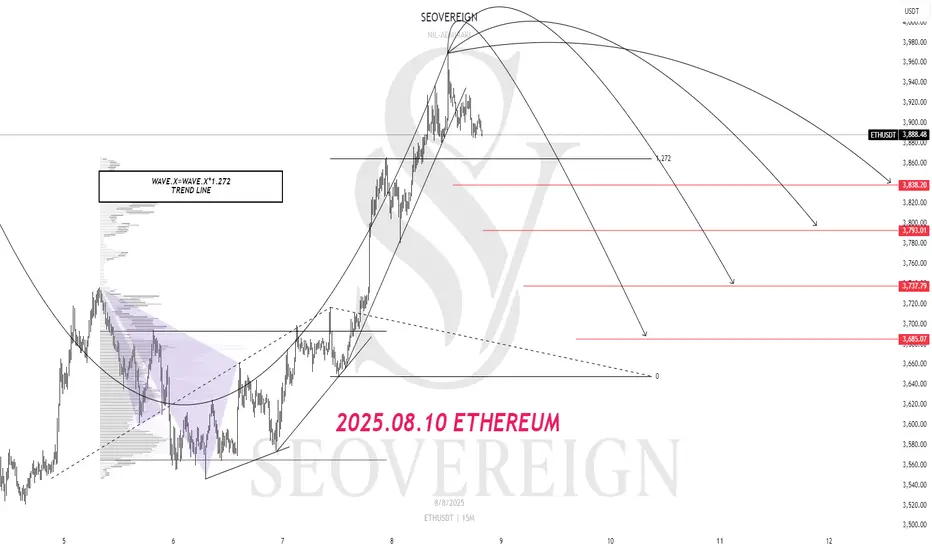
[SeoVereign] ETHEREUM BEARISH Outlook – August 10, 2025In this idea, I would like to present a bearish perspective on Ethereum.
This perspective was derived based on the Elliott Wave Theory.
Until this pattern is confirmed, I have been continuously tracking the Elliott Waves and adding reasons for the bearish scenario one by one.
As a result, I have concluded that the next major move is likely to be downward, and while searching for a specific entry point, I detected the recent trendline break.
If this wave is clearly confirmed, I believe there is a high possibility of a decline to around the average take-profit level of 3763 USDT without much difficulty, and therefore, I am considering entering a short position.
All the details have been drawn on the chart, so please refer to it.
Thank you very much for reading, and as time goes by and the chart becomes clearer, I will continue to update this idea accordingly.
Thank you.
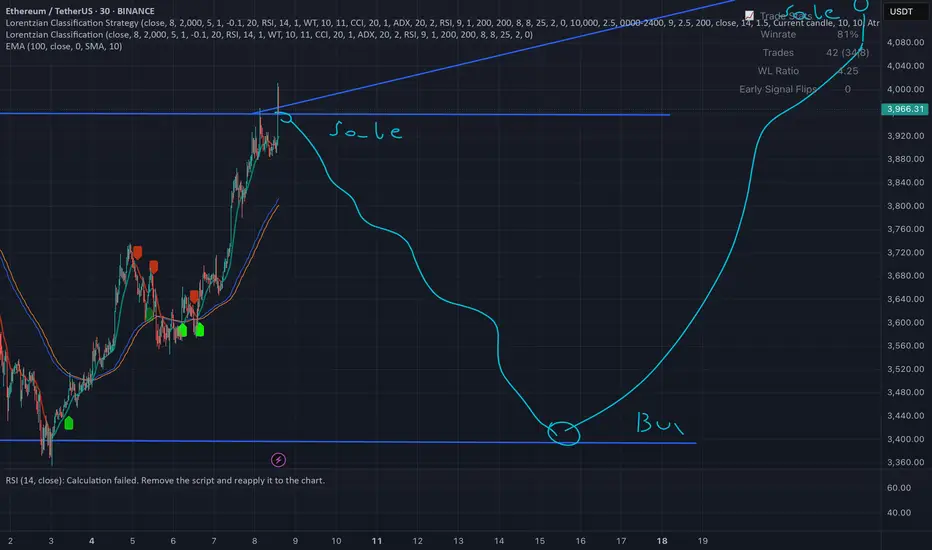
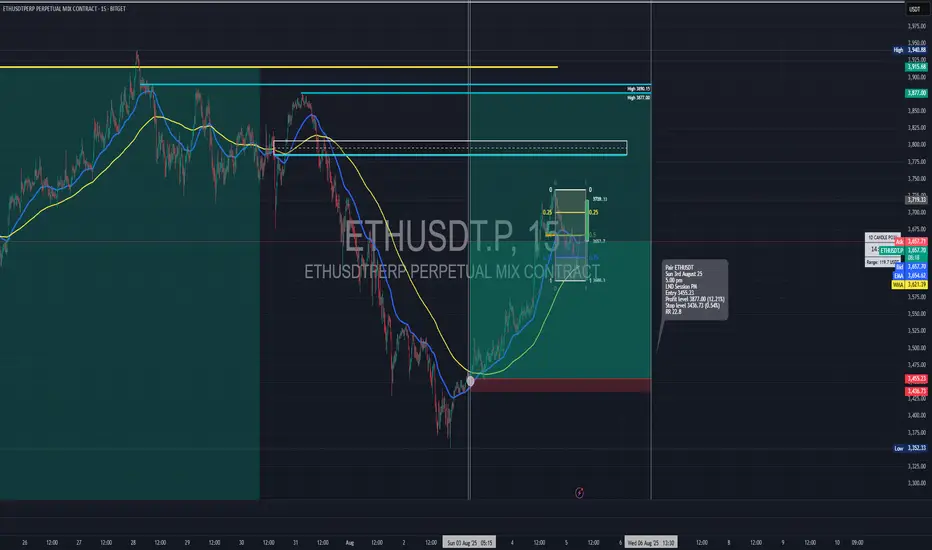
Long trade
15min TF overview
🟩 Trade Type: Buyside Trade
Pair: ETHUSDT
Date: Sunday, 3rd August 2025
Time: 5:15 PM
Session: London–New York Overlap (LND Session PM)
Timeframe: 15 minutes
🔽 Entry Parameters
Entry Level: 3,455.23
Stop Loss: 3,436.73 (-0.54%)
Take Profit: 3,877.00 (+12.21%)
Risk-to-Reward (RR): 22:8
📉 Market Structure & Technicals
Trend Context:
Price reversed from a steep bearish trend and showed signs of a bullish momentum shift.
EMA/WMA Levels:
EMA (blue) and WMA (yellow) show a bullish crossover at the point of entry
Both MAs began to slope upward, confirming the trend shift.
Liquidity Observations:
Clean sweep of prior lows below 3,500 preceding entry.
Price traded back into a premium zone after reacting from a deep discount.
🧠 Narrative / Rationale
Set up Narrative:
ETH completed a strong downtrend and printed a bullish market structure shift (MSS) on the 15-minute TF. Entry was taken after price reclaimed the (POI) and confirmed a higher low.
Current Status: Trade in progress, profit levels partially hit.
TP aligns with the previous supply zone or relatively equal highs around 3,784.
Additional liquidity above 3,877–3,915 for extended targets if trade continues.
ETH Daily: Lower High, Lower Low. That Was My Signal
This is ETH on the Daily
Price action today looks very similar to December 2024.
Back then, ETH attempted twice to flip the 0.236 Fib level at $3378.45 — first on Dec 6, then on Dec 12. Both failed. Price found support at the 0.5 (midpoint between the 0.236 and 0.382), bounced, got rejected again at the 0.236, then went lower.
Now, we’re seeing a near-identical pattern:
– First attempt to reclaim the 0.236 Fib on July 21
– Second attempt on July 27
– Both failed
– Price found support again at the 0.5 middle level
– Bounced back to the 0.236
– Got rejected again
What will happen this time?
For me, the answer already came: we’ve now seen a lower low followed by a lower high — a temporary break of bullish structure. That’s my cue to scale out of my long and reduce exposure so I’m not caught off guard overnight.
Now that I’ve done that, I can observe the chart objectively without emotional bias or panic-selling.
Technically, ETH is in a short-term downtrend.
Fundamentally, however, I believe we’re in the early stages of a larger uptrend, driven by strong bullish news around crypto (happy to list them if you're curious).
But until those bullish narratives start kicking in and price moves up again, I have to be extremely careful not to get wiped out — so I’ll stay closely aligned with price action.
Like I said: short-term downtrend, long-term opportunity.
Always take profits and manage risk.
Interaction is welcome.

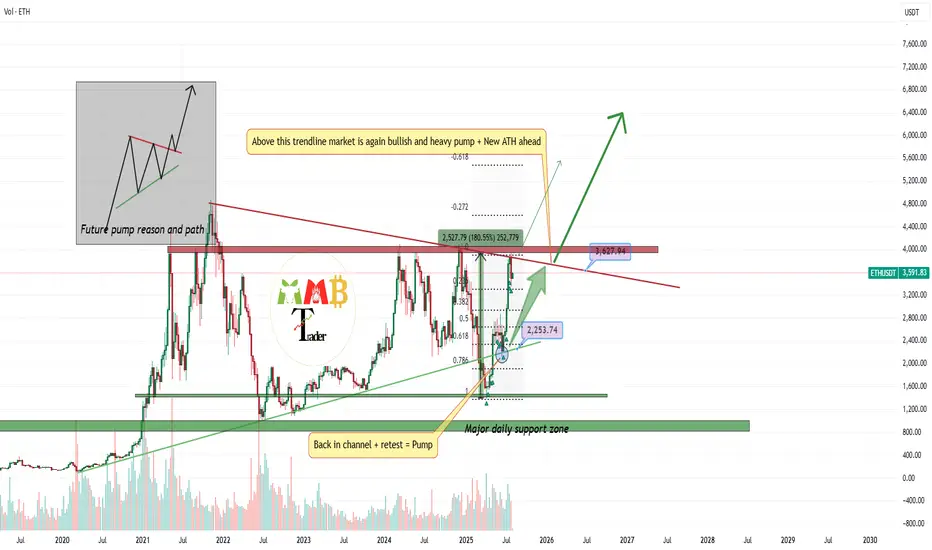
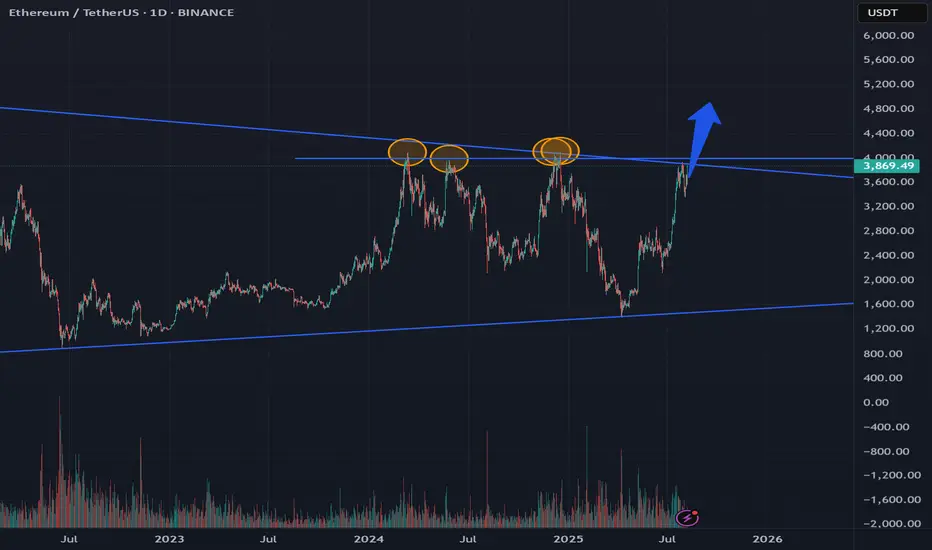
The bull market here will continue if the price break 4K$ As we can see on chart two major resistances which are reason of killing BINANCE:ETHUSDT each time are the red trendline and also the 4K$ resistance zone and soon i believe ETH now has the power to break this resistances and start new high volume pump the targets like 5000$ and new ATH.
DISCLAIMER: ((trade based on your own decision))
<<press like👍 if you enjoy💚