ETH Breakout Strategy
🚀 ETH Breakout Strategy 🔥
♦️ As mentioned before, the long position on ETH/USDT had to be placed before the 0.03277 breakout on ETH/BTC.
✅ Simultaneously, ETH.D broke above 12.16%, adding strong confluence to the bullish setup.
⭕️ The final confirmation came when ETH/USDT broke above 3724.00 – a high-probability entry for trend-followers.
💎 Missed it? Don’t worry.
🔜 The next long setups will be:
1. Break of 3900.00
2. Followed by the break of 4000.00 – which is probably to break impulsively and sharply.
♦️ Until ETH drops below 3300.00, I remain bullish-biased and will look only for long setups.
Even if I miss potential short-term short opportunities, it's not an issue.
❗️Why?
Because my strategy is based on aligning with the higher timeframe trend – and for me, that’s the 1D cycle, which is currently bullish.
🔥 In trading, patience with direction beats chasing every move.
🚀 If you value clean structure-based analysis, hit the rocket, drop a comment, and don’t forget to follow for more crypto insights!
ETHUSDT.P trade ideas

The 3738.28 zone is the golden pointAfter confirmation in this price zone, we can say that the path to 3800 becomes much easier and more likely, making the move toward 4000 more feasible. However, it's still too early to make decisions about that, so for now, we're only analyzing up to 3800.
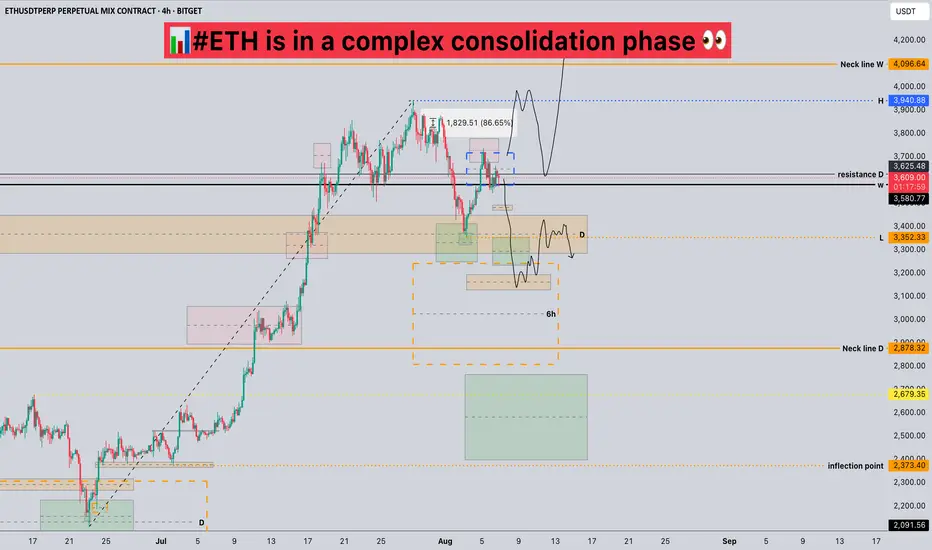
#ETH is in a complex consolidation phase📊#ETH is in a complex consolidation phase 👀
🧠From a structural perspective, the previous long uptrend has ended, so we should be wary of a deeper correction. We are currently in the middle of a complex consolidation, so there are many contradictions.
➡️Thus, if you want to participate in a long trade, you need to patiently observe whether this period of sideways consolidation can continue and a bullish structure can be established.
➡️If you want to participate in a short trade, you need to patiently wait for a break below the yellow support zone on the daily chart. This will then turn into resistance, and then look for short signals within that resistance zone.
🤜If you like my analysis, please like 💖 and share 💬
BITGET:ETHUSDT.P
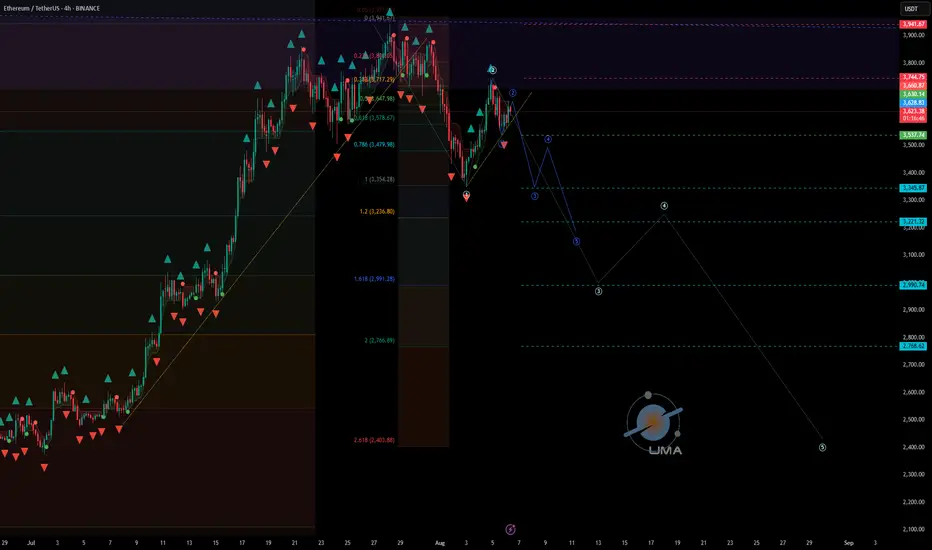
ETHUSDT - UniverseMetta - Analysis#ETHUSDT - UniverseMetta - Analysis
Potential reversal & correction setup in progress
📆 W1 – Weekly Timeframe
🔹 Price is testing a major monthly resistance zone, from which price has previously rejected toward the lower edge of a large triangle structure
🔹 According to the 3-wave structure, ETH has reached 161% of Wave 1 and closed above the 200% Fibo level
🔹 If the price fails to make a new high this week, a top fractal may form — a possible signal for a medium-term correction
📉 D1 – Daily Timeframe
🔹 A double top pattern is forming, along with a potential retest of the trendline
🔹 If confirmed, this could trigger a 3-wave correction structure downward
🔹 A downward fractal is already printed — adding confluence to the bearish scenario
🎯 Correction targets:
• $3,242
• $2,546
⏳ H4 – 4H Timeframe
🔹 Current price action suggests a correction from the recent impulse
🔹 A 3rd wave may initiate upon trendline breakout
🔹 Entry confirmation may come from breakout + retest, or via confirmed double top structure
🔹 Stop should be placed above the high of Wave 1 (H4)
🎯 Trade Setup:
Entry: 0.64930
TP: 0.65404 - 0.65700 - 0.66164 - 0.66676
Stop: 0.64482
‼️ Risk should not exceed 1–3% of your portfolio
This signal/idea is not financial advice
📌 Key Fundamental Triggers to Watch:
🔹 Federal Reserve expectations – a dovish shift could support ETH short-term, but failure to materialize may drive a pullback
🔹 ETH ETF news – updates on applications, approvals, and volume flows can significantly impact sentiment
🔹 Correlation with NASDAQ/S&P500 – weakness in equities could drag crypto lower
🔹 On-chain activity – declining gas usage or demand may indicate lower network utility and bearish pressure
🔹 Weekly overbought condition – many technical indicators (RSI, MACD) point to overextension
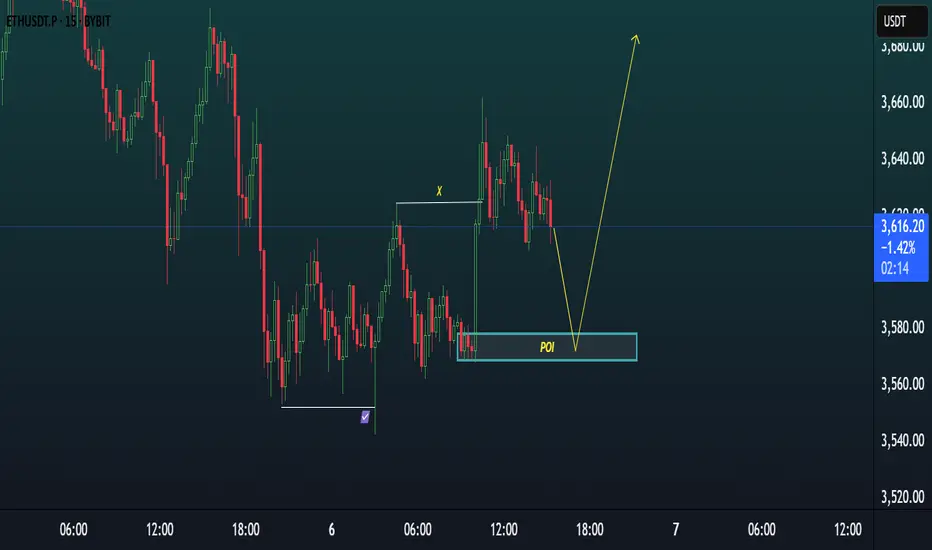
ETH/USDT 15m SETUP.ETH/USDT 15m Setup 🚀
Price is approaching a clean POI (Order Block + Imbalance zone).
Expect a short-term dip into the zone followed by a bullish reaction.
📌 Trade Idea:
Wait for price to tap the POI
Look for bullish confirmation
Target upside continuation after liquidity grab & structure shift
High probability long setup incoming!
ETH NEXT MOVE AND BUY ZONE.1. Market Structure:
ETH/USDT broke previous structure highs (marked with X), confirming a bullish trend shift.
Price made a strong impulsive move upward after that break, forming higher highs and higher lows, indicating smart money accumulation.
2. Price Action & Current Retracement:
After forming a recent peak near $3,950, ETH entered into a retracement.
The retracement is currently holding above key liquidity and demand zones, showing signs of healthy correction rather than reversal.
3. Liquidity Grab – Sell-Side Liquidity (SSL):
There is Sell-Side Liquidity (SSL) resting below $3,700, which has not yet been taken out.
Smart money often targets such liquidity before initiating a new leg up — this makes SSL a potential magnet for price.
4. Fair Value Gap (FVG) + Demand Zone (POI):
Just below the SSL lies a confluence zone:
A clear Fair Value Gap (FVG) between approximately $3,680–$3,700, showing inefficiency in price.
A Demand Zone (POI) below that, between $3,640–$3,680, representing the origin of the bullish move that broke structure.
This zone provides high-probability support and a potential area of smart money re-entry.
5. Trade Setup Expectation:
Scenario: Price is likely to:
Sweep SSL below $3,700.
Tap into the FVG + Demand Zone.
Show bullish confirmation (like a bullish engulfing, Choch/BOS on lower timeframe).
Entry: After confirmation inside demand zone.
Stop Loss: Below demand zone (~$3,620).
Take Profit 1: Retest recent high at $3,950.
Take Profit 2: Extension toward $4,050–$4,100 based on higher timeframe targets.
✅
Summary:
ETH/USDT is in a bullish structure but currently pulling back. A sweep of sell-side liquidity (SSL) and a tap into the FVG + Demand Zone around $3,640–$3,700 is expected. After confirmation, it offers a high-probability long setup, aligning with smart money accumulation logic.

Long here.Genius I know right.
I though I was special calling for a big drop on XPR and closed out a nice trade to start my week with my morning coffee here in NZ.
Of course I look at the rest of the market and see that the drop was clearly across the board. I don't feel as special, but still happy. And will be really happy if we are close to a support level on ETH after this 10% drop. I am already in long with some size and ready to average into a much bigger long position. This is where I am happy to not run close stops, size up without crazy leverage and let my liquidation point act as my stop. Very rarely, but this is a very good opportunity in my opinion. Just be mindful to have a plan if we go lower, but I think we will retrace back up to $1687 within the next couple of hours.

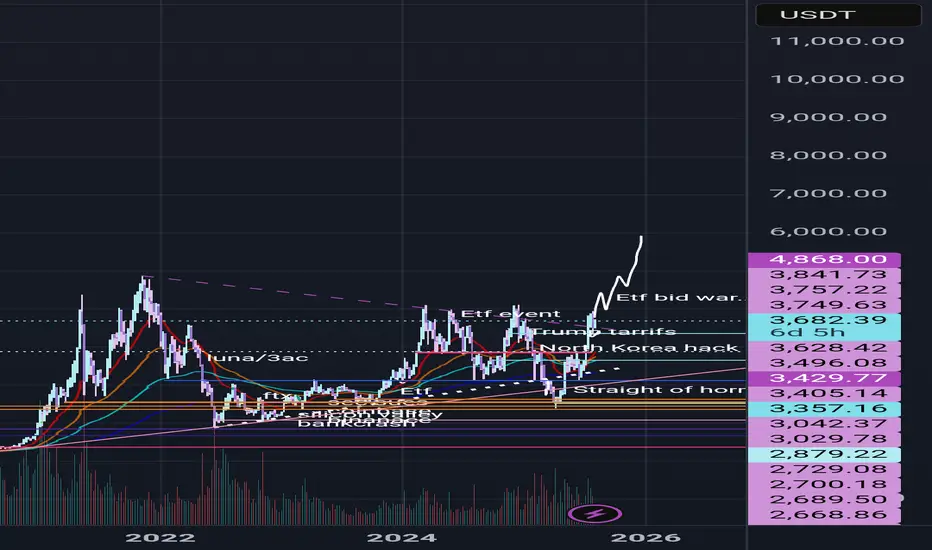
EthusdHonestly probably marks up very heavily soon...
We are entering etf bid war phase of the cycle.
Can't even really draw how vertical this chart could go as certain macro economic conditions seem to be brewing...
15k is the predicted target of certain large tradfi firms that are accumulating, bitmine for example.
They are basing their targets from the success of the circle internet groups public listing as well as fundamental factors such as JPMorgan and other institutions launching their own stable coins on ethereum...
Multiple companies rushing to accumulate 5% of the supply while predictions of a 75bps rate cut from the fed are starting to brew...
Supply shock combined with inflationary event aswell as eths successful merge earlier this year are incredibly bullish catalysts and we aren't even at the ath valuations seen last cycle.
ETHEREUM ETHUSDTThe main factors driving Ethereum (ETH) price changes over the last month include:
Institutional Demand and ETF Inflows: The launch and growing adoption of Ethereum spot ETFs by firms like BlackRock, Fidelity, and Grayscale have driven significant new capital into ETH. These ETFs have attracted institutional investors, creating strong buy pressure and wider market participation, contributing to a roughly 54% rally in Ethereum over the past month.
Corporate Treasury Accumulation: Several corporate crypto treasury funds have been aggressively increasing their Ethereum holdings, with some managing billions in ETH. This corporate buying adds substantial demand and upward price pressure.
Stablecoin Growth on Ethereum: Investor optimism about stablecoins, many of which are issued on the Ethereum blockchain (e.g., Tether, USDC), has contributed to speculation and bullish sentiment. Regulatory progress like the GENIUS Act also boosts confidence in stablecoin use and proliferation, indirectly supporting ETH.
Supply Dynamics: Exchange balances of ETH have hit near decade lows, creating a supply squeeze. Combined with the Ethereum network's issuance limits and deflationary pressure from network upgrades, this scarcity supports price gains.
General Market Sentiment and Macro Environment: While overall cautious bullishness drives price up, macroeconomic factors like Federal Reserve policy, interest rate adjustments, and global liquidity also impact ETH volatility. For example, tightening financial conditions and the strength of the U.S. dollar can create temporary downward pressure.
In summary, the price changes in Ethereum over the last month are predominantly driven by increasing institutional and corporate demand fueled by ETF offerings and treasury accumulation, positive momentum from stablecoin growth on Ethereum, tight supply dynamics, and supportive technical market signals. Macro headwinds and regulatory environment continue to modulate this trajectory.
#ethusdt #ethereum

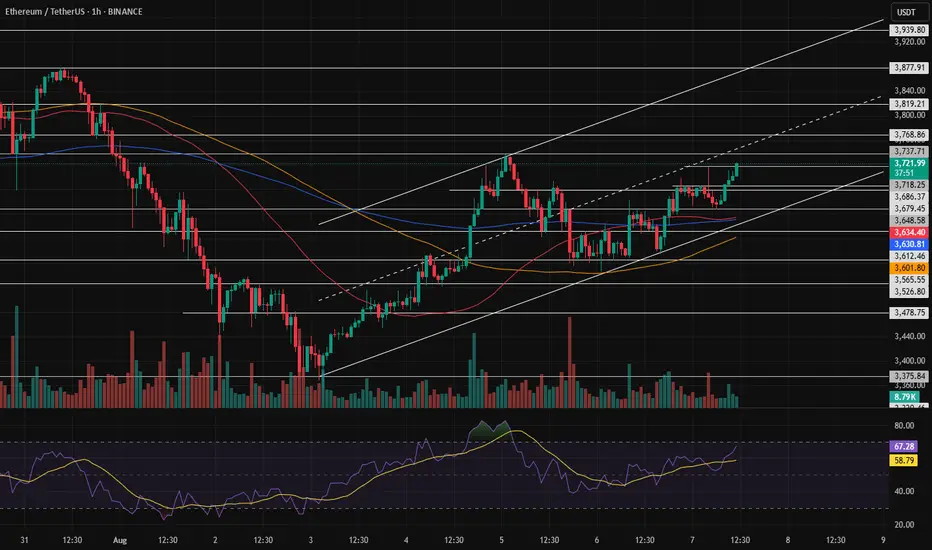
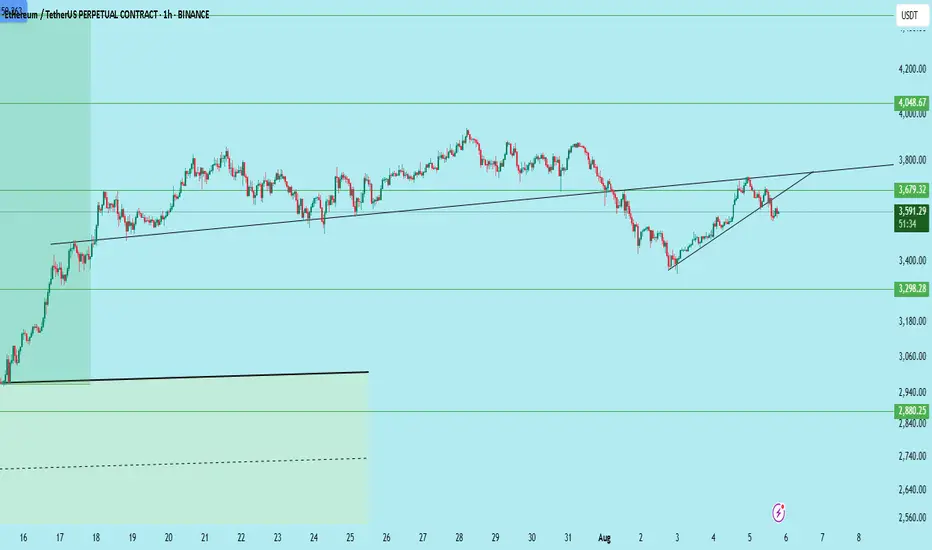
ETH 1H – Trendline + Demand Zone Converge, Will Bulls Step In?Ethereum is approaching a high-confluence zone on the 1H chart — where rising trendline support intersects with a prior demand zone that triggered the last major rally.
This area around $3,500–$3,430 represents a key test of short-term momentum and trend structure.
🔹 Technical Confluence
Strong ascending trendline from mid-July has held through 3 clean touches — and is now under pressure again.
The blue demand zone was the launchpad for ETH’s move toward $3,800, showing clear price memory.
Price is now approaching both zones while momentum is fully reset on the Stoch RSI.
🔹 Momentum & Setup
The Stoch RSI is hovering in oversold territory — just as ETH returns to structure.
A higher low in this zone would confirm buyer interest and setup a potential breakout toward $3,900+.
🔹 Scenario to Watch
A clean bounce + reclaim of local structure would confirm a bullish continuation setup.
Failure to hold this level could trigger a trendline break and deeper retracement — invalidating short-term bullish structure.
Will ETH defend this zone and continue the trend — or is a breakdown brewing?
Let me know your thoughts in the comments 👇

Ethereum (ETH/USDT) – Midline Break Retest and Channel Top in Si🔍 Technical Overview
Ethereum has recently broken above the midline of its descending channel, indicating a potential bullish shift within the short-term corrective structure. The price action suggests that we are currently witnessing a retest of the broken midline, which is now acting as dynamic support.
This behavior is consistent with smart money principles — where a previously broken internal structure gets tested before continuation.
⸻
🧠 NEoWave Context
Structurally, ETH appears to be developing a Contracting Corrective pattern, with the current leg likely evolving as Wave D. This wave typically exhibits strength and complexity, often stretching toward the channel top while still respecting broader consolidation boundaries.
⸻
💡 Smart Money Insights
• ✅ BOS already confirmed on LTF (1H, 4H) with higher lows
• 🔄 Price has reclaimed the internal broken structure (midline) and is retesting it
• 🔋 Bullish OB around $3,480–$3,510 acted as a launch zone for current leg
• 📍 Next resistance is the channel top near $3,740
⸻
📊 Trade Scenarios
🟩 Bullish Scenario (Preferred):
If the retest of the midline holds, ETH is likely to continue its move toward the upper boundary of the descending channel (~$3,730–$3,750). This aligns with Wave D expectations in complex corrections.
🟥 Bearish Invalidations:
A breakdown back below $3,520 and loss of the internal bullish structure would negate this short-term bullish scenario and reopen downside potential toward $3,350.
⸻
⚠️ Trader Tip:
Retests of internal structures like midlines or internal trendlines often provide low-risk continuation setups — if confirmed by bullish internal BOS.
⸻
✅ Conclusion
Ethereum remains technically corrective but with bullish momentum building within the channel. As long as the midline holds, we expect continuation toward the channel top, completing Wave D structure before potential reversal.
💬 Drop your alt counts or thoughts in the comments.

ETH/USDT Bearish Setup – Rising Wedge Breakdown & RetestEthereum (ETH/USDT) has broken down from a rising wedge — a classic bearish pattern — and is now showing signs of rejection after a clean retest of the broken trendline around $3,679.
Structure:
Rising wedge pattern on the higher timeframe
Breakdown confirmed with retest of lower trendline as resistance
No bullish follow-through after retest
Trade Plan:
Bias: Bearish below $3,680
Entry Zone: Anywhere below $3,670–3,680 if rejection is confirmed
Stop Loss: Above $3,720 (invalidation)
Targets:
Target 1: $3,298
Target 2: $2,880
Target 3: $2,640
Key Notes:
If ETH reclaims and holds above $3,680, the setup gets invalidated
Watch BTC behavior — ETH tends to follow
Volume shows no strength from bulls post-breakdown
This setup presents a high-risk, high-reward opportunity if the price continues to decline from this zone.
Conclusion:
Stay cautious, as the market could see more downside if ETH stays below $3,680. Manage risk accordingly.
DYOR | Not Financial Advice
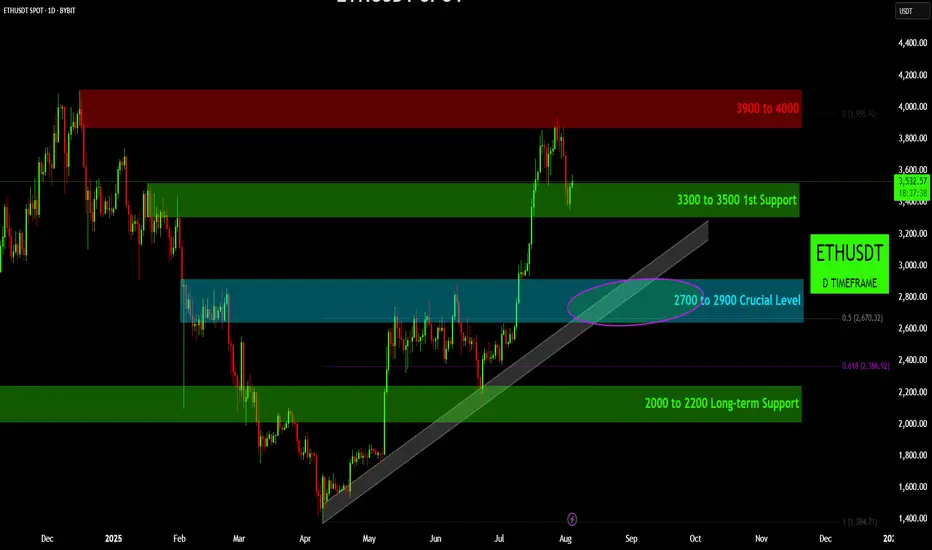
Can Ethereum Hold This Crucial Level and Continue its Ascent?Can Ethereum Hold This Crucial Level and Continue its Ascent?
ETHUSDT presents a clear bullish structure on the daily timeframe, having recently broken out of a multi-month consolidation pattern. The market has encountered a significant resistance zone but has since pulled back to test a key support level. The price action is currently defined by a series of well-established support and resistance zones, along with a crucial rising trendline, which together will determine the asset's next major move.
1. The Bullish Impetus & Key Resistance:
All-Time High Resistance ($3900 to $4000): This upper red zone represents a significant supply area where sellers have historically entered the market, preventing a new all-time high. The recent rally encountered resistance in this zone, leading to the current pullback.
The Rally from the Consolidation: Following a period of consolidation, Ethereum staged a powerful rally, breaking through several resistance levels on its way to re-testing the all-time high zone.
2. The Immediate Support Zone:
First Support ($3300 to $3500): The current price is engaging with this green zone. This level has been a key area of previous support and resistance, and its ability to hold as support will be a critical test for the bulls. A successful defense of this zone would be a strong signal for a continuation of the upward momentum.
3. The Crucial Level & Trendline Confluence:
Crucial Level ($2700 to $2900): Below the immediate support lies a more significant support confluence zone, marked by the blue box and a rising trendline. This "Crucial Level" is a major demand zone that has previously served as a pivot point in the market. The confluence with the rising trendline, which has been providing support since late March, makes this a highly significant area.
0.5 Fibonacci Retracement: This area also aligns with the 0.5 Fibonacci retracement level of the recent major move, reinforcing its technical importance. A break below this zone would suggest a significant shift in market sentiment.
4. The Ultimate Support:
Long-term Support ($2000 to $2200): This lower green zone represents a robust long-term support level. If the "Crucial Level" were to fail, this area would be the next major target for a deeper correction. The 0.618 Fibonacci level is also situated within this zone, further highlighting its significance as a potential bounce area.
Conclusion:
ETHUSDT is currently re-testing its first major support zone after a rally toward all-time highs. The ability of the bulls to defend the "$3300 to $3500" level will be crucial for a potential re-test of the "$3900 to $4000" resistance. A failure to hold this support would likely lead to a retracement toward the even more critical "$2700 to $2900" level. The integrity of the rising trendline and the "Crucial Level" will be the ultimate determinant of whether the long-term bullish trend remains intact.
Disclaimer:
The information provided in this chart is for educational and informational purposes only and should not be considered as investment advice. Trading and investing involve substantial risk and are not suitable for every investor. You should carefully consider your financial situation and consult with a financial advisor before making any investment decisions. The creator of this chart does not guarantee any specific outcome or profit and is not responsible for any losses incurred as a result of using this information. Past performance is not indicative of future results. Use this information at your own risk. This chart has been created for my own improvement in Trading and Investment Analysis. Please do your own analysis before any investments.
Ethereum (ETH): Keep Milking The ETH | Bounced From 200EMAEthereum has been one of the easiest coins to predict for upcoming moves, and we did it again. The 200 EMA rejected the price, which led to another smaller buy-side movement on the coin, giving us an opportunity for a long position here.
Well, nothing has changed; the game plan remains the same—we are aiming for $4000 again and then $4800.
Swallow Academy

ETH forming double topETH is forming a double top, nice confluence to what BTC is doing rn
Maybe that's the turnaround and its going back down for now.

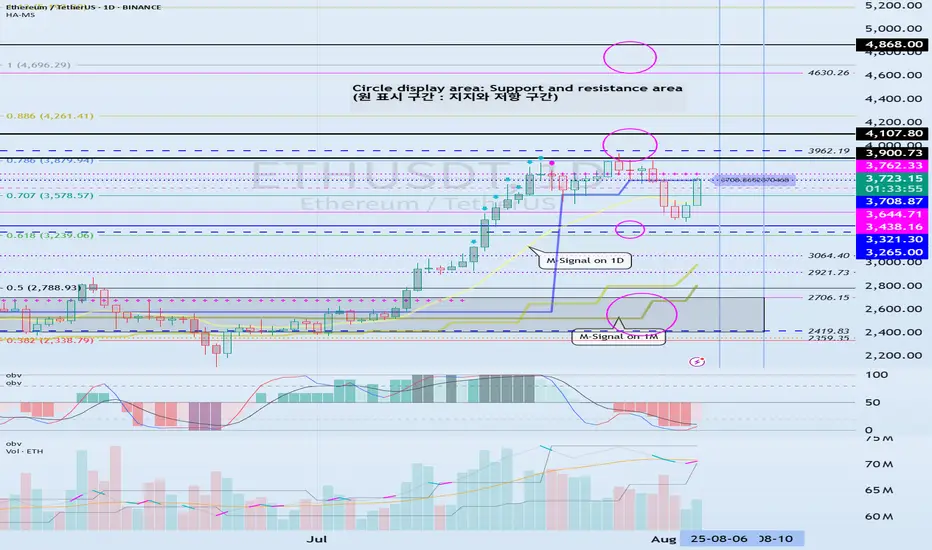
Important Trend Determination Area: 3708.87-3762.33
Hello, traders!
Follow us to get the latest information quickly.
Have a great day!
-------------------------------------
(ETHUSDT 1D Chart)
The price began to rise after breaking above the important 2419.83-2706.15 area.
This can be interpreted as the beginning of a step-up trend, with an upward breakout of the HA-High ~ DOM(60) range.
The HA-High ~ DOM(60) range corresponds to the 2581.59-2681.60 range.
This suggests that the price is currently testing whether a second step-up trend will continue or whether it will simply end as the first step-up trend.
The HA-High ~ DOM(60) range is currently 3708.87-3762.33.
Therefore, if the price rises above 3708.87-3762.33 and maintains this level through the upcoming volatility period, a second step-up trend is expected.
The conditions for this are as follows:
- The K value of the StochRSI indicator must rise from the oversold zone and show an upward trend with K > D. - The OBV indicator must rise above the High Line and maintain an upward trend.
- The TC (Trend Check) indicator must continue its upward trend. (If possible, it's best to stay above 0.)
The next volatility period for ETH is expected to last from around August 6th to 10th.
However, it's worth keeping an eye on the movements during the BTC volatility period.
-
Thank you for reading to the end.
I wish you successful trading.
--------------------------------------------------
- This is an explanation of the big picture.
(3-year bull market, 1-year bear market pattern)
I will explain in more detail when the bear market begins.
------------------------------------------------------
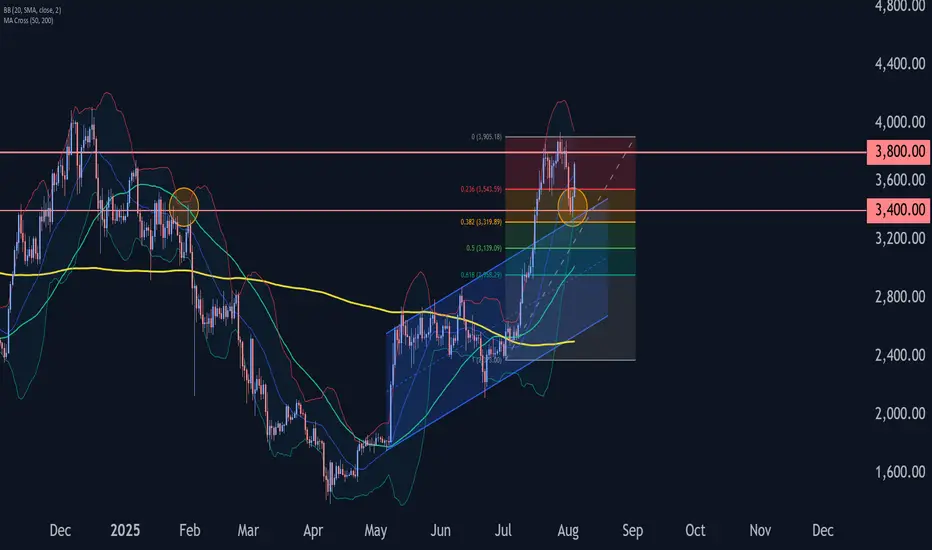
Ethereum Wave Analysis – 4 August 2025- Ethereum reversed from the key support level 3400.00
- Likely to rise to resistance level 3800.00
The Ethereum cryptocurrency recently reversed from the support zone between the key support level of 3400.00 (formerly a resistance level from January) and the upper trendline of the recently broken up channel from May.
This support zone was further strengthened by the 38.2% Fibonacci correction of the previous sharp upward impulse from July.
Given the clear daily uptrend, Ethereum cryptocurrency can be expected to rise to the next resistance level 3800.00.
eth sell midterm "🌟 Welcome to Golden Candle! 🌟
We're a team of 📈 passionate traders 📉 who love sharing our 🔍 technical analysis insights 🔎 with the TradingView community. 🌎
Our goal is to provide 💡 valuable perspectives 💡 on market trends and patterns, but 🚫 please note that our analyses are not intended as buy or sell recommendations. 🚫
Instead, they reflect our own 💭 personal attitudes and thoughts. 💭
Follow along and 📚 learn 📚 from our analyses! 📊💡"

ETH 4H – Demand Ladder Holding Strong, Bullish Set Up?Ethereum has been climbing a ladder of demand zones on the 4H chart — with each major impulse followed by consolidation and a successful retest of prior support. This current pullback has once again tapped into a reclaimed demand area near $3,400–$3,500.
So far, every past structure has acted as a springboard for the next leg up — a pattern that’s held since April.
📊 Key insights:
– Multiple confirmed demand zones stacking higher
– Prior demand flips to support after each breakout
– Most recent pullback held structure with Stoch RSI bouncing from oversold
– Structure and momentum suggest potential continuation if $3,400 holds
A breakdown of this final zone could invalidate the staircase, but until then, structure favors the bulls.
Is ETH gearing up for $4,000+ or finally losing steam?
Drop your thoughts in the comments.

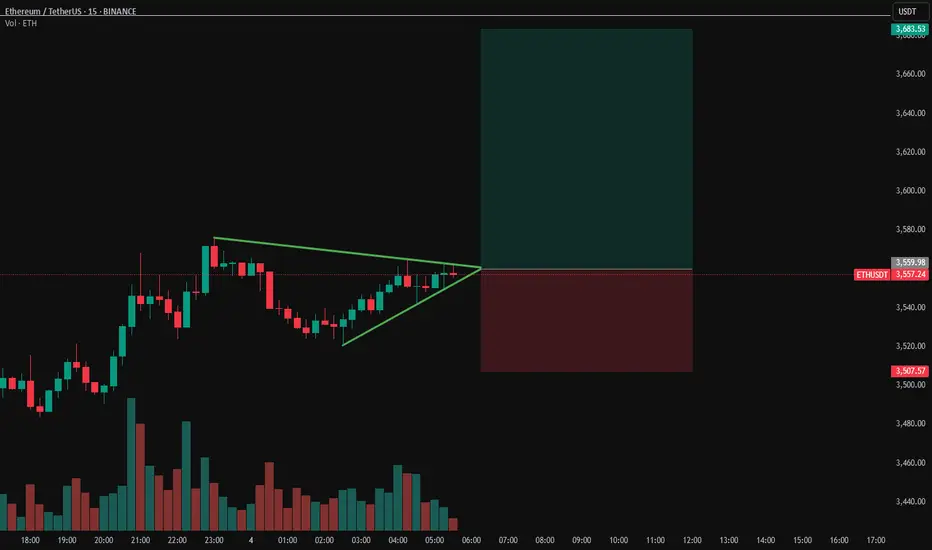
ETHUSDT Breakout ImminentETH sitting on $3500 support after reclaim
Price action is tight and indecisive.. lots of dojis and back-and-forth engulfing candles. Buyers and sellers clearly fighting it out.
We’re coiled in a symmetrical triangle, right on a key level that used to be strong support. It got broken but now reclaimed, im leaning bullish.
S&P and Nasdaq opened strong. If we break out of this triangle to the upside with volume, we could see a quick move toward $3650-3700.
ETH | Ethereum - Weekly Recap & Gameplan - 03/08/25📈 Market Context:
Traders are currently anticipating a potential 0.25% rate cut at the September FOMC meeting, which continues to support the broader bullish outlook.
While the market pulled back following weaker-than-expected Non-Farm Payroll data, overall sentiment remains optimistic.
Greed has cooled off into a more neutral stance. Historically, August often brings some consolidation or pullbacks — but the structural bias for crypto market remains bullish.
🧾 Weekly Recap:
ETH started the retracement movement after building a bullish trend over the past couple of weeks.
It’s mainly being affected by Bitcoin's bearishness, so we’re closely following BTC’s price action.
ETH has tapped into the Weekly Fair Value Gap, which is a key level for me.
We may see a bounce from here.
📌 Technical Outlook & Game Plan:
I expect to see another low on ETH before we go up — as I’m also anticipating one more leg down on Bitcoin.
So I’ll wait for a final bearish expansion and a trap for late sellers before positioning for longs.
After that, I want to see price closing above the purple line at $3500.
🎯 Setup Trigger:
A candle close above the $3500 level will be my signal to look for long setups.
📋 Trade Management:
Stoploss: Below the swing low that breaks above $3500
Take Profit: Targeting $3870, but will trail and lock in aggressively in case of deeper downside expansion.
💬 Like, follow, and comment if this breakdown supports your trading! More setups and market insights coming soon — stay connected!

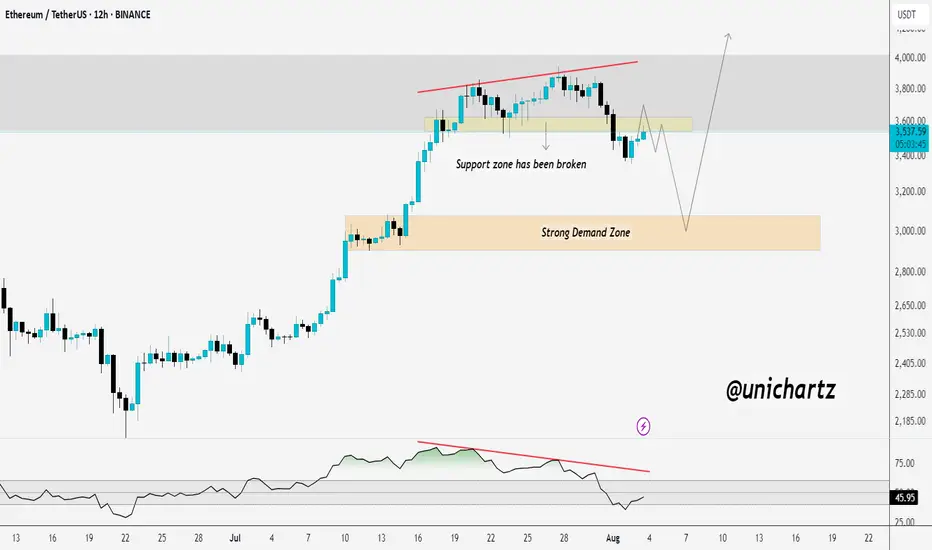
Breakdown Confirmed? ETH Could Drag Alts LowerCRYPTOCAP:ETH support zone around $3,560 has been broken, and current price action appears to be a retest of the breakdown. If ETH fails to reclaim this level, we could see further downside toward the strong demand zone near $3,000.
The RSI bearish divergence also adds to the bearish bias. If this retest fails, altcoins may face deeper corrections, as ETH often leads the market.
DYOR, NFA