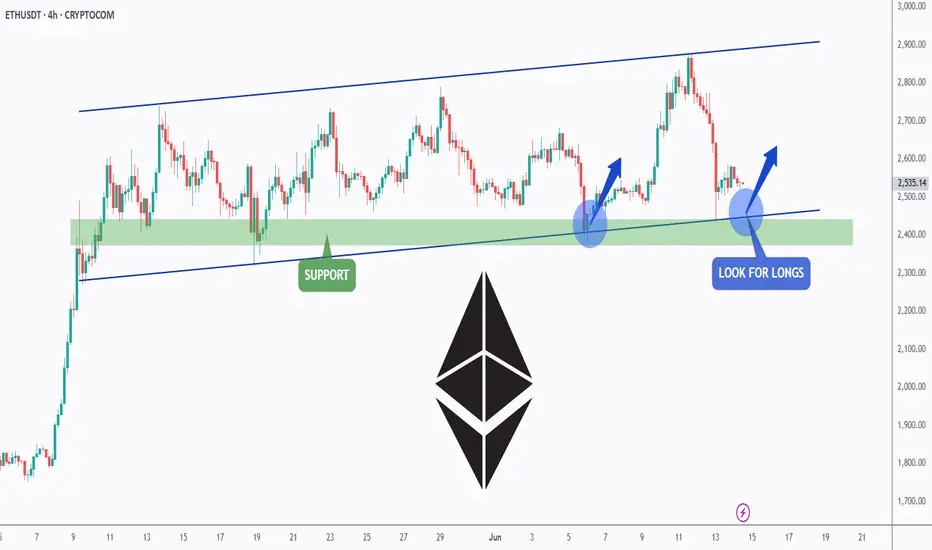
ETH is doing it AGAIN!Hello TradingView Family / Fellow Traders. This is Richard, also known as theSignalyst.
📈ETH has been overall bullish trading within the flat rising channels marked in blue.
Moreover, the green zone is a strong support zone!
🏹 Thus, the highlighted blue circle is a strong area to look for buy
ETH - Medium-Term Bulls Confirmed Control!Hello TradingView Family / Fellow Traders. This is Richard, also known as theSignalyst.
📈 As per our previous ETH analysis (shown on the chart), ETH rejected the green support zone and pushed higher, reaching our target near $2,750.
What’s next?
After breaking above the $2,750 structure marked

Bitcoin's Price Action Reveals A Bearish Ethereum—Back To BasicsBitcoin is bearish, top confirmed; we know Ethereum and Bitcoin move together in the exact same way. This means that Ethereum will also move lower.
Here we have a higher high but lacking strength, volume is dropping. There will be a continuation of the retrace.
Consider waiting (SHORT) until after

ETH Bullish Setup: Pullback to 200_SMA(D) May Launch Next Rally Ethereum ( BINANCE:ETHUSDT ) seems to have finally managed to break the Resistance lines and the 200_SMA(Daily) in the fifth attack . However, the number of Resistance lines inside the Heavy Resistance zone($2,929_$2,652) is high, and Ethereum will find it difficult to break through them.

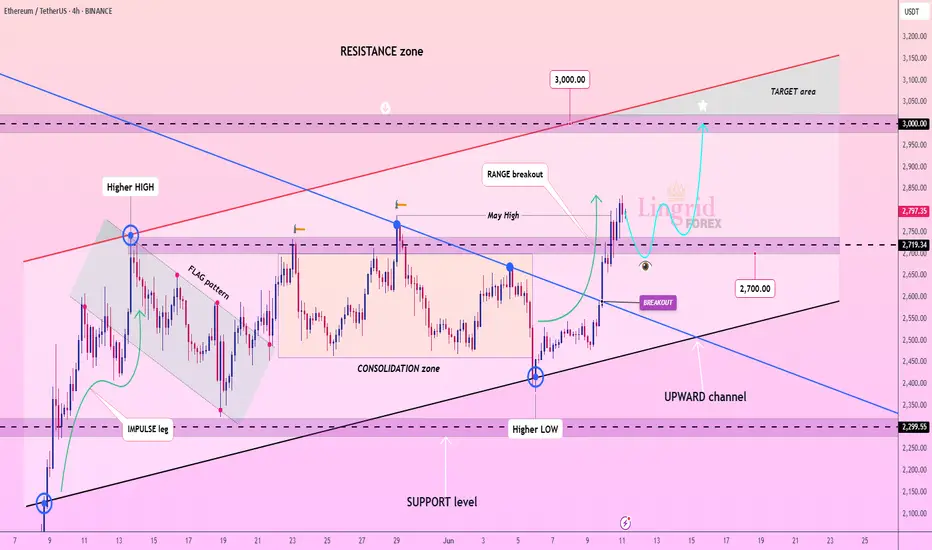
Lingrid | ETHUSDT May High Test - Continuation SetupThe price perfectly fulfilled my last idea . BINANCE:ETHUSDT has broken out of a long-standing consolidation zone and is now retesting the breakout area near 2719, which aligns with the May high and the downward trendline. Price is maintaining its position above the upward channel, showing a bull
Bitcoin Or Gold? Real Safe Haven In Middle East tension When the world shakes, where does money go— Bitcoin or gold ?
You may think crypto is the ultimate safe haven… but data tells a different story.
This breakdown compares digital dreams vs. physical trust —with charts, tools, and the psychology behind every move.
Hello✌
Spend 3 minutes ⏰ reading t

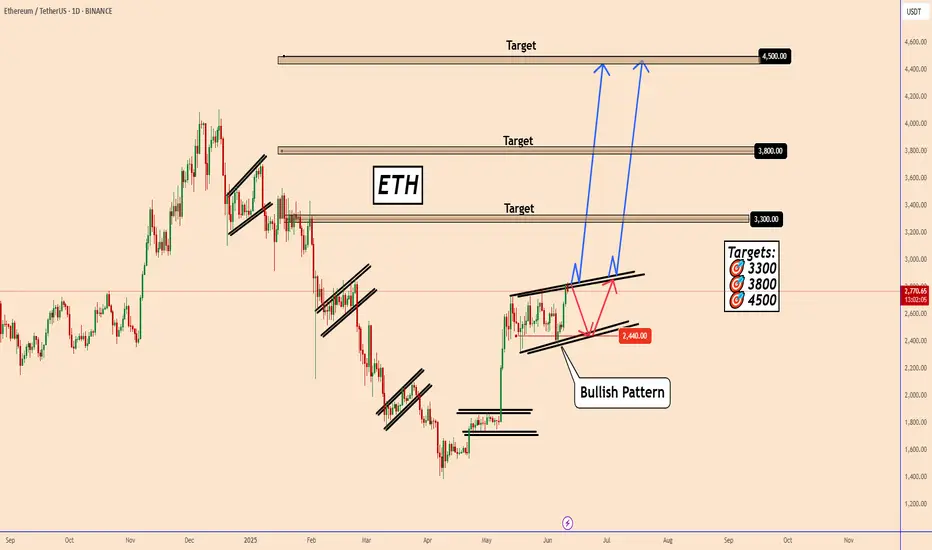
ETH: Bullish Momentum Emerging on the Daily ChartETH: Bullish Momentum Emerging on the Daily Chart
Since May 9, ETH has been consolidating for about a month, forming a bullish pattern. The price continues to fluctuate within the 2330 - 2800 range.
While the pattern appears bullish, it remains unclear whether it has fully completed. Without a de
Ethereum's Price Action Reveals A Bullish Bitcoin, $8,513 Next!The strongest possible bullish signal has been confirmed. Ethereum just moved daily above MA200. This is the first time this happens coming from a low point since November 2024, this is massive.
This signal reveals two things: (1) Bitcoin is bullish and set to continue growing. You've never seen Bi

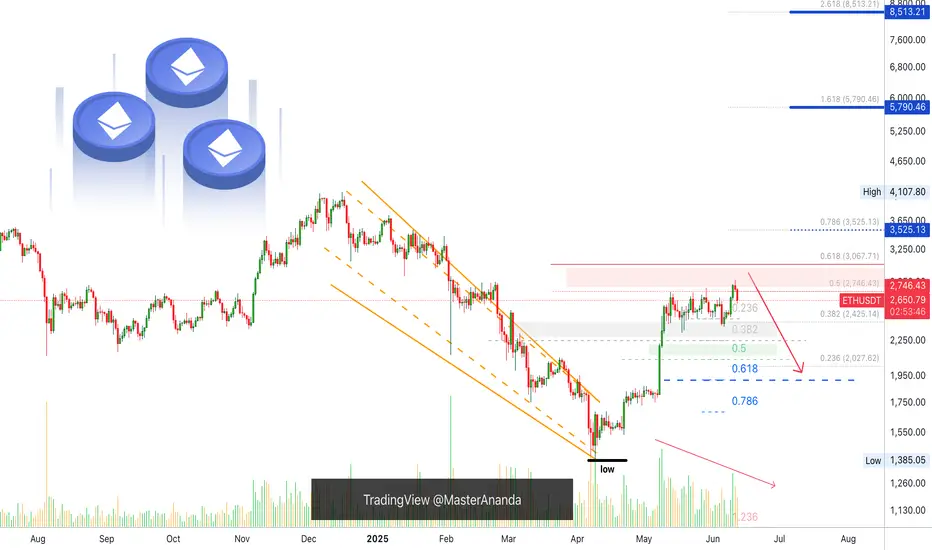
Ethereum Set To Continue Lower, How Long?The drop is now confirmed and yet, it is still early...
Good afternoon my fellow traders, all is good when we consider the chart, Ethereum's price and the bigger picture, nothing changes. But we are witnessing a retrace. This retrace will end in a higher low and I am thinking of time now, duration.
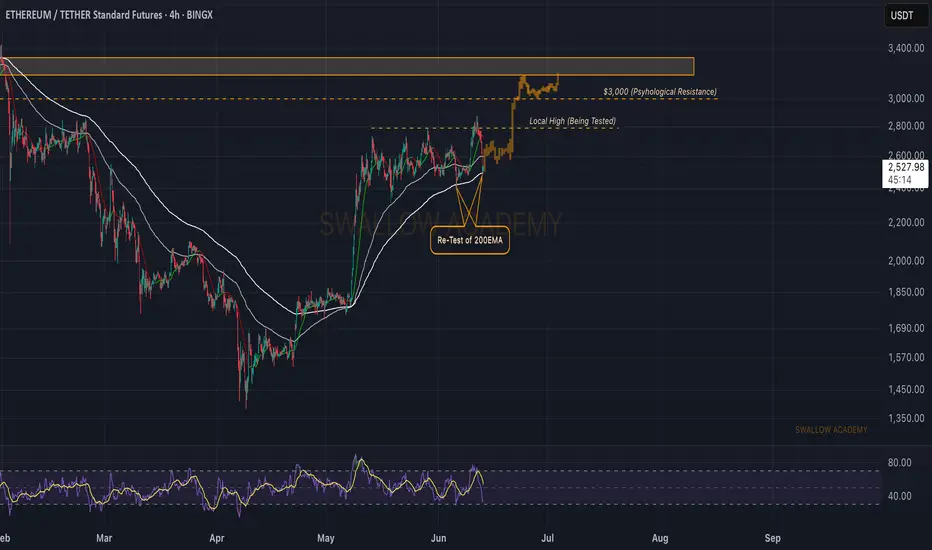
Ethereum (ETH): Back at 200EMA | Buyers Trying To Gain Control A strong selloff happened recently, which led the price to the 200EMA line, where, similar to last time we touched that area, we are seeing some kind of bullish overtake happening.
Now, as markets are very unpredictable currently, we are looking for a full buyside takeover to happen near the curre
See all ideas
Summarizing what the indicators are suggesting.
Oscillators
Neutral
SellBuy
Strong sellStrong buy
Strong sellSellNeutralBuyStrong buy
Oscillators
Neutral
SellBuy
Strong sellStrong buy
Strong sellSellNeutralBuyStrong buy
Summary
Neutral
SellBuy
Strong sellStrong buy
Strong sellSellNeutralBuyStrong buy
Summary
Neutral
SellBuy
Strong sellStrong buy
Strong sellSellNeutralBuyStrong buy
Summary
Neutral
SellBuy
Strong sellStrong buy
Strong sellSellNeutralBuyStrong buy
Moving Averages
Neutral
SellBuy
Strong sellStrong buy
Strong sellSellNeutralBuyStrong buy
Moving Averages
Neutral
SellBuy
Strong sellStrong buy
Strong sellSellNeutralBuyStrong buy
Displays a symbol's price movements over previous years to identify recurring trends.