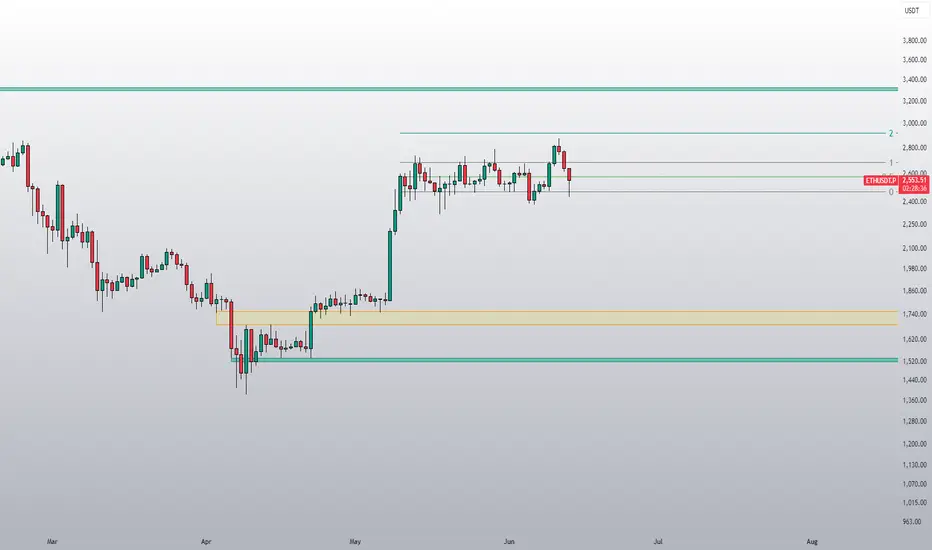
ETH is doing it AGAIN!Hello TradingView Family / Fellow Traders. This is Richard, also known as theSignalyst.
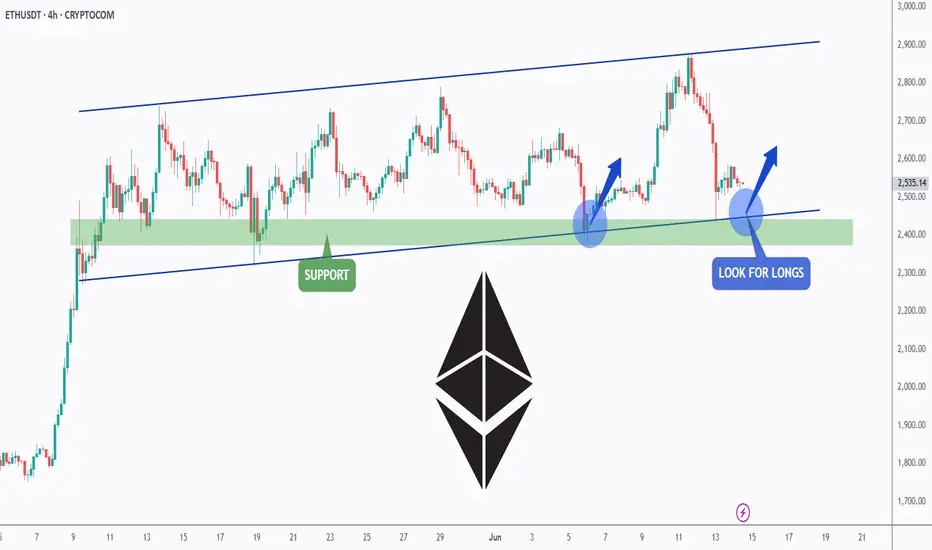
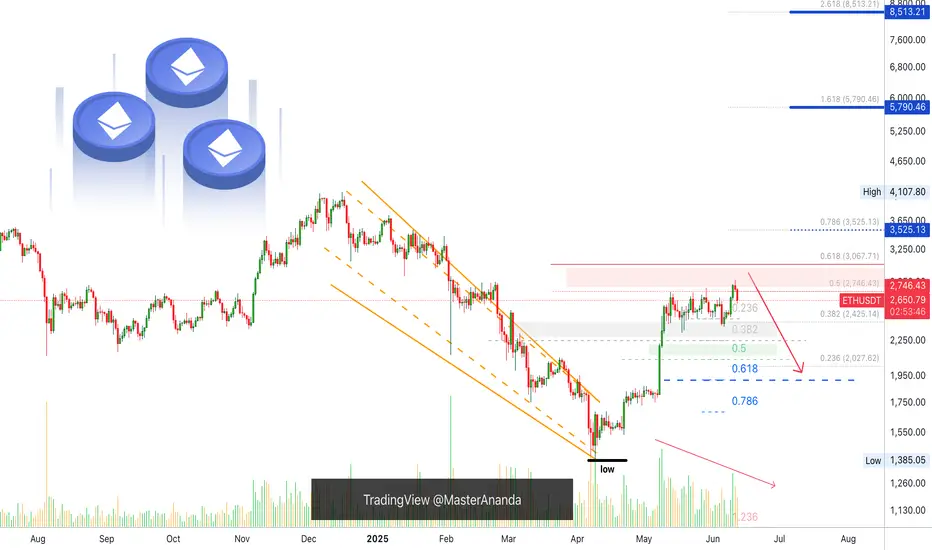
📈ETH has been overall bullish trading within the flat rising channels marked in blue.
Moreover, the green zone is a strong support zone!
🏹 Thus, the highlighted blue circle is a strong area to look for buy setups as it is the intersection of support and lower blue trendlines acting as non-horizontal support.
📚 As per my trading style:
As #ETH approaches the blue circle zone, I will be looking for bullish reversal setups (like a double bottom pattern, trendline break , and so on...)
📚 Always follow your trading plan regarding entry, risk management, and trade management.
Good luck!
All Strategies Are Good; If Managed Properly!
~Rich
ETHUSDT.PS trade ideas
ETH - Medium-Term Bulls Confirmed Control!Hello TradingView Family / Fellow Traders. This is Richard, also known as theSignalyst.
📈 As per our previous ETH analysis (shown on the chart), ETH rejected the green support zone and pushed higher, reaching our target near $2,750.
What’s next?
After breaking above the $2,750 structure marked in red, the bulls have confirmed medium-term control.
🏹 As long as the last major low at $2,700 holds, ETH is expected to remain bullish, with a potential move toward the $3,500 resistance zone.
📚 Always follow your trading plan regarding entry, risk management, and trade management.
Good luck!
All Strategies Are Good; If Managed Properly!
~Rich

Bitcoin's Price Action Reveals A Bearish Ethereum—Back To BasicsBitcoin is bearish, top confirmed; we know Ethereum and Bitcoin move together in the exact same way. This means that Ethereum will also move lower.
Here we have a higher high but lacking strength, volume is dropping. There will be a continuation of the retrace.
Consider waiting (SHORT) until after the FED decision result. The market can remain slightly bearish until after the event. The drop will open the doors for new entry prices. Market conditions can always change.
We are live with a 20X SHORT on Bitcoin, Ethereum will do the same. Just a small drop (can be a strong drop) ending in a higher low followed by a new wave of growth. Not all charts/pairs/projects are the same. Some will move down while others move up. Sell at resistance, buy at support.
Namaste.

Bitcoin Or Gold? Real Safe Haven In Middle East tension When the world shakes, where does money go— Bitcoin or gold ?
You may think crypto is the ultimate safe haven… but data tells a different story.
This breakdown compares digital dreams vs. physical trust —with charts, tools, and the psychology behind every move.
Hello✌
Spend 3 minutes ⏰ reading this educational material.
🎯 Analytical Insight on Bitcoin:
Contrary to common expectations, Bitcoin has shown relative resilience amid recent geopolitical tensions, refraining from a sharp sell-off.
This price behavior signals a potential shift in market psychology—something I’ll explore further in an upcoming educational post.
Based on my previous analyses, I continue to anticipate an upward breakout above the $110K resistance zone in the current structure.
Now , let's dive into the educational section,
📌 Gold: The Legacy of Trust
For thousands of years, gold has been the go-to safe asset. In wars, inflation, sanctions, and crashes—it remains the mental anchor of value. Tangible, historic, and out of government control.
🪙 Bitcoin: Revolutionary but Unstable
Bitcoin promises freedom, decentralization, and anti-inflation. But during actual crises, trust wavers. High volatility, regulatory risk, and lack of a long history make investors hesitate when fear hits hard.
🛠️ TradingView Tools That Reveal Where Smart Money Flows
One reason TradingView stands out is its wide set of tools that help you track market psychology—not just price action. When it comes to analyzing the Bitcoin-vs-Gold battle during global crises (like the Iran-Israel war), these tools are essential:
Correlation Coefficient: This shows how closely BTC and gold move together. In panic moments, it helps reveal where the real trust is flowing.
On-Balance Volume (OBV): Key for spotting where big money is headed. If OBV on gold rises while BTC’s falls, smart money isn’t betting on crypto just yet.
Fear & Greed Index Logic (DIY): While not a native TradingView tool, you can mimic it by combining volatility and volume indicators to reflect market emotion.
Overlay XAUUSD and BTCUSD: Place both on a single chart with “percentage scale” enabled. You’ll see exactly which one holds up better during chaos.
Marking Geo-Political Events: Tag key events (like missile strikes or sanctions) on your charts. Track how Bitcoin and gold react immediately after.
📊 How Investors React in Crisis
During events like an Iran-Israel war, data shows money often flows into gold—not BTC. When panic peaks, people run toward the “known,” not the “new.”
🧠 The Illusion of Crypto as Safe Haven
We want to believe BTC is the new gold. But the human mind—under threat—defaults to ancient instincts. Fear doesn’t innovate. It runs to what it knows: shiny, physical, historical gold.
💡 When Will Bitcoin Truly Compete?
When the next generation fully embraces digital assets. When institutions store BTC alongside gold. When BTC no longer crashes on scary headlines—that’s when the shift becomes real.
⚠️ Lessons from War
Wars reveal that markets don’t behave rationally in fear. Even if Bitcoin makes sense on paper, emotion drives flows. Right now, that flow still favors gold.
🔍 What to Watch Next
If, during a future conflict, Bitcoin drops less—or even rises while gold does—you may be witnessing a turning point. Until then, keep tracking both with your TradingView setups.
🧭 Final Takeaway
Gold still owns the trust game in a crisis. Bitcoin is on its way but hasn’t crossed that psychological line. If you’re a smart trader, know how to read both—and move before the herd does.
✨ Need a little love!
We put so much love and time into bringing you useful content & your support truly keeps us going. don’t be shy—drop a comment below. We’d love to hear from you! 💛
Big thanks,
Mad Whale 🐋
📜Please remember to do your own research before making any investment decisions. Also, don’t forget to check the disclaimer at the bottom of each post for more details.

ETH Bullish Setup: Pullback to 200_SMA(D) May Launch Next Rally Ethereum ( BINANCE:ETHUSDT ) seems to have finally managed to break the Resistance lines and the 200_SMA(Daily) in the fifth attack . However, the number of Resistance lines inside the Heavy Resistance zone($2,929_$2,652) is high, and Ethereum will find it difficult to break through them.
In terms of Elliott Wave theory , it seems that Ethereum is completing microwave 4 , and we should wait for this wave to complete. Microwave 4 could act as a pullback to the resistance lines and 200_SMA(Daily) .
I expect Ethereum to start rising from the Support zone($2,745_$2,650) again and rise to at least the Potential Reversal Zone(PRZ) .
Note: If Ethereum touches $2,537 , we can expect further declines.
Please respect each other's ideas and express them politely if you agree or disagree.
Ethereum Analyze (ETHUSDT), 1-hour time frame.
Be sure to follow the updated ideas.
Do not forget to put a Stop loss for your positions (For every position you want to open).
Please follow your strategy and updates; this is just my Idea, and I will gladly see your ideas in this post.
Please do not forget the ✅' like '✅ button 🙏😊 & Share it with your friends; thanks, and Trade safe.

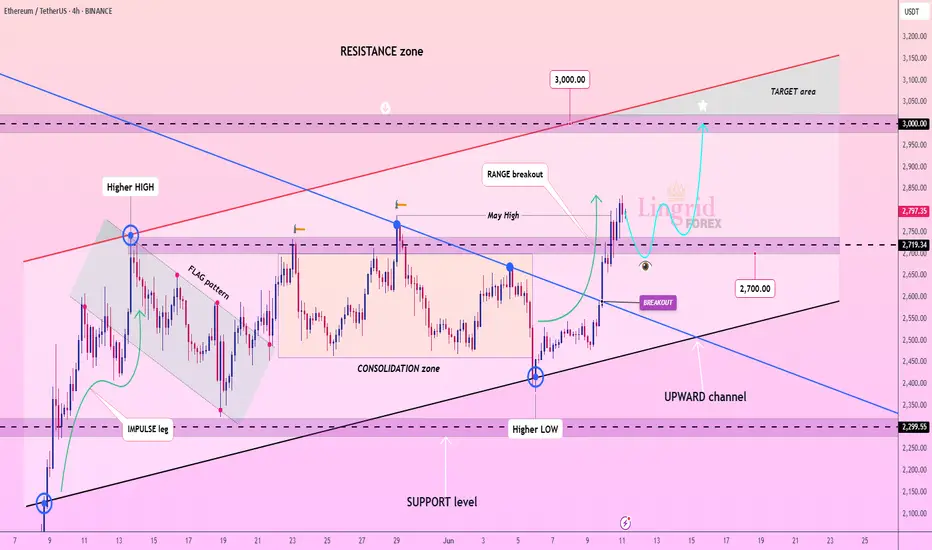
Lingrid | ETHUSDT May High Test - Continuation SetupThe price perfectly fulfilled my last idea . BINANCE:ETHUSDT has broken out of a long-standing consolidation zone and is now retesting the breakout area near 2719, which aligns with the May high and the downward trendline. Price is maintaining its position above the upward channel, showing a bullish structure with potential for continuation. A successful retest here may launch the next leg toward the 3000 resistance.
📈 Key Levels
Buy zone: 2680–2720
Buy trigger: bounce from 2719 with bullish engulfing
Target: 3000
Sell trigger: drop back below 2680
💡 Risks
Failure to hold the breakout could trap longs
Low volume during retest increases breakdown chances
3000 psychological resistance may cause premature rejection
Traders, if you liked this idea or if you have your own opinion about it, write in the comments. I will be glad 👩💻
ETH: Bullish Momentum Emerging on the Daily ChartETH: Bullish Momentum Emerging on the Daily Chart
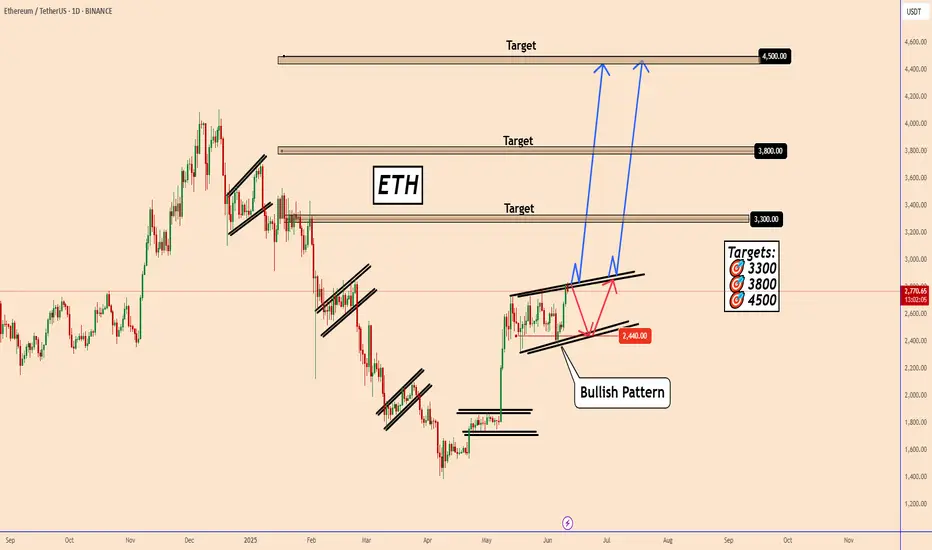
Since May 9, ETH has been consolidating for about a month, forming a bullish pattern. The price continues to fluctuate within the 2330 - 2800 range.
While the pattern appears bullish, it remains unclear whether it has fully completed. Without a decisive breakout accompanied by strong bullish volume, ETH could retreat to 2440, potentially forming a larger structure before resuming its upward move.
The broader outlook still suggests bullish momentum, but the market is not yet ready to initiate the next leg up.
Today's U.S.-China agreement and U.S. CPI data will be key events to watch.
Key Target Zones: 🎯 3300 🎯 3800 🎯
You may find more details in the chart!
Thank you and Good Luck!
❤️PS: Please support with a like or comment if you find this analysis useful for your trading day❤️
Ethereum's Price Action Reveals A Bullish Bitcoin, $8,513 Next!The strongest possible bullish signal has been confirmed. Ethereum just moved daily above MA200. This is the first time this happens coming from a low point since November 2024, this is massive.
This signal reveals two things: (1) Bitcoin is bullish and set to continue growing. You've never seen Bitcoin and Ethereum going in different directions. If Ethereum is set to continue up, Bitcoin will also do the same. The market is one. (2) Ethereum is now ready to grow for 6 months straight, minimum, and this opens the doors for $5,790 followed by $8,513 in this bullish wave. There can be more of course.
This is one of the strongest signals (MA200) but also one of the easiest to spot. It works with high accuracy, never fails. The market is bullish when the action happens above this indicator long-term.
So now you know, for sure—for certain, what will happen next. Knowing that Ethereum will be trading above $5,000 soon, how are you going to maximize profits from this knowledge? Do what it takes to increase your profits and trading success. This is the opportunity of a lifetime, it can be life changing.
Thank you for reading.
I am wishing you tons of profits, great luck and amazing success.
Namaste.

Ethereum Set To Continue Lower, How Long?The drop is now confirmed and yet, it is still early...
Good afternoon my fellow traders, all is good when we consider the chart, Ethereum's price and the bigger picture, nothing changes. But we are witnessing a retrace. This retrace will end in a higher low and I am thinking of time now, duration.
Initially I was thinking about the Fed meeting and this event being the catalyst for change, but the Cryptocurrency market is following its own cycle and for it to be super bullish later this year, all bearish action, all weak hands, needs to be removed now, today.
So the bearish action can fluctuate between just a few days, 3-5 days, to 1-2 weeks. That's my analysis based on past history, chart data and experience.
The retrace might not last that long though, market conditions continue to improve and Ethereum might not produce a lower low compared to Bitcoin. Bitcoin is trading pretty high and a correction can develop any day. Since Ethereum is already low compared to its ATH, there is less room for prices to move lower, makes sense?
The downside is always limited, SHORTing is riskier than going LONG. It is wise to wait for a new entry before buying more. Experienced traders are recommended to SHORT. This chart setup will change in a matter of days, and then the market will turn bullish again, long-term.
Thank you for reading.
Namaste.
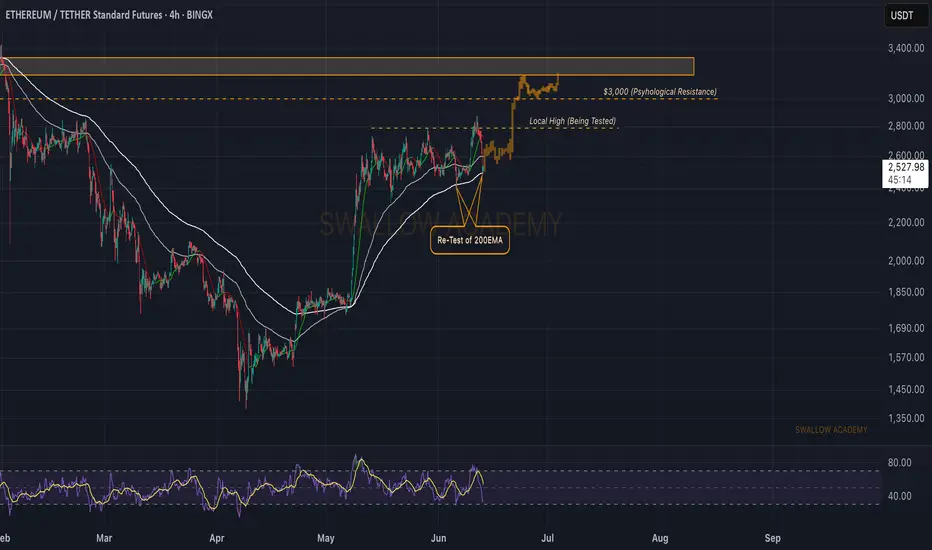
Ethereum (ETH): Back at 200EMA | Buyers Trying To Gain Control A strong selloff happened recently, which led the price to the 200EMA line, where, similar to last time we touched that area, we are seeing some kind of bullish overtake happening.
Now, as markets are very unpredictable currently, we are looking for a full buyside takeover to happen near the current zone, which would then mean that our game plan will remain the same: movement to $3000.
Now, if sellers continue to show dominance, we might be seeing a very nasty drop from here so keep your eyes wide open at the 200EMA line.
Swallow Academy
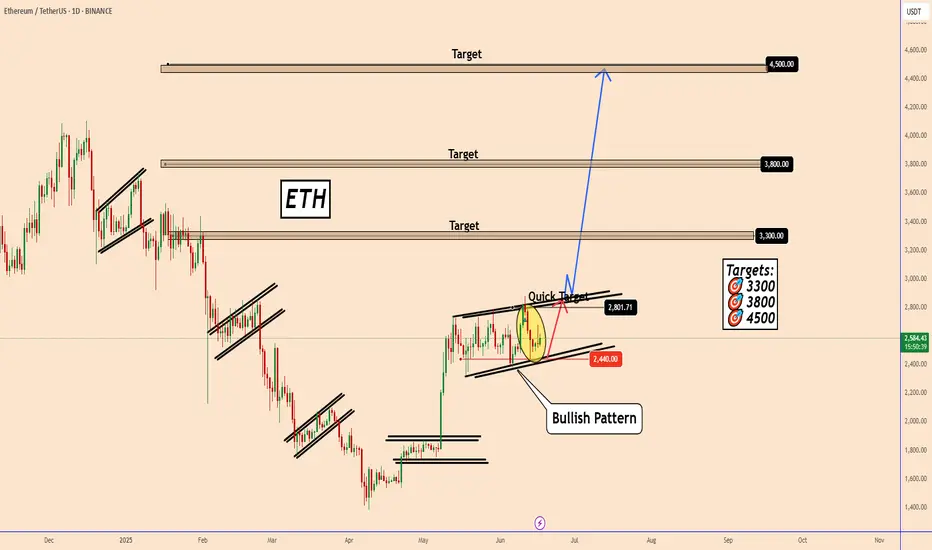
Ethereum: Is a Major Bullish Wave Coming?Ethereum: Is a Major Bullish Wave Coming?
Following our previous analysis, ETH dropped from $2,770 to $2,440, aligning with one of the anticipated price scenarios.
The support zone near $2,440 once again demonstrated its strength, pushing the price back up to $2,660. Given the strong accumulation pattern, the likelihood of a larger bullish wave is increasing.
A quick target for the current move stands near $2,800, and a breakout above the pattern could signal the start of the expected bullish trend, with the following key targets:
🎯 $3,300 🎯 $3,800 🎯 $4,500
You may find more details in the chart!
Thank you and Good Luck!
❤️PS: Please support with a like or comment if you find this analysis useful for your trading day❤️
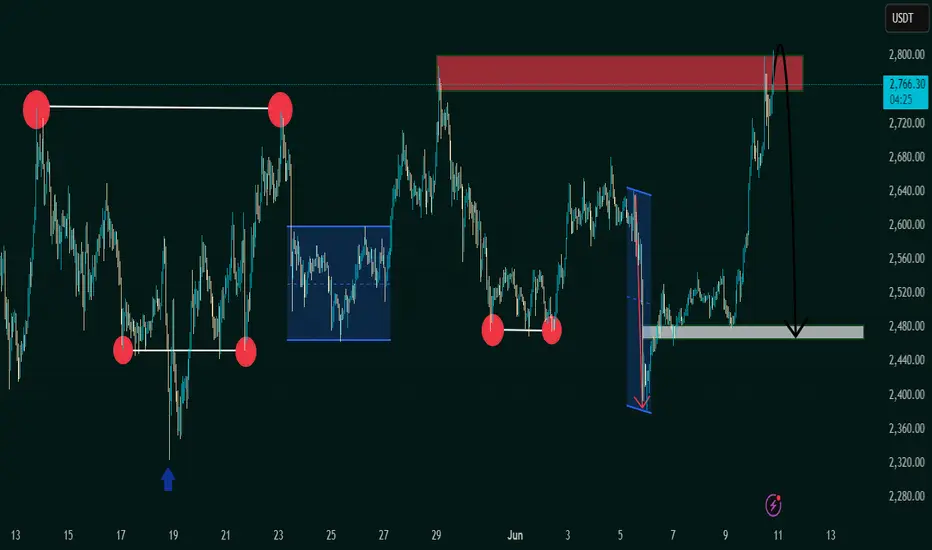
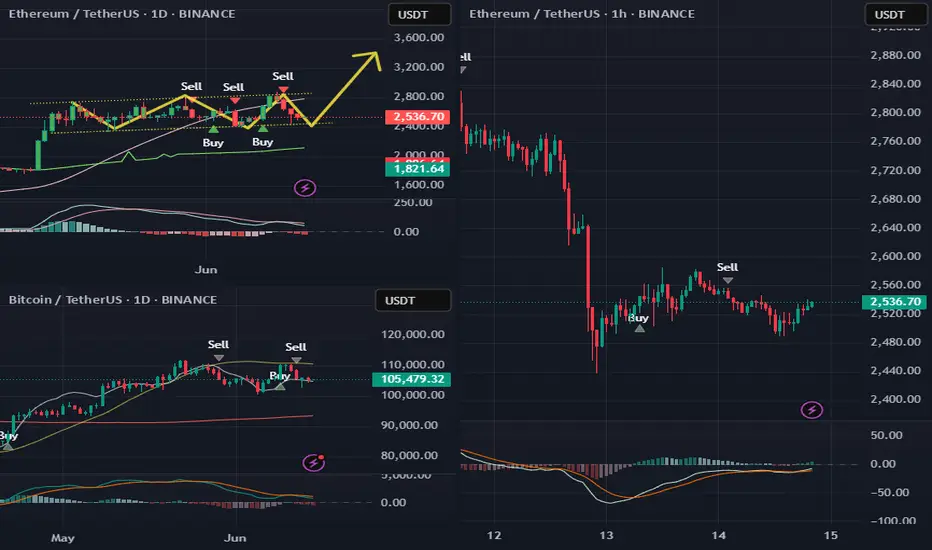
"Bearish Reversal Opportunity Following Supply Zone Rejection"1. Double Top Formation (Resistance Level Identified)
The chart displays a clear double top structure at the 2,760–2,800 USDT level.
This level has acted as a strong supply zone (highlighted in red), where price previously reversed, indicating heavy selling interest.
Current price action has retested this resistance zone and shown signs of rejection.
2. Liquidity Sweeps & False Breakouts
On the left side of the chart, an aggressive downward wick (marked with a blue arrow) suggests a liquidity sweep below a key low before strong bullish momentum returned.
This type of price action indicates smart money involvement, designed to remove weak hands before pushing price higher.
3. Accumulation Phases (Sideways Consolidation)
Multiple accumulation ranges are highlighted with blue rectangles.
These ranges show horizontal consolidation, where price builds up energy before breakout.
The most recent breakout led to a vertical rally toward the resistance zone, signaling an end of the accumulation and a start of distribution.
4. Double Bottom Support Structure
Identified near the 2,480 level, marked by red circles.
This level has historically acted as demand/support, evidenced by multiple bounces from this price zone.
Now highlighted with a grey zone, it is projected to act as the next key support area.
5. Bearish Projection
A large black arrow suggests a forecasted bearish move from the current high (~2,800) back to the support zone (~2,480).
This aligns with the idea of a mean reversion or pullback after a strong bullish impulse.
---
Conclusion & Trade Idea:
🔻 Bias: Bearish (Short-term)
The chart presents a classic reversal pattern with a double top at a well-defined supply zone.
Entry could be considered after confirmation of rejection from this level.
🧠 Trade Plan Suggestion:
Entry: Short near 2,780–2,800 after bearish confirmation (e.g., bearish engulfing candle or break of structure).
Target: 2,480 (support zone).
Stop Loss: Above 2,820 (recent high).
Risk-Reward: Approximately 1:2.5 or better depending on execution.
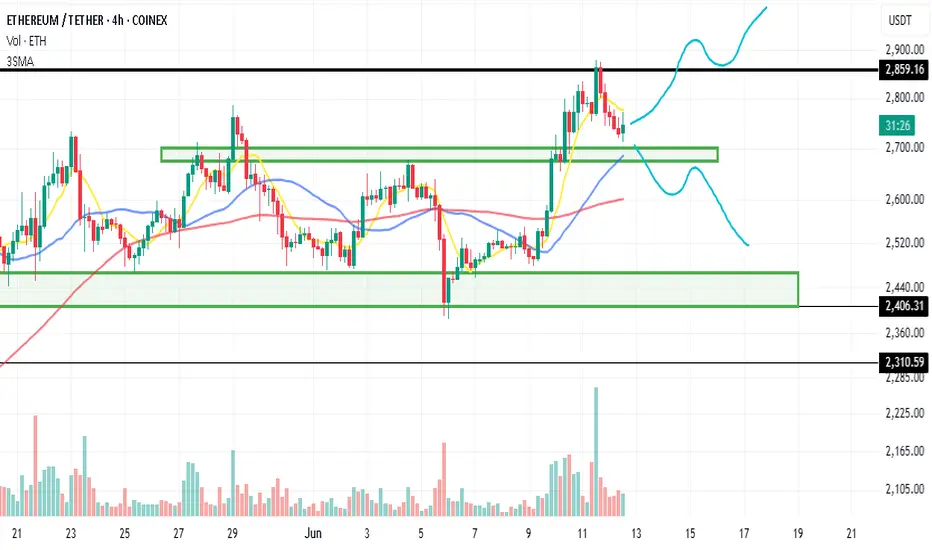
ETH long chanceHello everyone...
Welcome to my channel!
If you liked the analysis below, hit the rocket button.
Let's dive into the Ethereum analysis on the 4-hour time frame.
What are we waiting for right now?
We are waiting for the 2874 level to break with good volume, so we can enter a long position with proper risk management. It is worth noting that there is a chance of a fake-out, so either use a large stop-loss below the 2310 level, or a smaller stop-loss with a small risk-to-reward ratio. If you're using a smaller stop, make sure to lock in profits sooner.
The green boxes you see in the image indicate the strong presence of buying makers who have established solid support in these areas. If the buyers fail at the 2700 area, we may need to focus more on the bearish scenario.
Hitting the rocket and sharing your comments motivates me.
Stay profitable!
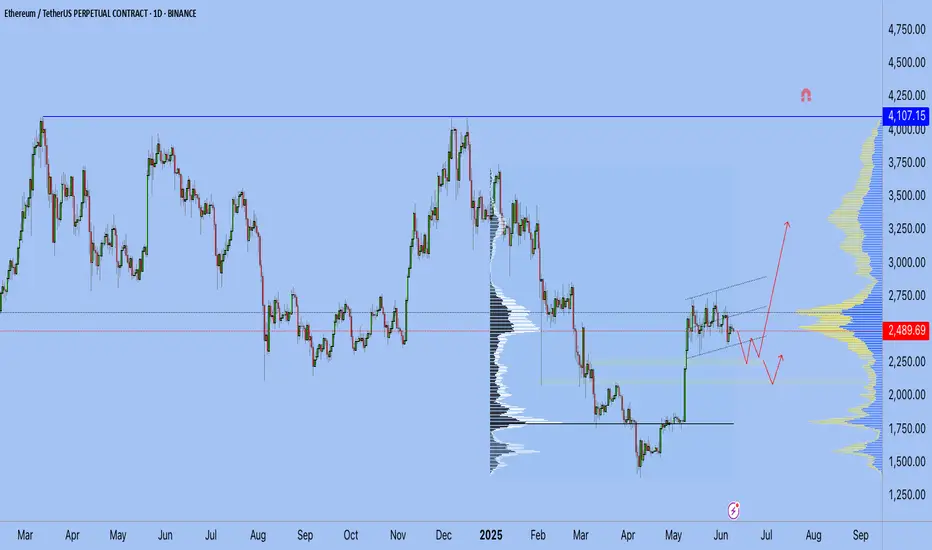
ETH update 9.06.2025Hello everyone, many of you asked me to publish my vision for ETH.
Here you go!
I believe that the previous impulse movement was only the first upward movement, and now we are in a sideways correction movement — call it what you will, but the fact is that the exit from this flat will be upward.
1. End of the year
2. ETH is accumulating on the Onchain
3. Liquidity overflow from BTC can be seen on the ETHBTC chart, and the overflow began at the very bottom
4. What else can large conservative players accumulate?
5. We are going after liquidity from above and should break 4100 by September
Best Regards EXCAVO
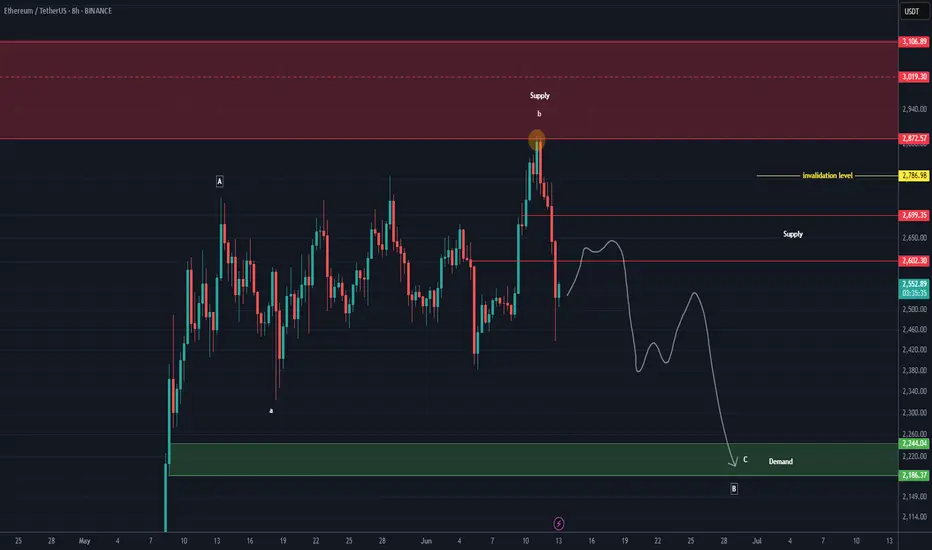
ETH NEW UPDATE (8H)This analysis is an update of the analysis you see in the "Related publications" section
After the pump and hitting the red zone, it got rejected.
It's better not to open a short position on Ethereum, as its dominance appears bullish | which means it might be resilient against a potential drop.
The closing of a daily candle above the invalidation level will invalidate this analysis.
For risk management, please don't forget stop loss and capital management
Comment if you have any questions
Thank You
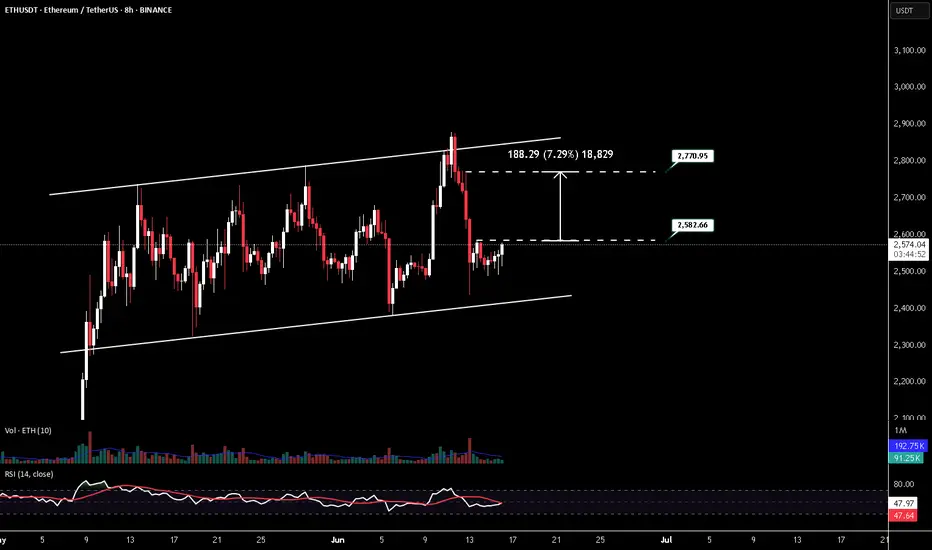
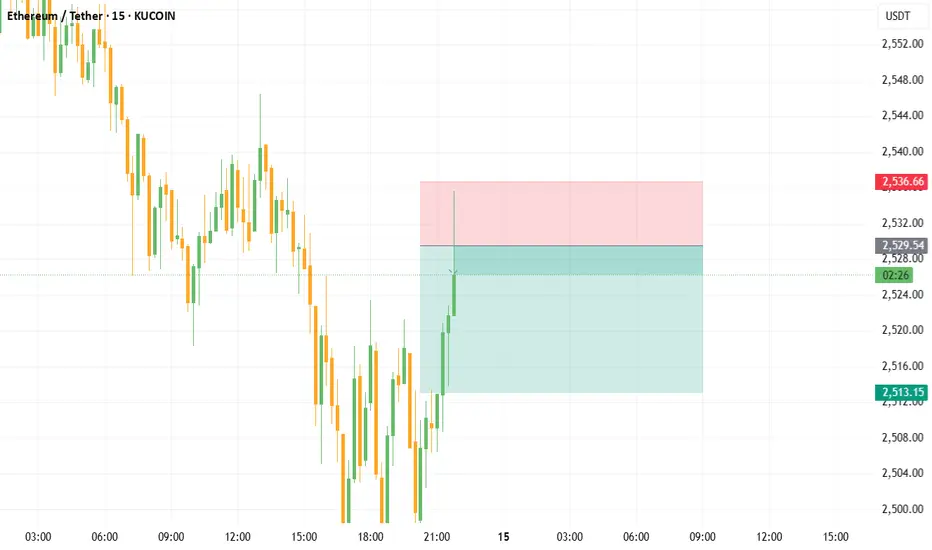
ETHUSDT LONG POSITION ENTRY: 2582.66
TAKE PROFİT : 2770.95
STOP LOSS : 1/3
Do not use high leverage!
Remember cash management (planning)!
Please follow the stop-loss rule!
Ethereum (ETH) is still looking bullish"Spring" breakout, retest of the range low. Textbook price action on ETH!
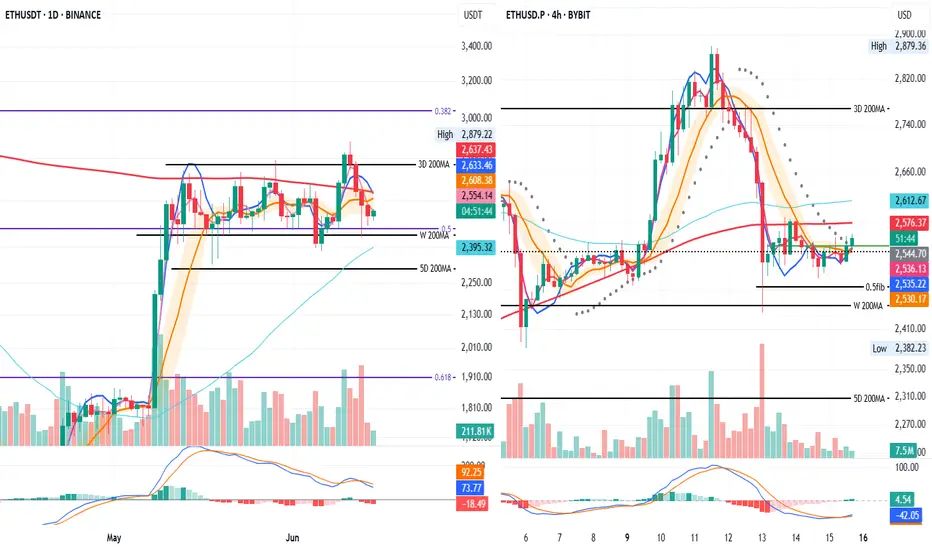
Daily vs 4H: Mixed Signals, Clear BounceOn both the 1D and 4H timeframes, price is still below the 200MA.
On the daily chart, it's also trading under the BB center line, the SMA, and the MLR.
However, on the 4H chart, price is now above the BB center line, SMA, and MLR — and it’s not far from triggering a long entry signal.
On the daily, we’ve seen a bounce from strong support: the 0.5 Fib level and the 200-week MA.
On the 4H, price looks ready to close above the last daily close — a promising sign.
Always take profits and manage risk.
Interaction is welcome.
ETH/USDT Scalping Signal of the DayDirection: Empty
Entry Range: 2523 ~ 2528
Take Profit Target: 2508, 2501
$ETHUSDT finally ready to break out of weekly range and rally!!!BINANCE:ETHUSDT seems to be ready to break out of its range that has lasted for over a month. So if it properly breaks out from this range and retests the resistance zone which tends to turn to support zone afterwards, it will likely head to the next resistance zone around $4000.
Kindly support this post to help reach other people and do comment your thoughts about the setup.

ETH rang is being respected. ETH is holding strong within range. As long as the price stays in range, a bullish bias is supported. If the price breaks below, there is a volume gap sub 2k. Be ready with the plan.
Full TA: Link in the bio
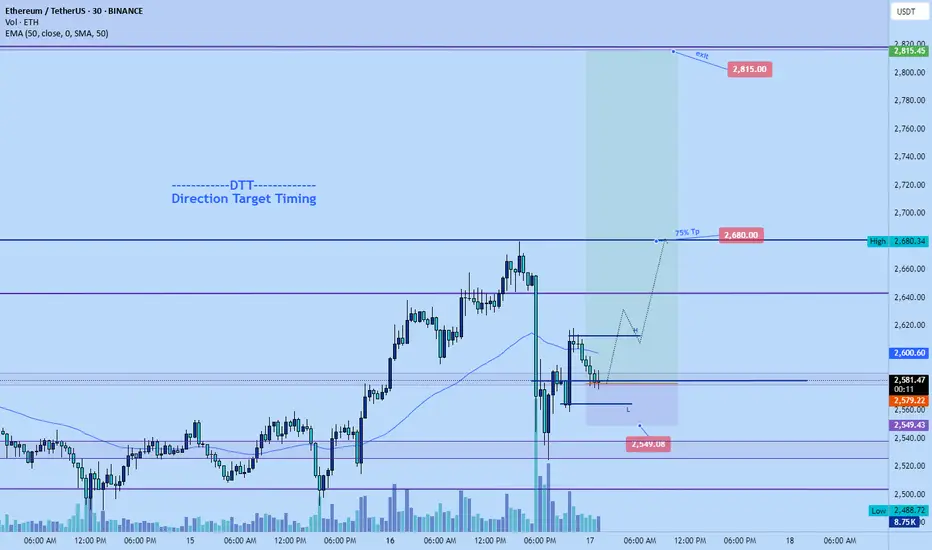
ETh pump today back to $2680Opened a long position on ETH. Anticipating a pump back up to the highs of $2680, $2815 if breaks out impulsively.
Stop: $2549.08 or lower