Ethereum (ETH/USDT) Technical Analysis | Retest or Rejection?Ethereum (ETH/USDT) Technical Analysis | Retest or Rejection? The Market Decides
As shown in the 30-minute chart, Ethereum recently broke below the key support at $2,531, entering a short-term bearish phase. After the sell-off, ETH is now in a retracement move and testing the descending trendline from below — a critical decision point for the next move.
🟢 Bullish Scenario: Breakout and Recovery Ahead
If ETH can break above the descending trendline with strong bullish momentum, the next resistance levels to watch are:
$2,531 – the previous support turned resistance
$2,573 – the next major resistance, which could trigger further upside
A confirmed breakout above these levels could shift short-term momentum back in favor of the bulls.
🔻 Bearish Scenario: Rejection and Continuation of the Downtrend
If ETH fails to break the trendline and gets rejected, we may see a new leg down. In that case, keep an eye on these key support levels:
$2,484 – short-term support
$2,453 – local support with multiple recent reactions
$2,393 – a major support zone and potential bounce area
📌 Conclusion
Ethereum is at a technical crossroads. A clean breakout or a sharp rejection from this trendline could define the next major move. Traders should watch for clear candlestick confirmations and volume spikes before taking action.
🚨 If you found this analysis helpful, smash that follow button! I post real-time charts, clean setups, and no-fluff insights to help you stay ahead of the market. Let’s grow together! 💥
ETHUSDT.PS trade ideas

ETH (plan in progress) — Setup Only Valid on ReclaimCRYPTOCAP:ETH is consolidating beneath key resistance at $2,738, failing to show bullish continuation. The current zone offers no valid long setup until structure confirms. Eyes remain on range low sweeps and reclaim triggers.
Plan:
✅ Main Long Trigger: Reclaim of $2,240–2,250 range low
• Must see price sweep and reclaim local lows or green SR
• No setup above current levels — wait for plan to trigger
• First target: $2,738
• Main target: $4,093
🟩 FVG Demand Zone (Ultimate Dip Buy): $2,080–1,800
Unlikely to tag, but if reached — high conviction buy zone.
🚫 Break Below $2,079 → increased risk of deeper drop
• Exit bias if structure breaks down below green zone
Summary:
Let the price come to the plan — no need to chase. Focus is on range low reclaim or FVG tag as entry catalysts. Don’t long mid-range without confirmation.
📌 Discipline is an edge — great entries come to those who wait.

Ethereum Trading Signal: Ready for a ReboundAsset: ETH/USDT
Direction: Long (Catching a Technical Rebound!)
Entry: 2500 USDT (For extra safety, wait for confirmation above 2505–2510 USDT)
Stop-loss: 2475 USDT (Just below key support—protect your capital!)
Take-profit:
Target 1: 2545 USDT (Right at the resistance cluster—first exit)
Target 2: 2580 USDT (Bulls’ next challenge and Bollinger Band top)
Confidence: Medium
🧐 Why?
After a strong downtrend, ETH hit a major support zone (2475–2490 USDT) and is showing signs of a technical bounce. RSI is flashing a bullish divergence, and the MACD looks ready to turn—classic setup for a short-term recovery!
🚦 Trading Plan:
Wait for price action to push above 2500–2510 USDT before jumping in.
Tight stop just below 2475 to manage risk.
Book profits at 2545 and ride the momentum to 2580 if bulls really come out to play!
✨ Pro Tip: This is a tactical “countertrend” play—quick in, quick out. If support fails, step aside and let the bears run.
Ready to ride the Ethereum bounce? Let’s catch this wave! 🌊🚀
#Ethereum #ETH #CryptoTrading #TradingSignal #BullishRebound #CryptoCommunity
Let me know if you want even more hype or a different style!

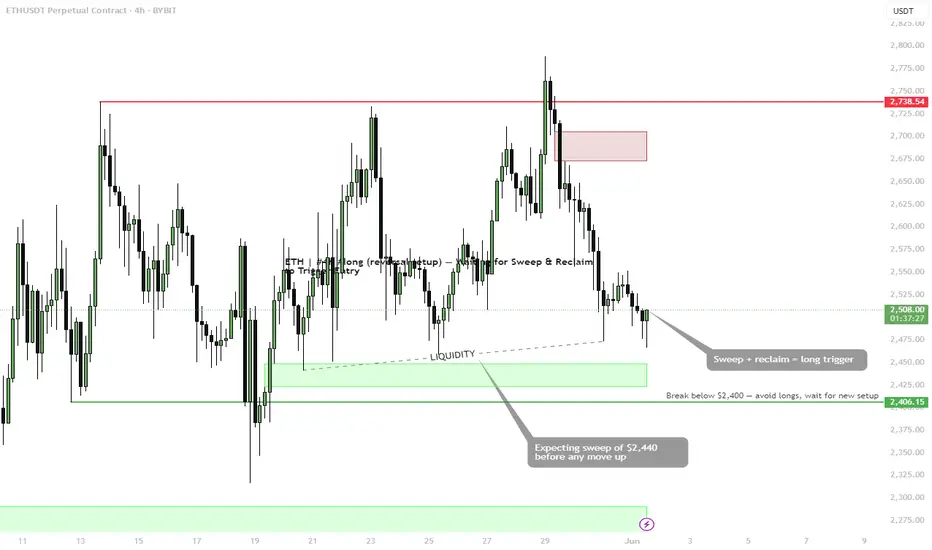
ETH | (reversal setup) — Waiting for Sweep & Reclaim to Trigger BINANCE:ETHUSDT is approaching a key liquidity pocket around $2,440, where multiple wicks have stacked. Price is likely to sweep this zone before any sustained move higher. The current plan favors waiting for the trap → then reacting.
Setup:
🟩 Trigger Zone: $2,440–2,400
• Expecting a sweep of $2,440
• Long setup only valid if price sweeps + reclaims on lower timeframe
• Break below $2,400 = invalidation, wait for new structure
🚫 No entry on first touch — avoid longs without a strong reclaim
🎯 Target Zone: $2,738+
First resistance comes from the H4 supply and the previous range high.
Plan:
• Monitor for liquidity grab and reclaim
• If structure holds — good R:R swing setup
• If not — stand aside, reassess at deeper levels
📌 Smart money needs liquidity. Let it sweep first — then strike.
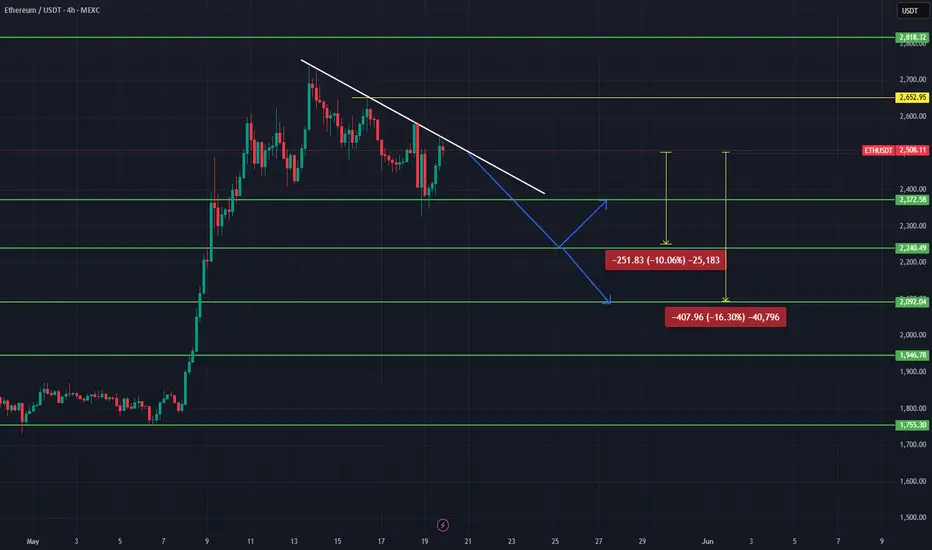
eth 4h
It seems that seller pressure will continue in ETH. As long as there are no closes above $2650, a downward movement towards the $2240 and $2100 levels can be expected.
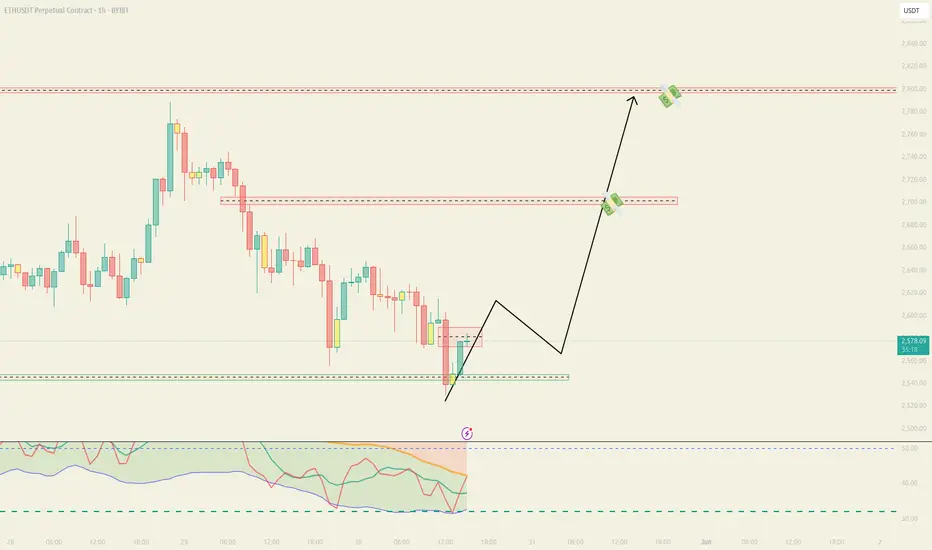
ETH isn’t done. It’s just hunting stops.This isn’t a dump. This is preparation.
ETH swept the low into the 0.786 retracement — right where liquidity was resting. The 1H chart shows an engineered drive down into 2,490.26, just above the final inefficiency at 2,474.00. That’s the last fill zone before repricing.
Look left — we’re now sitting at the tail end of a low-volume node. Price doesn’t stick here. It reacts.
I’m watching for a shift back into the 2,503–2,512 zone, where the 0.5 retracement overlaps the 1H OB. That’s the first stop. Beyond that, 2,520.97 marks the high-volume shelf and the 0.382 retrace — the true magnet.
If ETH reclaims that zone with strength, I expect delivery back to 2,550. If not, expect one more purge below 2,474 — and then the real reversal begins.
Execution logic:
🎯 Long trigger: 2,490.26–2,474.00 sweep
🧠 TP 1: 2,512 (OB/50% retrace)
🧠 TP 2: 2,520.97–2,532 (HVA zone)
❌ Invalidation: clean 1H close below 2,474 = new range forming
This is where most traders hesitate.
I don’t guess the bottom. I wait for Smart Money to make it.

ETH strong byhistory repeats itself - the main postulate of market analysis. Here I see a standard scheme for capturing liquidity. A level is created behind which market participants place stop orders. As soon as a large number of them accumulate there, the price breaks through this level, collecting liquidity. With a sharp return behind the level. This is how bitcoin turned around from 16k

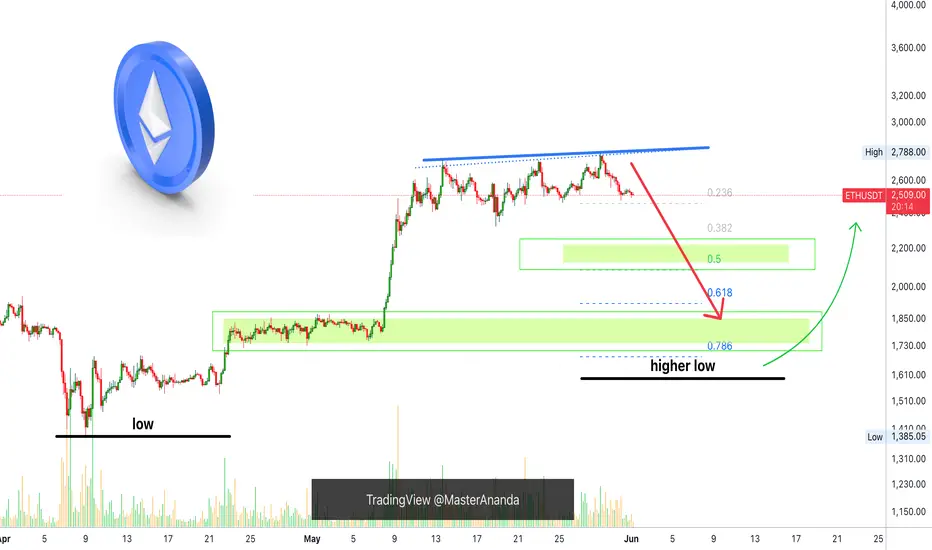
Ethereum: $2,000 Entry LONG Opportunity: Advanced Trading TipsBe careful when SHORTing here. The downside is limited but the upside is unlimited. Ideally, we trade with the trend. With the bottom being set 7-April, it would be wiser to wait for the higher low and go LONG. Now, bears are bears and bears are going to SHORT and that's ok. Just don't do it if you lack experience because it is harder than a LONG trade.
So here is the chart. The exact support level I cannot say but a bearish continuation looks high probability.
A $500 drop equals 20%. If you are doing 5X, this caps your profits potential to 100%. This isn't bad considering that it can happen within days. Experts only.
On the other hand, 3-10 days should be the maximum but of course, it can extend—these are just rough estimates.
This is how it is done from the bullish side, my side.
We wait patiently for the market to complete its retrace. We know it is a retrace because it is short-lived and because it ends in a higher low compared to the last major low.
We wait patiently for the drop and for clear reversal signals to show up on the chart. Once we have clear reversal signals, we go LONG. Very simple.
If you bought the LONG from the $1,570 level, then of course, nothing needs to be done. Sell a bit at each resistance, buy more at support. You can reduce your position even now. Remember, no need to get the exact top nor exact bottom. So you can sell some now, take profits; great. Then buy some more when prices are low. Your buy price can be $1800, $2000, $2100, it doesn't make much difference. What matters is selling high and buying low.
The first step is to get the great entry. Done. We did this back in April. The second step is to play the market as the bull market unravels. See how much time there always is to take action. Plenty of time to buy we had, plenty of time to sell.
For this to be profitable and successful we have to plan beforehand.
Here I am giving you live step by step instructions and this can also be done. But the truth is, people went LONG at resistance with high leverage and ended up losing everything, because we tend to trade based on an impulse. No, no, no.
Instead, detach, wait for the perfect moment and go LONG/SHORT.
Which one you prefer, bull?
Then wait for support and go LONG. Do not trade against your preferred bias.
Are you a bear?
Wait for resistance SHORT the retrace or wait for the correction. But this is many times harder of course because the downside is limited.
I hope you find this information useful and if you do...
Good luck.
Namaste.
Ethereum ($ETH) Poised for a Trend Reversal?When zooming out on the chart, a minor correction remains possible. However, if support at $2,400 holds, CRYPTOCAP:ETH could continue in an ascending channel. Buyer strength is currently weak, but a short-term correction could strengthen and improve the buying trend

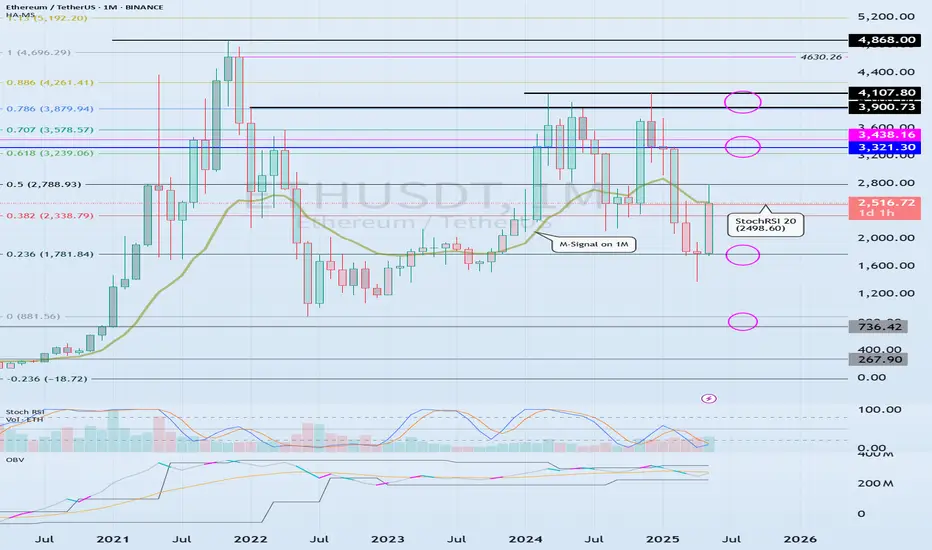
Important Turning Point: M-Signal Indicator on 1M Chart
Hello, traders.
If you "Follow", you can always get the latest information quickly.
Have a nice day today.
-------------------------------------
(ETHUSDT 1M Chart)
The key is whether the price can rise above the M-Signal Indicator on 1M Chart and hold it.
Accordingly, we need to see if it can rise with support near 2498.60, which is the 20 point of StochRSI.
If not, and it falls, we need to see if the HA-Low indicator is generated.
If the HA-Low indicator is generated, we can create a trading strategy based on whether there is support near that area.
-
(1D chart)
The key is whether it can rise with support near the M-Signal indicator on the 1D chart.
In other words, we need to see if it can rise with support near 2498.60-2609.74.
If not, it is expected to fall to the M-Signal indicator on the 1W chart and determine the trend again.
-
The current important support area is the 1647.06-1861.57 area.
The resistance zone is 3265.0-3321.30.
However, if the HA-Low indicator is newly created as the price falls, it is important to see if there is support around that area.
In any case, the price must be maintained above the M-Signal indicator on the 1M chart to continue the upward trend in the medium to long term.
Therefore, when it falls below the M-Signal indicator on the 1M chart, you should not forget that a short and quick response is required when trading.
-
Thank you for reading to the end.
I hope you have a successful trade.
--------------------------------------------------
- This is an explanation of the big picture.
(3-year bull market, 1-year bear market pattern)
I will explain more details when the bear market starts.
------------------------------------------------------
ETHEREUM Ethusdt will face immediate supply roof and a buy continuation test. if it fails to break that supply roof ,sellers will keep taking profit, break above and sustained will call for long position by retail and institutional traders alike.

ETH looks good and bullish dont , its just ranging if Eth break level above (2800) its next target its 3300-3400 usd,
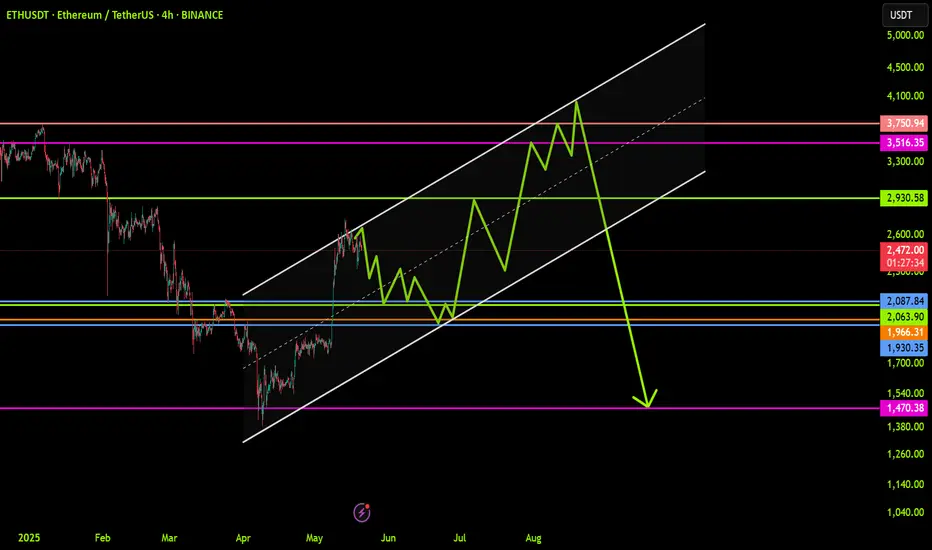
ETHUSDT: Trend in 4H time framehe color levels are very accurate levels of support and resistance in different time frames, and we have to wait for their reaction in these areas.
So, Please pay special attention to the very accurate trend, colored levels, and you must know that SETUP is very sensitive.
BEST,
MT
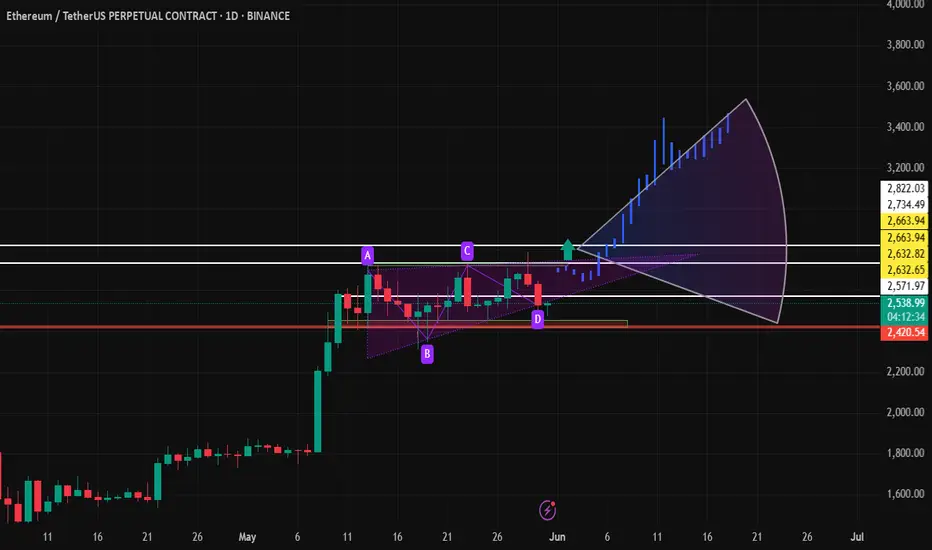
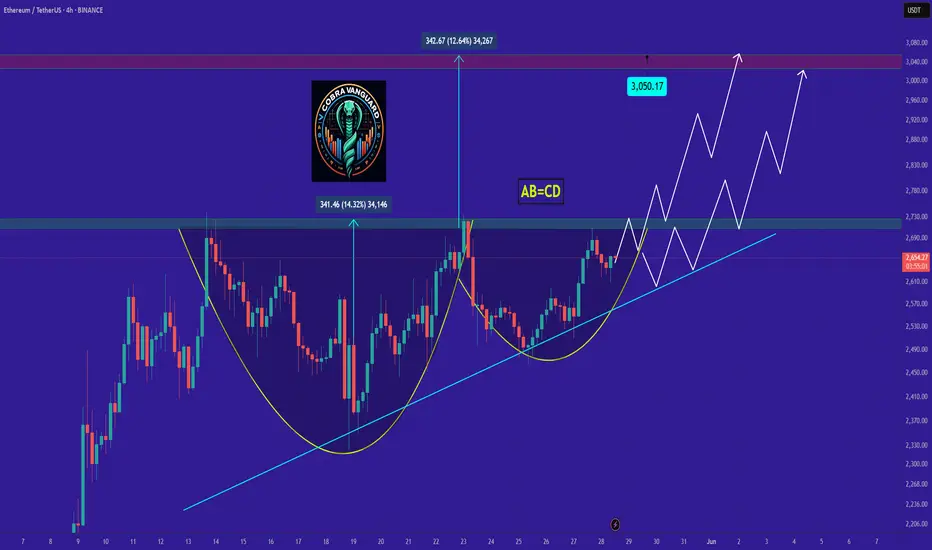
ETH's situation+ Target PredictionCurrently, ETH is forming an ascending triangle and cup and handle, indicating a potential price increase. It is anticipated that the price could rise, aligning with the projected price movement (AB=CD).
Continued strength could lead to upward movement toward targets at $2700, $2900, and $3.100
However, it is crucial to wait for the triangle to break before taking any action.
Give me some energy !!
✨We spend hours finding potential opportunities and writing useful ideas, we would be happy if you support us.
Best regards CobraVanguard.💚
_ _ _ _ __ _ _ _ _ _ _ _ _ _ _ _ _ _ _ _ _ _ _ _ _ _ _ _ _ _ _ _
✅Thank you, and for more ideas, hit ❤️Like❤️ and 🌟Follow🌟!
⚠️Things can change...
The markets are always changing and even with all these signals, the market changes tend to be strong and fast!!
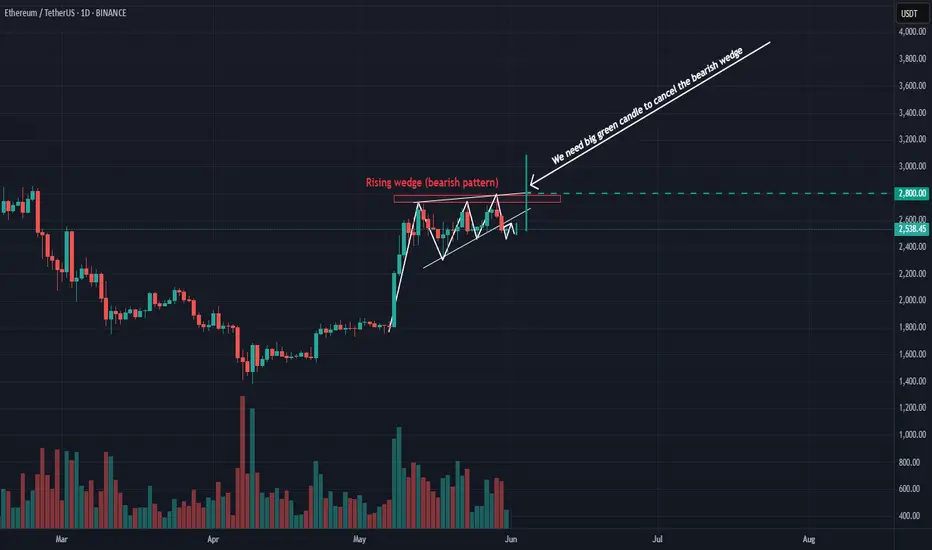
ETH Needs big money injection ASAPRising wedge presented in the chart is a bearish pattern.
To cancel this bearish pattern we need :
- Break the $2,800 level with bigh green candle
- The break should occur with big volume
- The break should be as soon as possible.
Otherwise, the downtrend will continue and he decline will be sharp.
COINBASE:ETHUSD BITSTAMP:ETHUSD CRYPTOCAP:ETH CRYPTOCAP:ETH.D
ETH/USDT – Altseason Confirmation in Sight?Ethereum's recent breakout at 1900$ is showing strong momentum and may be signaling the long-awaited start of altseason. A daily close above the red resistance box will act as a key confirmation of this shift and could trigger a parabolic move across many altcoins.
For ETH, the next upside targets are:
$3,500
$4,000
$4,700
Stay alert — a confirmed breakout here could light the fuse for the broader altcoin market.
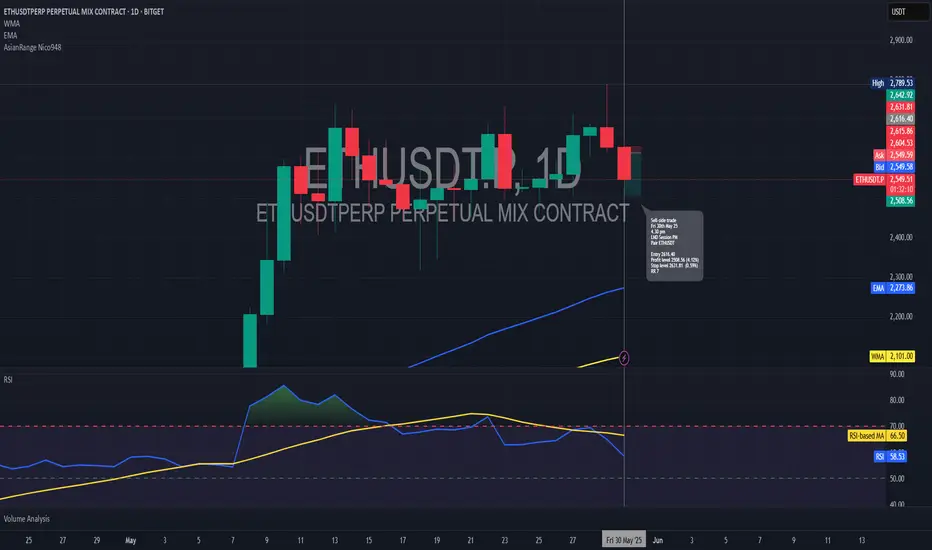
Short trade Trade Type: Sell-side Trade — ETH/USDT
Date: Friday, May 30, 2025
Time: 4:30 PM — London Session PM
Observed Timeframe: 15min
Entry Day TF
Entry: 2,616.40
Take Profit (TP): 2,508.56 (−4.12%)
Stop Loss (SL): 2,631.81 (+0.59%)
Risk-Reward Ratio (RR): 7.0
📓 Context / Trade Notes:
Market Structure: The trade was initiated following a bearish structure, with price action forming lower highs and lower lows, indicating a downtrend.
Technical Indicators: The RSI on the 15-minute chart displayed a bearish crossover of moving averages, reinforcing the short position.
The take profit level at 2,508.56 was determined based on the next significant support zone, aligning with a previous consolidation area.
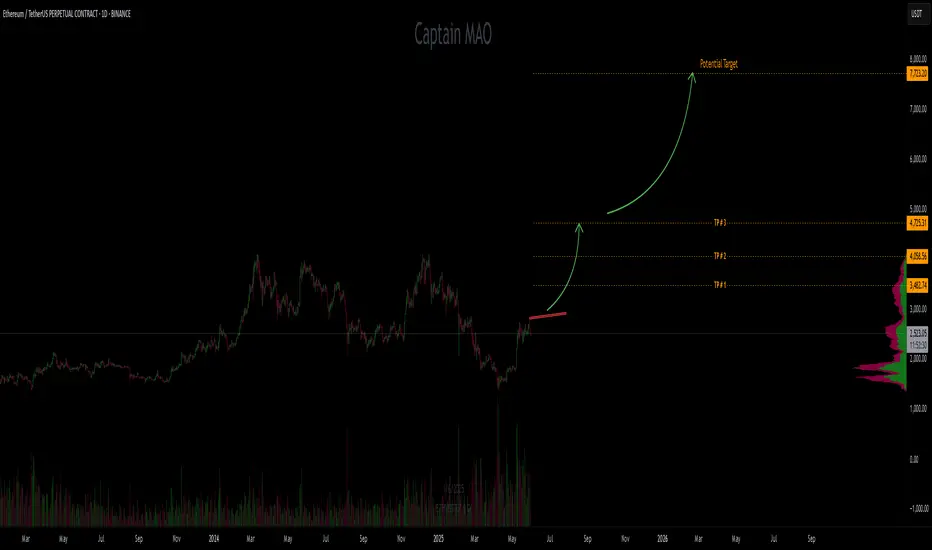
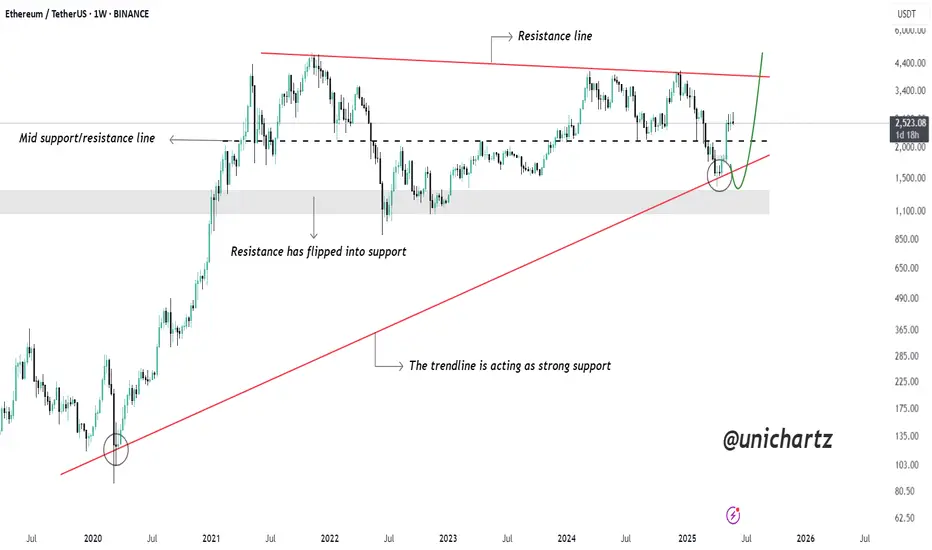
ETH Holding Long-Term Support – Road to $4K Open?CRYPTOCAP:ETH has successfully bounced from a long-term rising trendline that has acted as strong support since 2020. This trendline has historically triggered major bullish moves, and it’s doing its job once again.
Notably, ETH has also reclaimed the mid support/resistance level, which had previously acted as a key flip zone in past market cycles.
With both the trendline and horizontal support holding, the structure looks bullish. If momentum continues, ETH could head toward the upper resistance line, potentially targeting $4,000+ in the coming months.
The trend remains intact — this bounce could mark the start of a major leg up.
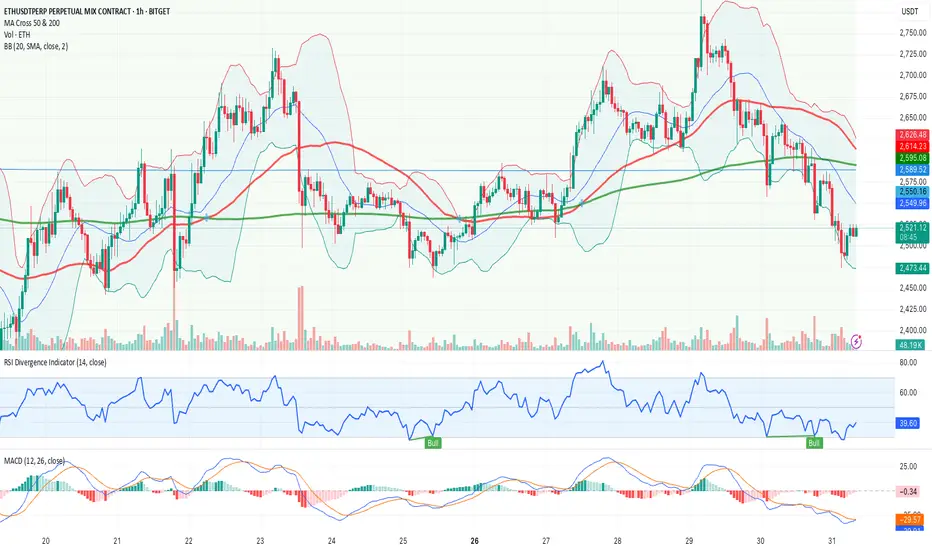
ETHUSDTPERP (Ethereum vs USDT Perpetual, Bitget, 1h)1. Main Trend
Currently, the short-term trend is bearish:
The price is below both the 50 and 200-period moving averages.
The recent movement shows a clear breakdown below previous support levels.
2. Key Levels
Major support: 2,473 (evident from recent lows and corresponding to the lower limit of the Bollinger Bands).
Key resistance:
2,549/2,550 (coinciding with the 50-period MA and the middle BB band).
2,589/2,614 (200-period MA and previous base of consolidation).
Breakdown: There was a clear breakdown below 2,550.
Breakout: Watch for break above 2,589/2,614 for a short-term reversal.
3. Technical Indicators
RSI: 38.83, in slight oversold territory, suggesting the selling may be slowing but with no strong bullish divergence yet.
MACD: Still negative and below zero, but the distance between the lines is narrowing—potential early sign of weakening bearish momentum.
Bollinger Bands: Price currently at or slightly below the lower band, indicating a possible technical bounce.
4. Risk / Opportunity
Suggested trading plan:
Following a sell-off and with RSI in the lower range, there is a possibility for a technical rebound (mean reversion), but the overall setup is still fragile.
Trading setup:
Asset: ETHUSDTPERP
Direction: LONG (attempting a technical bounce, a risky countertrend trade)
Entry: 2,520 (current price/just below 2,525)
Stop-loss: 2,473 (below the recent low, validated by the lower Bollinger Band)
Take-profit:
Level 1: 2,550 (test of resistance/mid BB band)
Level 2: 2,589 (area near the 50-period MA and previous support now turned resistance)
Confidence: Low
Additional notes:
This is a contrarian trade; the main trend is still bearish.
Avoid heavy exposure; consider small size or wait for bullish confirmation above 2,550/2,589 for a safer long.
No strong pattern detected, only technical oversold conditions on the hourly indicators.
If you prefer a trend-following setup:
Short on a pullback between 2,550 and 2,589 with a stop above 2,614 and targets at 2,473/2,450.
Summary: Short-term LONG setup for a potential bounce, but with elevated risk. Main trend remains bearish: be cautious and use strict risk management!
Bitcoin : Bullish Again? Bitcoin is riding the BUY ZONE .
Bitcoin 4hrs Bearish TIME Cycle is about to end , prepare to bounce .
Bitcoin 4hrs tf Cycle is in its final stage so a good bounce its just around the corner .
Bears beware your TIME is ending pack your things and get out of the way. You've been warned.

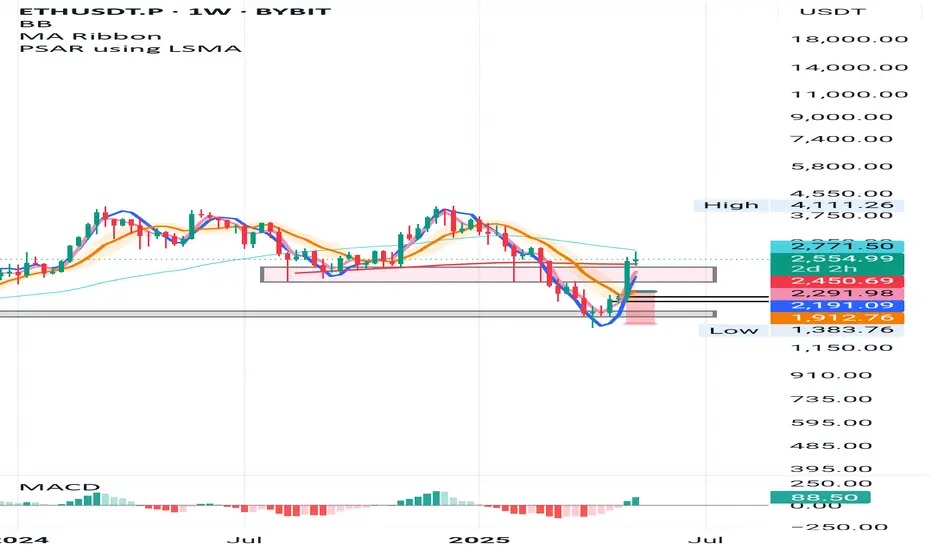
ETH 1W – Long above 200MA | Retest or Launch?ETH just broke two major barriers:
✅ Closed above the 200MA on the weekly
✅ Broke out of the pink zone, which marks the textbook double top base from June & December 2024
That pink box held price for months — a structural pivot that now flips from resistance to possible support.
Price paused into the 50MA, which typically doesn’t offer heavy resistance on the 1W.
If we see a pullback, I’m watching for a wick into the 200MA or even into the pink zone. Otherwise, this might just go vertical if macro stays calm.
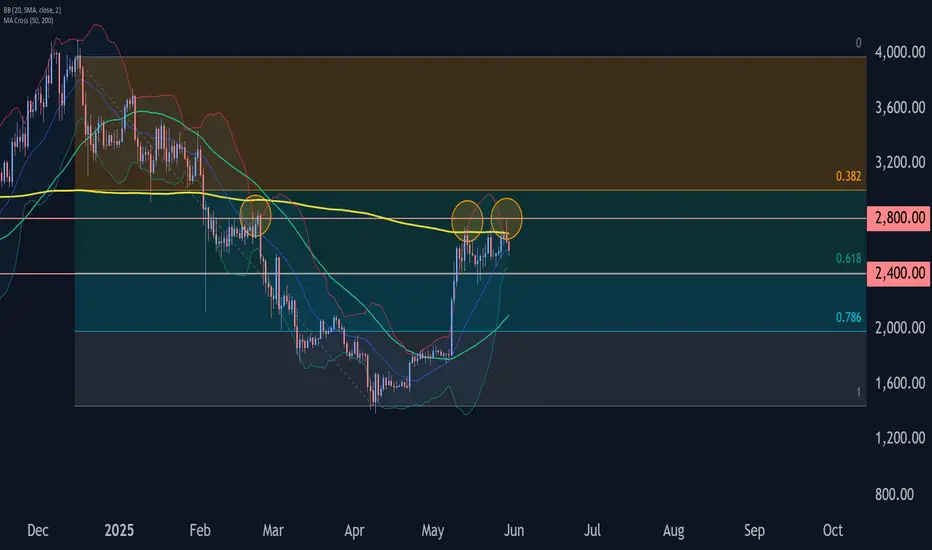
Ethereum Wave Analysis – 30 May 2025- Ethereum reversed from resistance zone
- Likely to fall to support level 2400.00
Ethereum cryptocurrency recently reversed down from the resistance zone lying between the resistance level 2800.00 (which has been reversing the price from February), upper daily Bollinger Band and the 50% Fibonacci correction of the downward impulse from December.
The downward reversal from this resistance zone formed the daily Japanese candlesticks reversal pattern Shooting Star.
Ethereum cryptocurrency can be expected to fall to the next support level 2400.00 (which stopped the previous wave (2) earlier in May).