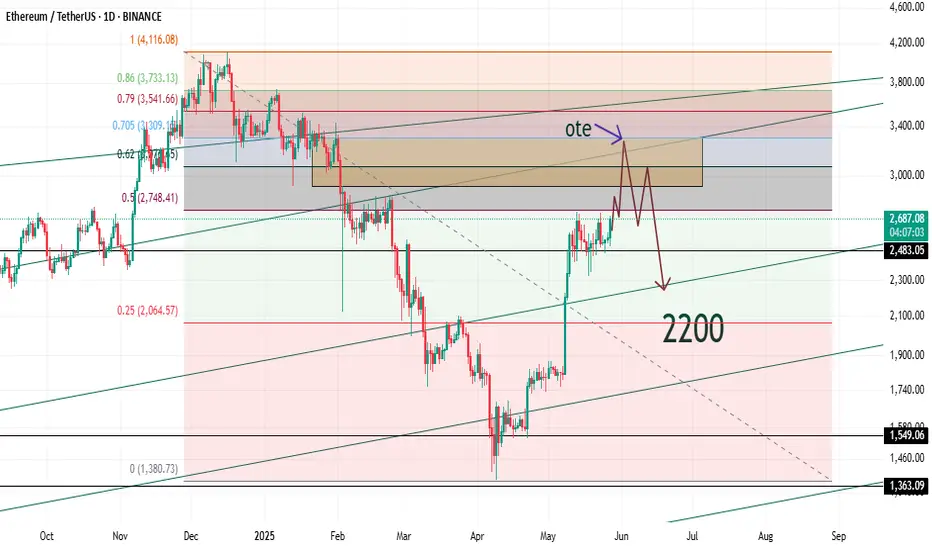
"Trap Ahead : Liquidity has a Price"Everyone’s screaming “bull market!” again…
Yeah, until the market humbles them—like always.
Let me walk you through what’s actually happening:
ETH is headed for a flashy detour to $3,300
—everyone’s gonna feel rich for a second.
Then?
Down she goes. Straight below $2,300.
Trust me, euphoria has a price.
Meanwhile, BTC is dressing up for above $113,500.
But don’t fall in love with the pump—it’s not here to stay.
That move? Just enough to get everyone trapped.
Next stop: sub-$93K.
Yup, the wolf said it.
This market doesn’t care about your hopes.
It rewards the patient, and devours the emotional.
Liquidity is the meal. You’re either the hunter… or the feast.
Follow Alpha Sigma Wolf
If you’re tired of hopium and want clarity instead.
Because I don’t do “maybe.”
I do moves.
Let the sheep cheer. We’ll be waiting.
#SMC #SmartMoney #CryptoAnalysis #ETH #BTC #AlphaSigmaWolf
ETHUSDT.PS trade ideas
Is ETH showing signs of bullish continuation?Ethereum (ETH) may be facing a range breakout, which could trigger the next leg up.

CHECK ETHUSD SIGNAL READ CAPTAIN(ethusd ) sell zone
( TRADE SATUP)
ENTRY POINT (2695) to (2700) 📊
FIRST TP (2675)
2ND TARGET (2645) 📊
LAST TARGET (2615) 📊
STOP LOOS (2730)❌

ETH(based on NEowave)I changed my analysis and I think Its better to consider eth in the middle of the running diamond diametrical.
stop loss of this analysis is 2400$.
ETH ANALYSIS🔴 #ETH Analysis : ❓❓
🔮There is a formation of "Bullish Pennant Pattern" in #ETH in 4HR time frame. We can expect around $2800 bullish move if the price break the pattern.📈
⚡️What to do ?
👀Keep an eye on #ETH price action. We can trade according to the chart and make some profits. ⚡️⚡️
#ETH #Cryptocurrency #Breakout #DYOR

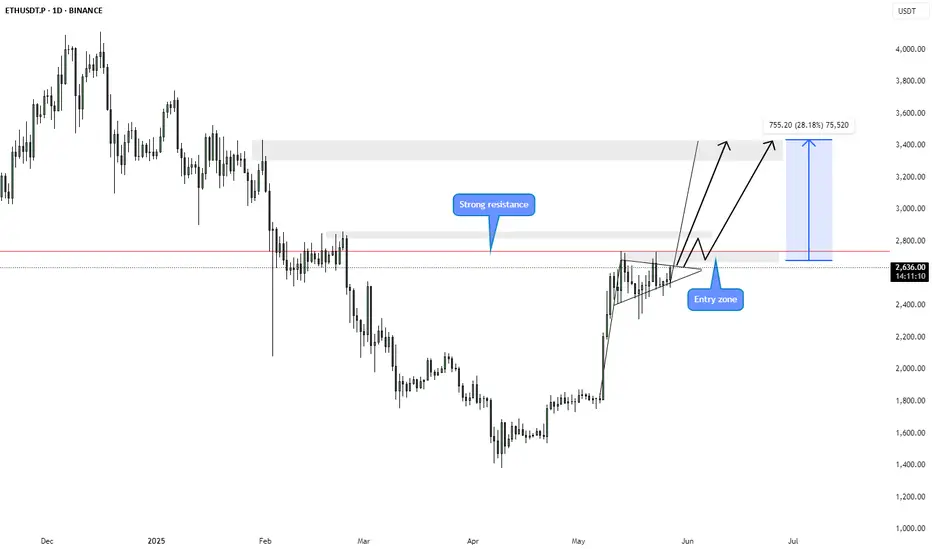
Ethereum Coiling Beneath Resistance — $4,000 Breakout?Ethereum’s price action is tightening beneath a key resistance level. With higher lows forming and market structure remaining bullish, ETH looks poised for a breakout that could send it toward $4,000.
Ethereum is currently trading in a consolidation phase just under a major resistance level at $2,700. This sideways price action may seem indecisive on the surface, but technically it’s forming a bullish continuation pattern. The structure shows consecutive higher lows compressing into a triangle beneath resistance—commonly seen before explosive moves.
This type of consolidation under resistance is typically interpreted as strength. Rather than breaking down or losing momentum, Ethereum is holding its ground and slowly building pressure. Each dip is being bought up sooner than the last, reflecting growing bullish interest and a reluctance among sellers to push price lower. From a market structure standpoint, ETH is still putting in higher highs and higher lows, indicating that the uptrend remains intact.
Key Technical Points
$2,700 Key Resistance: ETH is coiling just beneath this critical horizontal level, which has acted as a cap in recent weeks.
Ascending Triangle Formation: A bullish pattern marked by higher lows pushing price into overhead resistance, signaling potential breakout momentum.
Strong Market Structure: Higher highs and higher lows remain intact, supporting the current bullish bias.
If Ethereum breaks above $2,700 with a convincing bullish candle and volume influx, it could trigger an aggressive move upward. The next major level to watch is the $4,000 psychological mark, which stands as a natural magnet and round-number resistance. The impulsiveness of the breakout will be key—clean, high-volume price action above $2,700 could accelerate Ethereum into price discovery mode for 2025 highs.
Until that breakout occurs, ETH is still in a holding pattern. However, the bullish consolidation, pattern structure, and absence of lower lows suggest that any downside risk remains limited as long as ETH trades above its short-term trendline.
As long as Ethereum holds above its ascending trendline and continues printing higher lows, the bias remains bullish. A breakout above $2,700 could trigger a fast move toward $4,000. Traders should monitor volume closely and prepare for a possible expansion phase if resistance is breached.
ETH: Still optimistic and in transformationETH: Still optimistic and in transformation
Previously, ETH showed a strong bullish trend, but recent economic events have shaken things up.
On Friday, U.S. President Donald Trump announced a 50% tariff on the European Union, set to begin on June 1, 2025. This caused uncertainty in financial markets, triggering selling pressure on ETH, which dropped to $2,463—a key support level.
However, over the weekend, Trump extended the EU negotiations deadline until July 9, for talks between Washington and the 27-nation bloc to produce a deal.
If ETH holds the $2,463 support level, we could see another upward push in price.
You may find more details in the chart!
Thank you and Good Luck!
❤️PS: Please support with a like or comment if you find this analysis useful for your trading day❤️

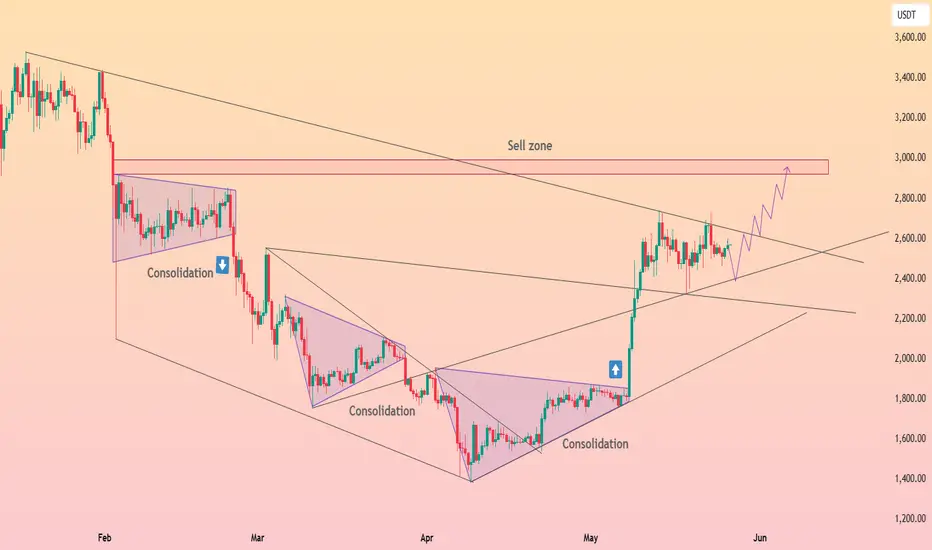
HolderStat┆ETHUSD wedge-breaker momentum runCRYPTOCAP:ETH — Monster breakout from a year-long falling wedge rocketed into a rising pennant; 2.55 k acts as dynamic trendline support. As long as bulls defend that level, upside extension toward the 2.95-3.1 k sell zone resistance looks probable. Lost support opens a dip to 2.25 k structural shelf before buyers regroup.
Good moment to try to Sell ETHGood moment to try to Sell ETHUSDT. We are in the flat channel and now around local up level of this channel. I think we should move to down and touch the low level and maybe create a local small down trend channel. Will see...
DeGRAM | ETHUSD kept the support📊 Technical Analysis
● ETH retested the old wedge roof (~2 450) and the new rising‑trendline in one touch, confirming them as support and printing a higher low.
● Price is climbing inside a fresh ascending channel; a mini bull‑flag above 2 600 targets the next horizontal resistance/supply at 2 886‑3 083.
💡 Fundamental Analysis
● CME Ether futures open‑interest topped $1.6 B while US spot‑ETH ETFs saw net inflows this week, signalling broader institutional accumulation as softer US CPI dents real yields.
✨ Summary
Confluent support at 2 450‑2 600 plus record futures/ETF demand back a tactical long: objectives 2 886 → 3 083; manage risk on a 16 h close below 2 450.
-------------------
Share your opinion in the comments and support the idea with like. Thanks for your support!

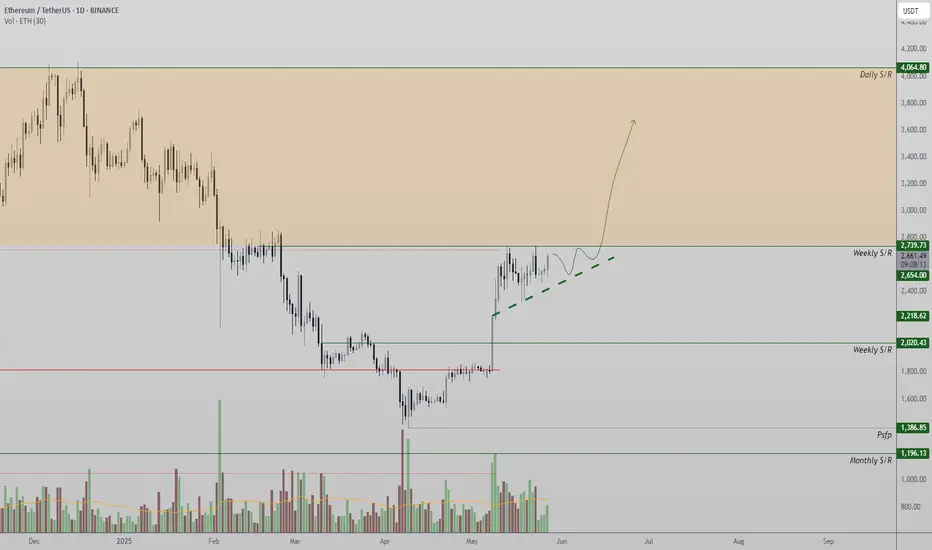
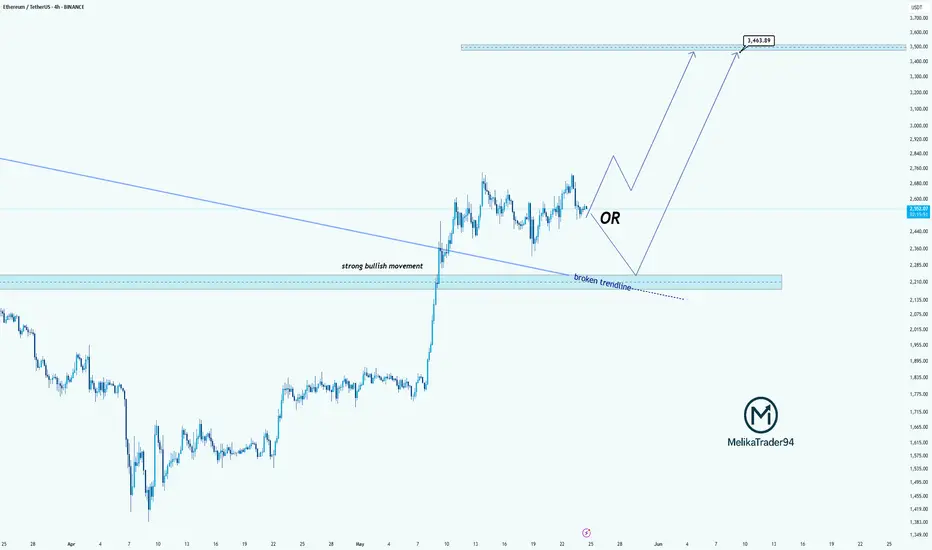
ETH Continues Bullish Momentum Above Broken TrendlineHello guys!
Ethereum has shown a strong bullish rally, breaking through a long-standing descending trendline with significant momentum. Currently, price action is consolidating above the broken trendline, which may now act as a support zone.
🔹 Scenario 1 (Bullish Continuation): If ETH holds above the current range and confirms the broken trendline as support, we could see a continuation toward higher resistance levels around $3,500 and beyond.
🔹 Scenario 2 (Deeper Retest): Alternatively, a pullback toward the $2,200–$2,300 area (highlighted zone) could offer a better accumulation point before the next bullish leg resumes.
This setup suggests that as long as ETH remains above the key support levels, the bullish structure remains intact.
Ethereum (ETH): Buyers Going For Breakout | Eyes Wide OpenEthereum is heading towards the local high area, where we are expecting to see a breakout from. As soon as we see the price reach local high we will be expecting some sort of resistance from sellers but if we keep similar momentum then upon seeing breakout we will be looking for a long.
Swallow Academy

Bullisch on ETHWait for the breakout of the bullish pennant and then we can play 2 scenarios, either we overshoot or we make a retest see for yourself what the conformations are at the moment of a breakout. Good luck everyone. tradingview.sweetlogin.com
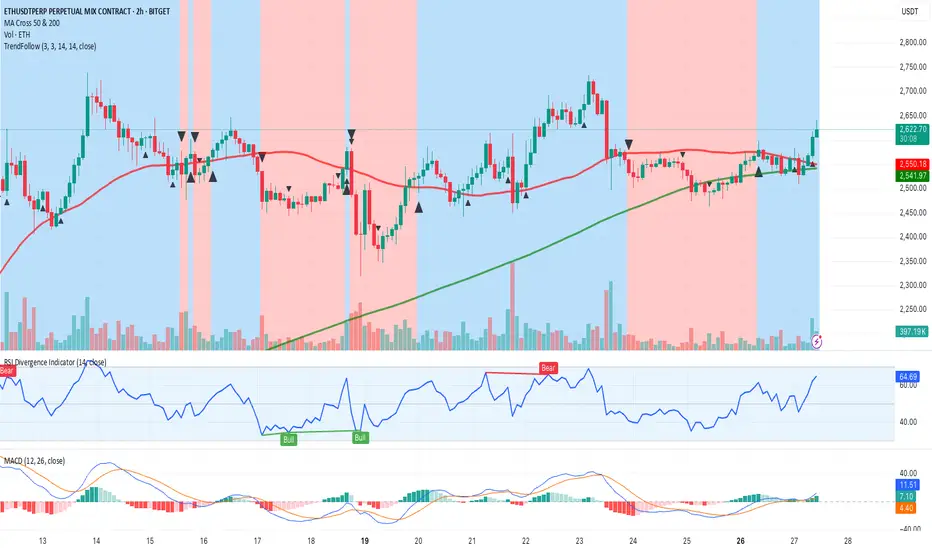
Asset: ETHUSDT (Ethereum Perpetual on Bitget)
1. Main Trend:
Price is breaking upwards after a sideways phase.
The 200-period moving average (green) is holding as long-term support, while the 50-period (red) has just been crossed decisively to the upside, confirming a potential bullish reversal in the short/medium term.
2. Key Levels:
Main support: 2,550 USDT (at 50 MA, just broken to the upside).
Immediate resistance: 2,660–2,700 USDT (previous high). A breakout above this range would confirm a trend continuation.
Breakout: The move is confirmed by increasing volume on the latest green candle.
3. Technical Indicators:
RSI: Currently at 65.82, close to overbought (70), but still has room to rise. No bearish divergences.
MACD: MACD line is above the signal line, and the histogram is increasing—bullish signal.
Volume: Rising during the breakout, indicating genuine participation.
4. Risk/Opportunity — Suggested Trading Signal:
Direction: Long (bullish)
Entry: 2,630 USDT (current price or slight retracement to 2,600–2,615 USDT)
Stop-loss: 2,545 USDT (below the 50 MA and last support, to avoid false breakouts)
Take profit 1: 2,700 USDT (first key resistance)
Take profit 2: 2,780 USDT (previous highs on the chart)
Confidence: Medium–High
Both the technical breakout and confirmation from the main indicators support the signal. Watch for RSI approaching overbought.
Additional notes:
Basic pattern: Bullish breakout from sideways consolidation.
No bearish short-term formation.
Macro factors: Monitor crypto market volatility; risk of retracement if traditional markets weaken.
Summary (required format):
Asset: ETHUSDT
Direction: Long
Entry: 2,630 USDT (or minor pullback to 2,615 USDT)
Stop-loss: 2,545 USDT
Take-profit: 2,700 USDT (TP1), 2,780 USDT (TP2)
Confidence: Medium–High
Additional notes: Breakout confirmed by high volume, bullish MACD, watch for short-term RSI overbought. For a more conservative strategy, wait for a confirmation above 2,660 USDT before entering.
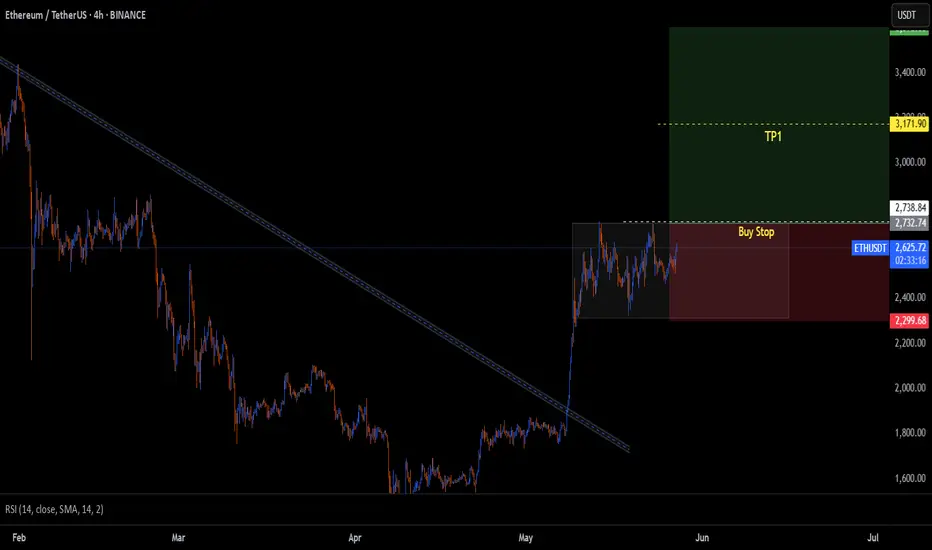
ETHUSDTHigher Highs (HH) & Higher Lows (HL): The pattern of higher highs and higher lows is an indication of an uptrend, showing that the buying momentum is strong.
Entry: Place a buy stop order just above the recent higher high (HH). This allows you to enter the trade if the price continues moving upward, confirming the bullish momentum.
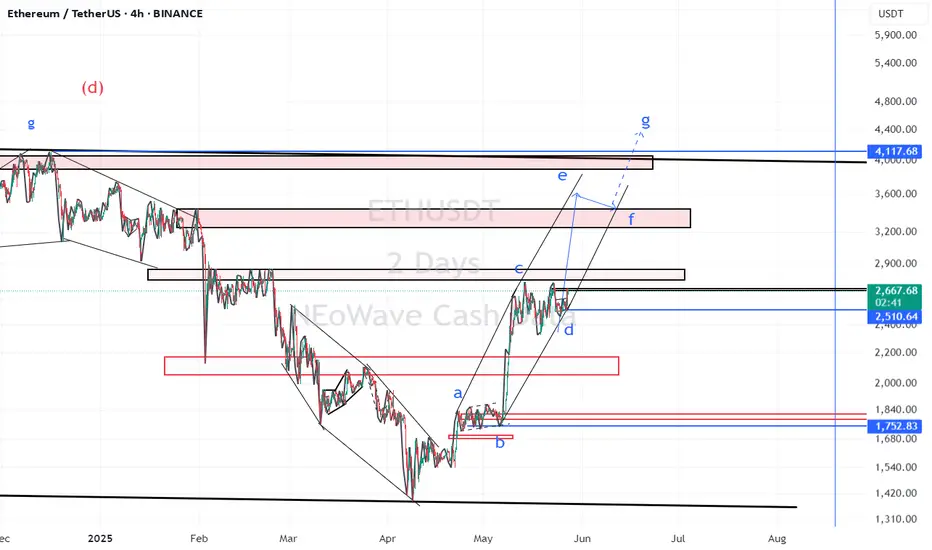
ETH/USDT – Symmetrical Diametric in Progress (4H Analysis) Here’s a TradingView post designed for your ETH/USDT 4H chart analysis using NeoWave – Symmetrical Diametric structure:
---
A rare and clean Symmetrical Diametric seems to be unfolding on the 4H ETH/USDT chart, following Glenn Neely’s advanced NeoWave principles.
Current Structure:
Waves A, B, C, D, and E have completed
All legs are nearly equal in time with clear directional alternation
Wave E retraced exactly 61.8% of Wave D, confirming symmetry
What's Next?
Wave F is likely starting now — expect an upward move
If correct, Higher High (HH) will be formed above Wave E
After that, Wave G will complete the 7-legged diametric with a Higher Low (HL) structure
Key Observations:
Time symmetry = strong confirmation for a Symmetrical Diametric
Current range: $2,500–2,610
Break above $2,590 will reinforce bullish Wave F development
Trading Outlook:
Watch for bullish confirmation near $2,540–2,550 zone
Wave F may target the $2,590–2,610 resistance zone
Final Wave G could offer a buy-the-dip opportunity if it respects symmetry
Pattern: Symmetrical Diametric
Current Wave: Likely beginning of Wave F
Bias: Short-term bullish, mid-term neutral (until Wave G ends)
DYOR – This is not financial advice.
Share your thoughts below — Do you also see the Diametric?
BINANCE:ETHUSDT BINANCE:BTCUSDT BINANCE:ETHUSDT.P BINANCE:ETHBTC BYBIT:ETHUSDT.P

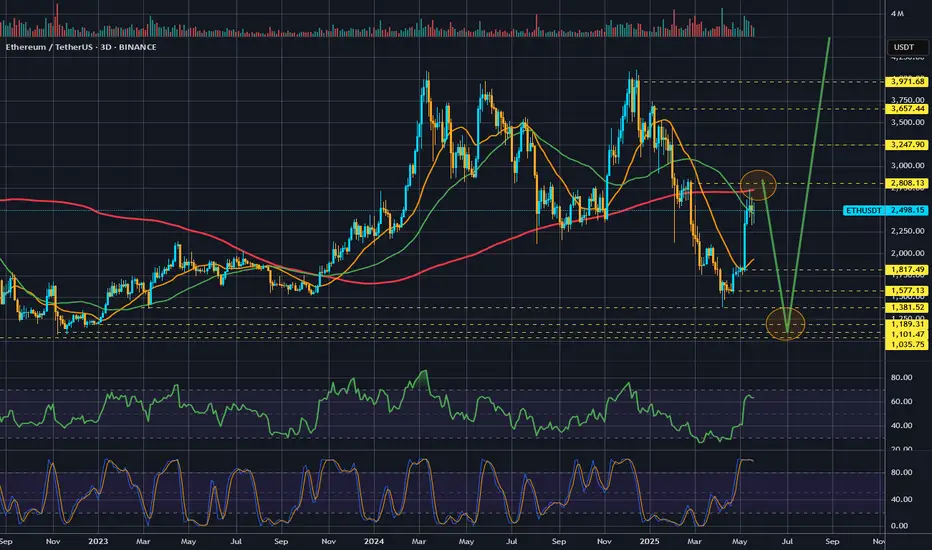
Short term next target for ETH - 1100$; Market crash in JuneEthereum will be reaching 2808$ in coming days before month May is closed.
ETH almost reached main liquidity zone for this rally and also 200MA. As soon this level is done - expect another market crash in June.
Next crash will be super fast and most of altcoins will drop even lower.
Target for ETH in month of June is between 1100$ and 1300$.
After this crash we will see altcoin season and ETH will lead it.
We are entering last phase of a bull run. There are about 3 months left before we enter a bear market officially.
Here is previous idea from 1300$ to 2808$
Ethereum flagging out gives us a setup with good RRETH is forming a nice structure that looks like a nice flag on higher timeframes. Structures allow you to create setups that include valid risk management. There is a clear volume gap below that can present some weakness.
Full TA: Link in the BIO

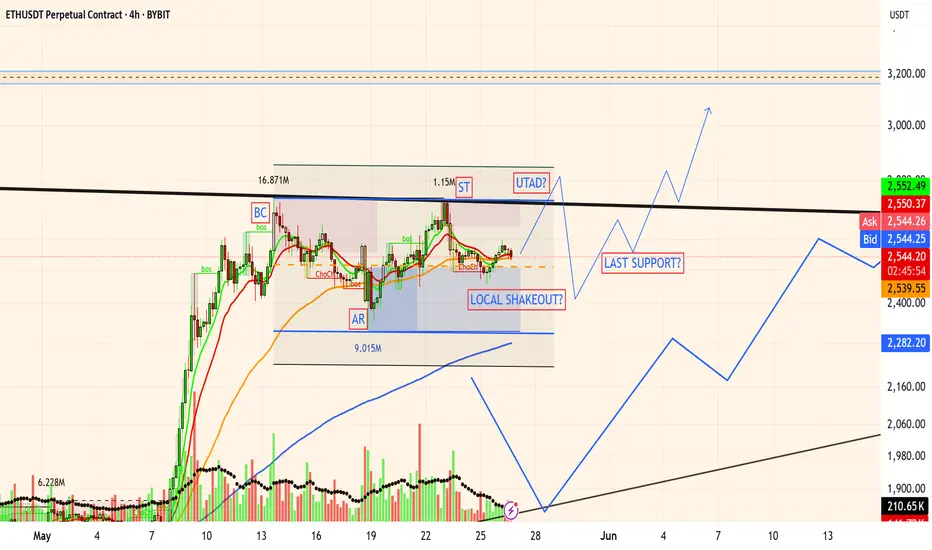
Ethereum 4H - Wyckoff?It is always very difficult to understand the dynamics with fragmented volumes, where peaks almost always coincide with an abrupt move.
This is Ethereum on 4H, a position I am following, although I prefer larger timeframes.
I am not currently trading, but rather holding pending better times.
Remember to be careful, these are delicate and dangerous times, especially for those who are not so experienced.
You can copy the setup and follow it by yourself.
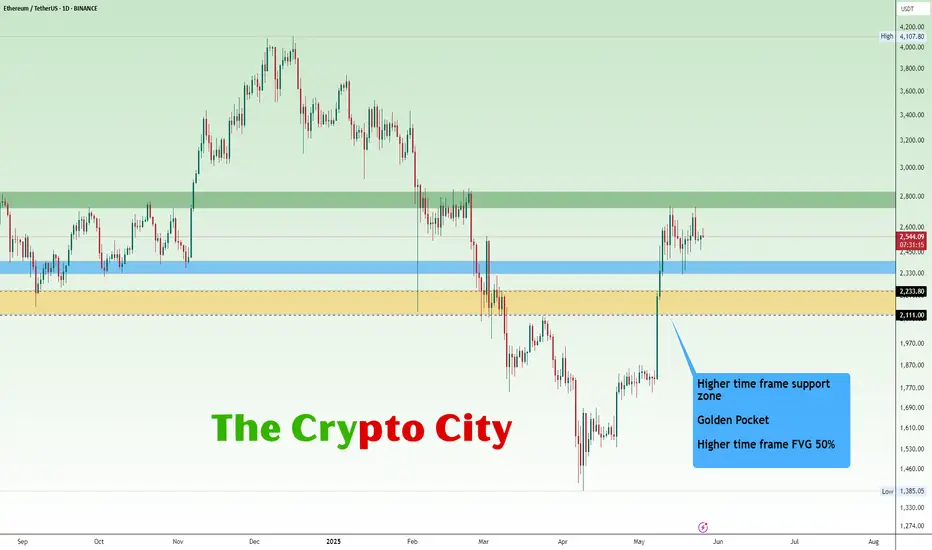
ETH USDTEthereum’s $2,328–$2,400 blue support zone was an excellent buy range. If the price breaks below this zone, the last opportunity to buy may be at the yellow support zone.
In the coming weeks, if Ethereum breaks above the green resistance zone at $2,727–$2,833, we could see new highs. I believe this breakout would signal the beginning of a new bull run.
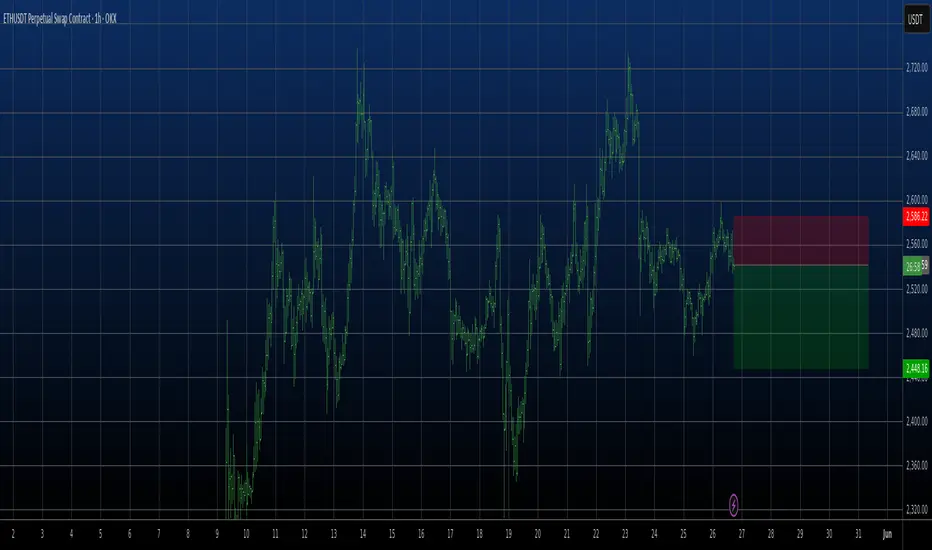
Strategic Rebound from Fibonacci 50%-61.8% Within Bullish ChanlThis trade is based on a confirmed bullish structure following a Break of Structure (BOS) and multiple Change of Character (CHoCH) signals, indicating a potential trend reversal. Price is currently trading within a rising channel, pulling back into the key Fibonacci 50%-61.8% retracement zone (2,551 – 2,539 USDT).
This area aligns with a possible institutional order block, increasing the likelihood of a bullish reaction. The trade targets a move back toward the local high around 2,598 USDT, with potential extension to the liquidity zone near 2,670 USDT. A protective stop-loss is placed below structure at 2,527 USDT, ensuring a favorable risk-to-reward ratio.

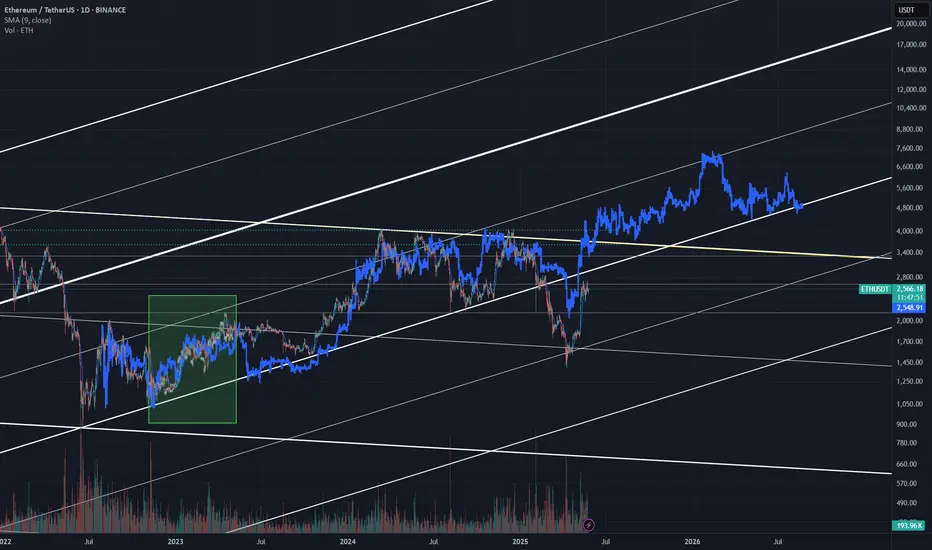
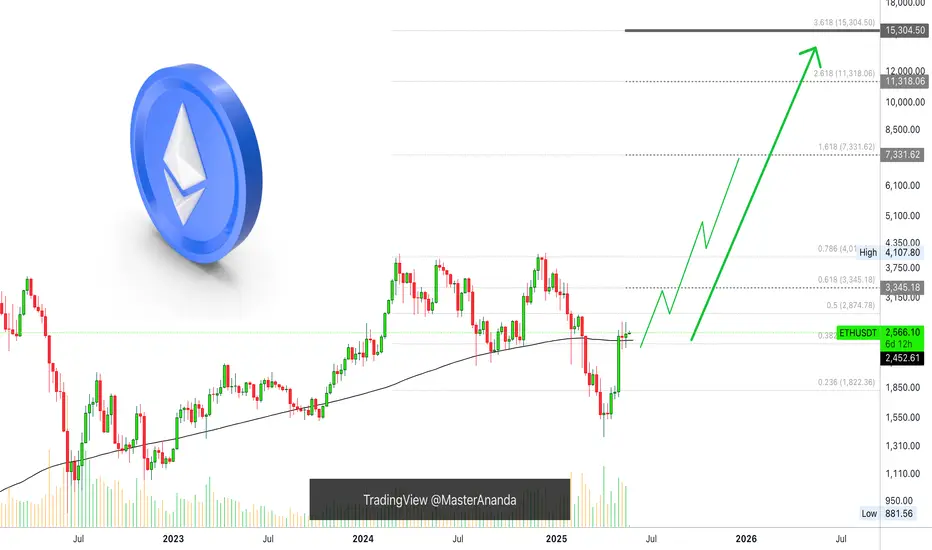
Ethereum Breaks Above MA200, Long-Term Bullish Cycle ConfirmedThe 5-May week marked not only a major advance and recovery above the August/September 2024 low prices, but it also signals a recovery for Ethereum above MA200 long-term, weekly timeframe.
This simple signal confirms that the bulls are in. But there is more.
After breaking above this level, Ethereum closed two additional weeks green above it, both times wicking lower but recovering. So this level has been conquered, retested and continues to hold. This means that we have at least 6 months of bullish action confirmed based on the chart, technical analysis.
There are also some great signals based on the long-term.
» RSI: The weekly RSI has a strong reading (bullish) and produced a major higher low compared to June 2022. This signal matches what happened at the end of the previous bearish cycle.
» MACD: The weekly MACD also produced a long-term higher low compared to July 2022 coupled with a bullish cross. This indicator is trending full-upwards and leaves no room for doubt. Ethereum is set to grow long-term. Let me show you the MACD...
What would you do if you knew, with a high level of certainty, that Ethereum will trade at $7,000 or higher this same year? How would you take action? How best to profit from this knowledge/information?
Namaste.
Eth bull market movement, potential ATM in few monthsEth bull market movement, potential ATM in few month based on previous pattern