ETHUSDT.PS trade ideas

ETH long signalETH looks great for short term trade.
*Depends on how the market will behave during this week*
ETH-USDT // 15 Min // Technical analysis // Short SetupI’m looking at a clean short opportunity on ETHUSDT. Price has been respecting this ascending channel for the past few days, bouncing perfectly between support and resistance.
Right now, it just tapped the top of the channel and showed signs of rejection. That’s where I’m planning to take the entry.
🟢 Entry: 2696.26
🎯 Target: 2580.27
🔴 Stop Loss: 2743.38
💥 RR: Around 2.4R
I’m expecting a pullback towards the lower channel line, where price has reacted multiple times before. If the channel continues to hold, this could play out nicely.
Not using any fancy SMC here — just basic structure, momentum, and clean price action. Let’s see how it goes 🤞
📌 Always trade with proper risk management. This is just my view, not financial advice.

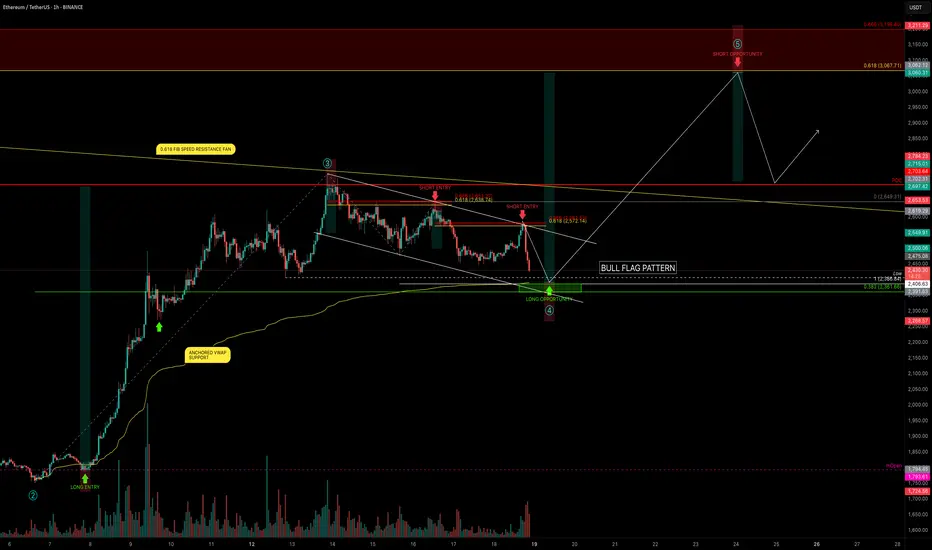
ETH — Bull Flag or Trap? Trade Plan with TargetsETH is setting the stage for its next major move — and the chart is packed with clues.
After completing Wave 3 at $2738.50, ETH has entered a corrective phase, forming what looks like a bullish flag. But beneath the surface, smart money levels are aligning: VWAP, Fibs, key levels, and liquidity traps are all converging around one high-probability zone.
This analysis breaks down both the long and short setups, backed by real confluence and clean R:R opportunities. Whether you’re planning to snipe the reversal near support or fade the rally at resistance, you’ll walk away with a clear trade plan and deeper insight into how price reacts at precision levels.
Let’s get into it.
🟢 Bullish Scenario: Long Setup with Deep Confluence
After a fakeout pump into the golden pocket of this minor downtrend (typical for a Sunday), ETH rejected cleanly at the upper resistance of the bull flag channel.
We're now watching for the swing low at $2406.63 to be swept, setting up a potential SFP (Swing Failure Pattern) at a highly confluent support zone:
🔍 Confluence at the $2390–$2360 Zone:
Anchored VWAP from the Wave 3 origin at $1752 is sitting at $2390
Trend-Based Fib Extension 1:1 of the correction lands at $2386.84
Liquidity pool just under the recent swing low
0.382 Fib retracement of the entire Wave 3 at $2361.66
0.618 Fib Speed Resistance Fan intersects this zone
Lower bull flag support line also aligns
This makes the $2390–$2362 zone a high-probability bounce area.
📌 Plan:
Laddered long entries between $2390–$2362, watching closely for a clean SFP or reversal signal.
Target 1: $3000 psychological level
Target 2: 0.618 Fib retracement at $3067.71 (potential Wave 5 top)
Stop-loss: Below previous yearly open (can be tightened after confirmation)
R:R: 1:5 or better after SL adjustment
🔴 Bearish Scenario: Short Setup at Key Rejection Zone
If ETH makes a move up to complete the 5th wave, we monitor $3067.71 — the 0.618 retracement of the entire corrective leg — as a key resistance.
If price rejects here with momentum loss or bearish structure:
📌 Plan:
Short on confirmed rejection of $3067.71
Stop-loss: Above $3211 (above 0.666 Fib)
Target: Previous high near $2700 or lower
R:R: 1:2 or better depending on entry and structure
🧠 Educational Insight: Why Confluence Increases Probability
Many traders chase setups based on single indicators. Real edge comes from stacking independent tools: VWAPs, Fibs, FVGs etc... When they align, the setup isn’t random — it’s high conviction.
This strategy gives you a framework to anticipate where price is likely to move and why, rather than reacting emotionally.
Patience and preparation will always outperform panic and reaction. Trade the plan — not the impulse.
___________________________________
If you found this helpful, leave a like and comment below! Got requests for the next technical analysis? Let me know.
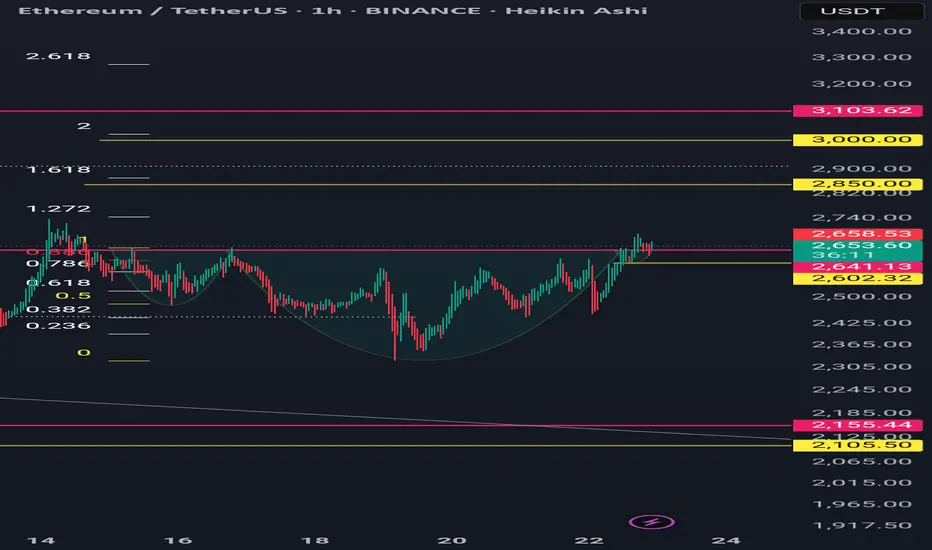
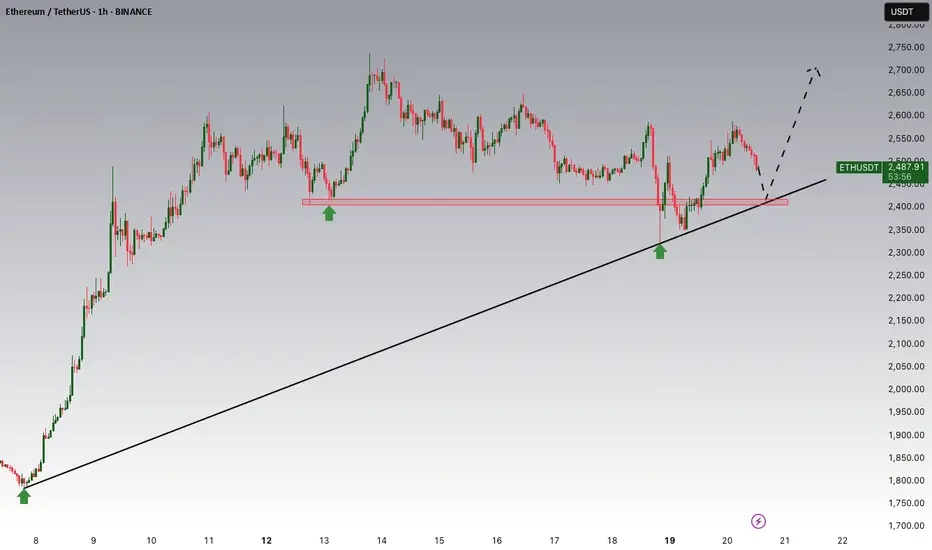
Ethusdt 1hr time frame a not so perfect bullish iH&S patternETH/USDT: A not-so-perfect bullish Inverse Head and Shoulders (iH&S) pattern has formed and already activated.
Targets are $2850 and $3000.
Invalidation is a 1-hour close below $2602.
This is a very tight swing trade, but offers a good risk-to-reward ratio if it plays out well. Please manage your risk according to your strategy.
Ethereum (ETH): Buyers Pressuring Local High | Looking For BreakBuyers are pressing the local high on ETH, where we are looking for a proper breakout to happen soon, so we are switching ourselves to a PLAN A scenario.
As soon as we see some kind of breakout to form, we will be looking for an entry for a long position here so watch closely.
Swallow Academy

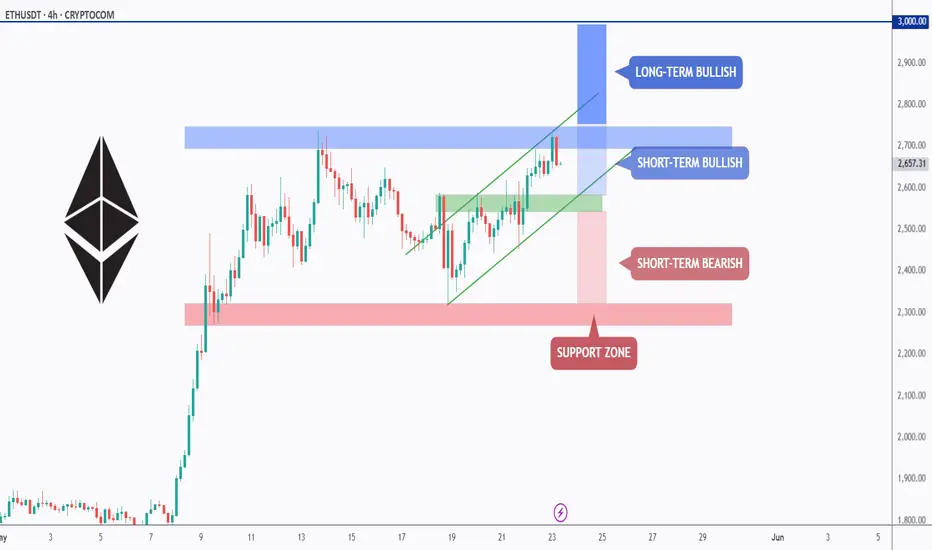
ETH - BBB - Bullish Building Block!Hello TradingView Family / Fellow Traders. This is Richard, also known as theSignalyst.
🏢 ETH Building Blocks:
📈 Short-Term Bullish:
ETH is currently bullish trading within the second floor in the shape of a rising channel marked in green.
As ETH retests the lower green trendline and $2,550 structure, we’ll be looking for short-term trend-following long setups!
📈 Long-Term Bullish:
For the bulls to remain in control medium-term and push towards the $3,000 mark, a break above the last major high at $2,750 is needed.
📉 Short-Term Bearish:
If the $2,550 structure is broken downward, ETH's momentum will be shifted from bullish to bearish leading to a correction phase towards the $2,300 support.
📚 Always follow your trading plan regarding entry, risk management, and trade management.
Good luck!
All Strategies Are Good; If Managed Properly!
~Rich
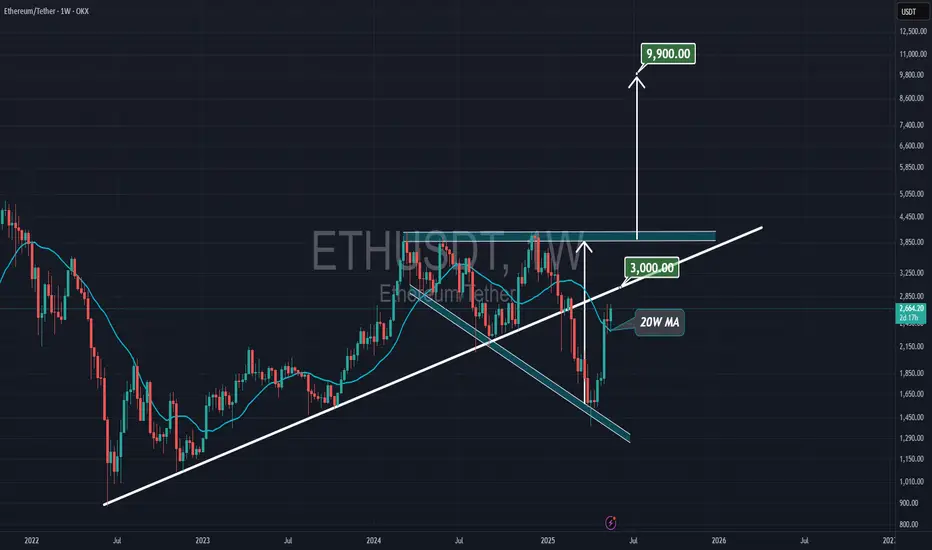
Ethereum can get $9900 (23MAY2025)As Ethereum is playing inside a broadening pattern ( 2 blue zone )
1) Hold above the 20 weekly MA
2) Needs to break the $3000 trendline
3) Breaks above $4000 resistance
The target at $9900 is reachable in the coming months
ETHEREUM TRIANGLE BREAKOUT IMMINENT?📈 ETHEREUM TRIANGLE BREAKOUT IMMINENT? 🚀
CRYPTOCAP:ETH / USDT | 1D Chart
Since early 2021, ETH has been forming a massive symmetrical triangle — a long-term consolidation pattern signaling accumulation. I've drawn the upper resistance and lower support lines that have repeatedly dictated Ethereum’s major trend reversals.
What’s striking here is the historical projection overlay — it aligns almost perfectly with the key reaction zones at the triangle’s top and bottom trendlines. This correlation strengthens the case that Ethereum is nearing the apex of a breakout decision.
🔍 MARKET CIPHER INSIGHT:
Market Cipher B is flashing classic bullish divergence:
✅ Multiple green dots on the momentum waves
✅ Money Flow Index showing a steady shift from red to green
✅ RSI clusters rebounding from oversold levels
✅ Significant "R" reversal signals aligning with historical triangle support
🧠 This confluence of technicals + fractal harmony + Market Cipher validation suggests ETH is not only respecting this triangle structure, but preparing for a major move — likely upward.
🎯 A breakout above ~$3,200 could ignite a wave toward new highs, especially with ETF narratives, staking yields, and macro liquidity tailwinds.
👁🗨 Keep this triangle on your radar. It’s rare to see historical projection and indicator momentum converge this cleanly.


Skeptic |Ethereum (ETH) Analysis: Altcoin Rally Ready to ExplodeHey everyone, Skeptic here! Did you see Bitcoin finally smash through the $107K resistance? Now, with BTC.D dropping, liquidity’s flowing back into altcoins like ETH , which could be gearing up for some wild rallies! 😊 Stick with me for a deep dive into Ethereum’s charts. Let’s start with the Daily Timeframe. 📊
Daily Timeframe: The Big Picture
After breaking the downward curve trendline, ETH has started a sustainable uptrend. Rising volume and Bitcoin’s rally confirm this move, so we can cautiously say the weekly major uptrend is regaining steam. This gets confirmed if we hold above the daily resistance at 2886.63 . Our spot trigger is a consolidation above 2886.63 , backed by increasing volume and momentum, plus a key condition: ETH/BTC needs to be in an uptrend.
Let’s take a quick peek at the ETH/BTC chart.
For a long time, ETH/BTC was in a sharp downtrend on the daily, but recently, it’s kicked off an uptrend momentum. A break above the 0.02588 resistance would confirm ETH/BTC’s uptrend, signaling it’s time to buy spot ETH. Until that break, I don’t recommend jumping in. Always confirm with ETH/BTC—otherwise, Bitcoin is the safer buy since, if ETH/BTC stays bearish, Bitcoin will likely outperform ETH.
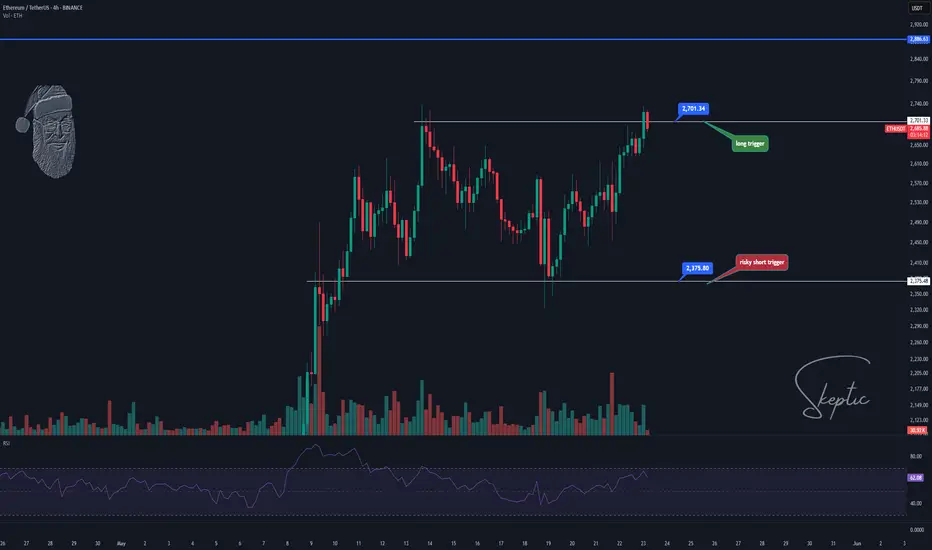
4-Hour Timeframe: Long & Short Setups
Let’s zoom into the 4-hour timeframe for long and short triggers. For my long setup, I’ve already opened a position after the break of 2701.33 .
On the 15-minute timeframe, rising volume and RSI hitting overbought during the breakout gave solid confirmation. It looks like it’s pulling back to this level now, but there’s a chance it could be a fakeout. I’m letting it play out—if it hits my stop loss, no big deal; I’ve got risk management in place, and one stop won’t blow up my account :) For a short setup, a break below 2381.51 , coinciding with a break below ETH/BTC support at 0.02289 , could be your short trigger. But I don’t recommend it—the major uptrend is bullish, so shorting means going against the trend, which is risky.
💬 Let’s Talk!
If this analysis sparked some ideas, give it a quick boost—it really helps! 😊 Got a pair or setup you want me to dive into next? Drop it in the comments, and I’ll tackle it. Thanks for joining me—see you in the next one. Let's grow together! 🤍
ETH/USDT – Breaking Out After BTC!🚀 Hey Traders! 👋
If you’re finding value in this analysis, smash that 👍 and hit Follow for high-accuracy trade setups that actually deliver! 💹🔥
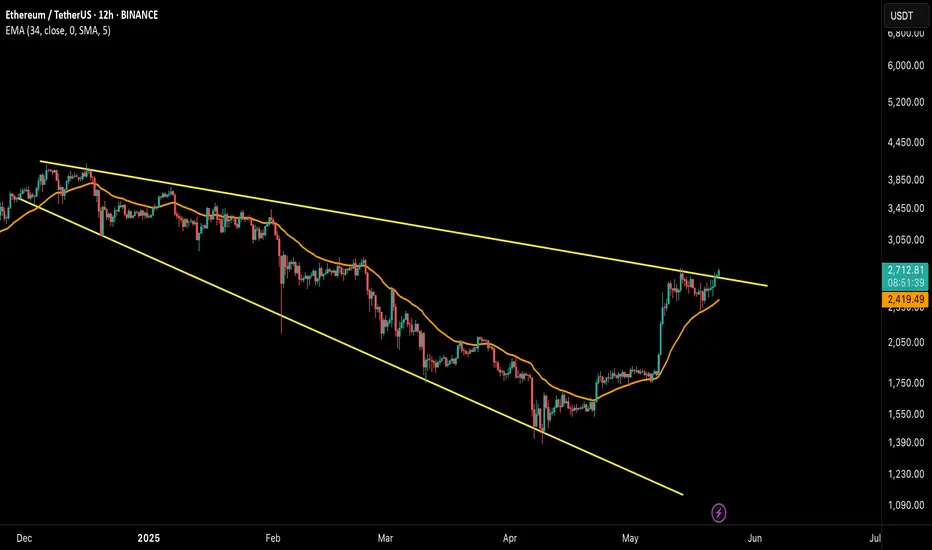
After BTC’s rally, it’s ETH’s turn to shine! 🔥
Ethereum has officially broken out of the descending channel on the 12H timeframe, a structure that’s been holding price down since late 2024. This breakout is significant — and here’s why:
📊 Technical Breakdown:
🔸 Broadening wedge finally broken after months of compression
🔸 Price holding well above the EMA, confirming short-term bullish momentum
🔸 Strong volume on breakout candle, suggesting genuine buying pressure
🔸 Breakout coincides with BTC’s surge — signaling altcoin rotation could be starting
📍 Key Levels:
➡️ Immediate Resistance: $2,850
➡️ Short Term Target Zone: $3,200–$3,500
➡️ Major Target Zone: $5000
➡️ Support to Watch: $2,480 (EMA + breakout retest)
💡 Why It Matters:
This move isn’t just technical — it’s psychological. ETH has been lagging BTC for weeks, and this breakout could shift trader sentiment back toward altcoins. If ETH holds above the breakout zone, we may see altcoins gain serious traction in the coming days.
📌 Strategy Note:
Look for a successful retest of the breakout zone for confirmation. A strong daily close above $2,700 could pave the way for a sustained uptrend.
What’s your ETH price prediction? Drop it in the comments and let’s ride this momentum together! 💥
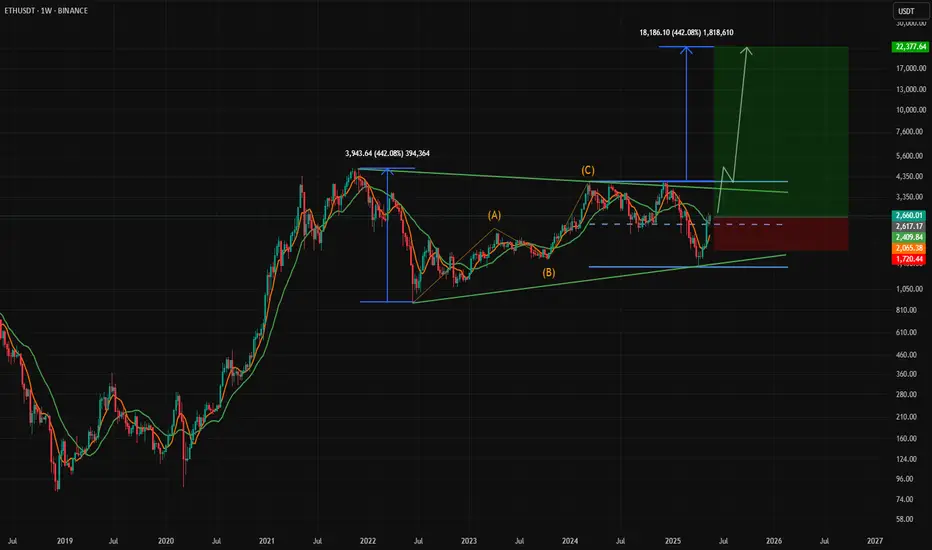
1D ETH/USDT bullish continuation flat patternWe are at the top of the previously established range and we have to make decisions, personally on the daily chart I took partial profits and I would only have to wait for a retracement (B-C) in a flat pattern of bullish continuation looking for purchases in the lower part, taking priority of the bullish pattern of the 1W chart.

2025.05.23 ETHEREUM Short-term long positionWe are the SeoVereign Trading Team.
With sharp insight and precise analysis, we regularly share trading ideas on Bitcoin and other major assets—always guided by structure, sentiment, and momentum.
🔔 Follow us to never miss a market update.
📈
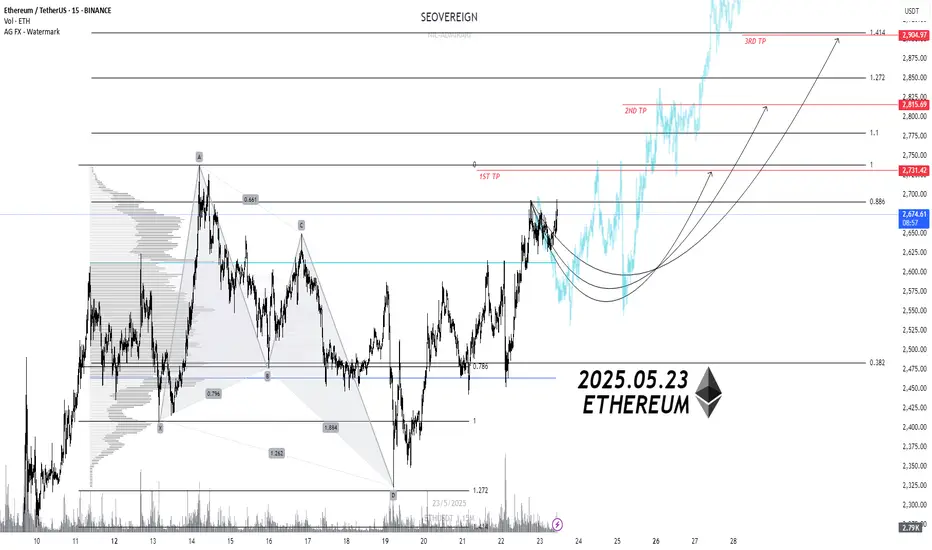
Currently, Ethereum appears to have entered a short-term buying strategy zone based on the main long scenario. Starting from the Butterfly Pattern, the trend has shifted upward and is maintaining its bullish momentum.
According to technical analysis, the short-term targets are as follows:
1st Target: 2,713
2nd Target: 2,815
3rd Target: 2,900
This zone is considered a continuation phase of the upward trend, and strong momentum has been confirmed following the breakout of the PRZ (Potential Reversal Zone) of the pattern. However, due to the high volatility in the current market, strict risk management and a scaled approach are essential.
📌 Strategy Summary:
Long entries are recommended after a trigger occurs
Quick response required if key support zones are breached
Short-term profit-taking zones are based on the targets above
This scenario reflects a short-term strategy aligned with the main long perspective, and adjustments may be necessary if structural changes occur.
Stay flexible and responsive to market movements.
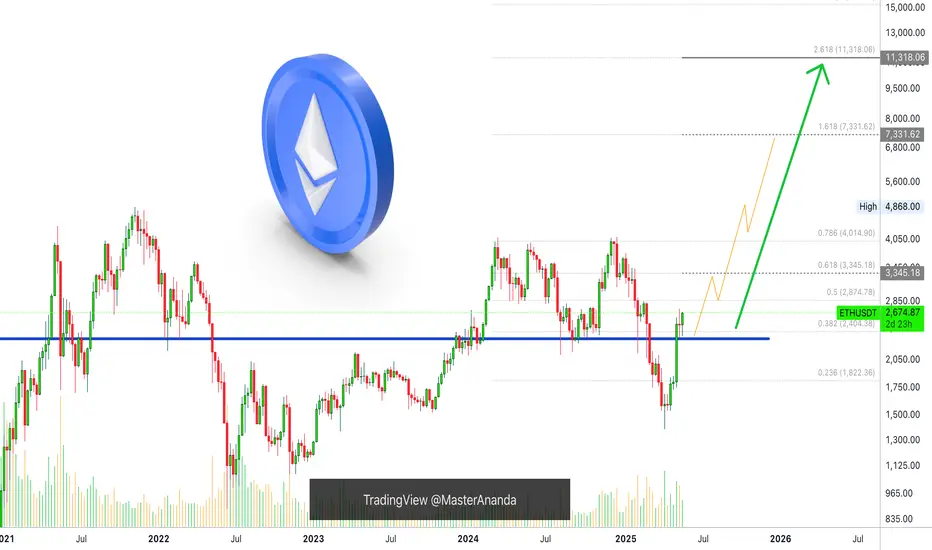
Ethereum Late 2025 Targets Simplified —$7,331 & $11,318We are getting closer and closer to the bull run phase. We are getting closer to a period where the entire Cryptocurrency market will be extremely bullish. I wanted to simplified Ethereum's targets for you.
Having a long-term perspective can make your trading, your holding, much easier.
Imagine Ethereum goes to $4,500 and starts a strong retrace. As prices move up, you wouldn't feel compelled to sell, you would just be happy looking at the numbers on the screen and waiting for more. As soon as the correction comes, doubt can start to creep in. Should I sell now? Will it continue lower? Is this the end? How far down can it go?
We can plan ahead but the market impulse, the energy, the mass, the group, the herd, the news; things can shake us out of our hands, knowing in advance how high prices can really go, can make it easier for us to hold strong.
If Ethereum trades at $5,000 and stats to retrace, and you know that a minimum target of $7,300 is expected, then you can easily hold. But without this information it would be hard to do so when prices are down 30% from the top. The worst part is that we tend not to sell at the top, ignore the top and the impulse becomes really strong to sell when prices are low.
Ok. That's not the situation now. We bought early, we caught the bottom and it is the start of the bullish wave. Having 20 different targets can be as hard as having no targets, how much to sell and when?
So here are the targets simplified, these are the main targets for Ethereum in this upcoming bullish phase.
1) $3,345 ($3333). Easy target. Can be easily ignored. Resistance can change and instead of $3,345 it shows up at $4,015. Nobody cares, we are aiming higher.
2) The ATH. Ignore it will be broken.
3) $7,331. Now this will be a strong target and can even be the top, so this is one to watch out for. If the market reacts strong and there is huge bear volume, securing some profits wouldn't be a bad idea at this point, but there is more.
4) $11,318. This is full blown-bull market with major bullish force in place. If we get a great bull market, we can hit this target or even higher.
What I mean is that there is no point in selling at $3k, $4k or $5k. When the market shakes, ignore. When there is a retrace or correction, feel free buy-in, rebuy and reload.
Namaste.
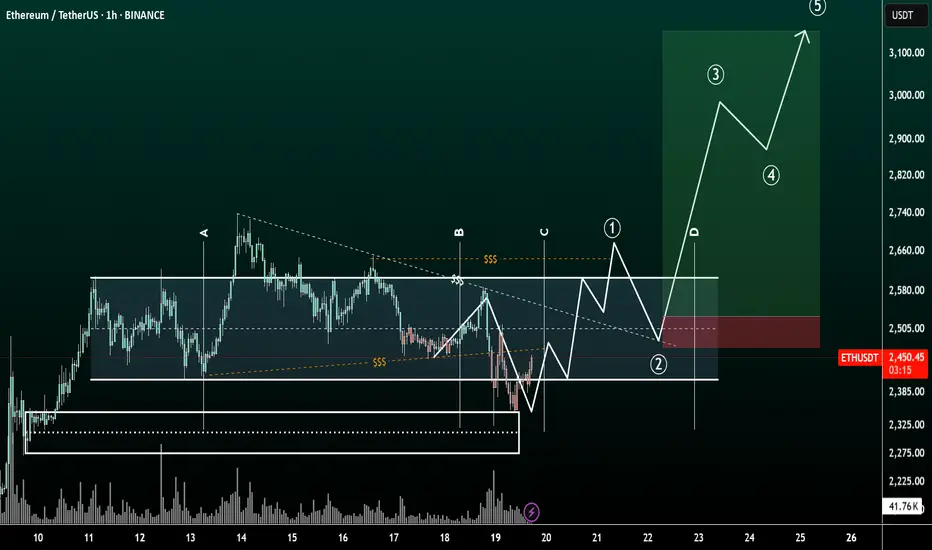
ETHUSDT🔍 Ethereum Analysis | A Major Move Is Brewing!
Based on my detailed technical analysis, Ethereum is setting up for a potentially massive move.
I’m currently waiting for confirmation, but I've already entered a position with solid risk management in place.
🎯 Trade Plan:
I’ll be exiting the position at the completion of wave 5 (or possibly wave 1 depending on the evolving structure).
📈 This analysis will be continuously updated as the price action develops.
Stay tuned — something big is coming for ETH...

ETH/USDT Potential UpsidesHey Traders. in today's trading session we are monitoring ETH/USDT for a buying opportunity around 2420 zone, Ethereum is trading in an uptrend and currently is in a correction phase in which it is approaching the trend at 2420 support and resistance area.
Trade safe, Joe.
$ETHUSDT - Major Breakout Alert! CRYPTOCAP:ETH has officially broken out of a long-standing descending parallel channel on the daily chart — a key structural shift in market sentiment. This breakout is further supported by a successful close above the 50 EMA, which had acted as dynamic resistance throughout the downtrend.
Key Technical Developments:
- Broke out of a descending parallel channel
- Closed above 50 EMA for the first time in weeks
- Strong daily candle with 8% gain confirms momentum shift
Immediate Support: $1,790 (former resistance zone turned support)
Next Major Resistance: $2,393
This is the mid-zone before ETH challenges the broader supply area around $2,550–2,850.
This breakout mirrors Ethereum's typical behavior during previous cycle expansions — grinding accumulation followed by aggressive breakout moves. The confluence of the EMA breakout and channel structure suggests we could be looking at the beginning of a broader trend reversal.
Trading Plan:
Retests towards $1,850–$1,790 can offer high R:R entries.
Watch for continuation patterns or consolidation above $2,000 for the next push.
CRYPTOCAP:ETH is reclaiming momentum — if BTC remains stable, this move could expand quickly.
If you find this analysis helpful, please hit the like button to support my content! Share your thoughts in the comments, and feel free to request any specific chart analysis you’d like to see.

ETHUSDT IDEAThings still looks inside a consolidation phase and some breaks upside or downside is needed for long momentum trades.

ETH ROAD TO 3000$ BUT.,,In the review, he told his vision of the price within the coming weeks on the ether asset.
A small correction and entry into the monthly premium zone is the target of large capital, in my opinion.
What are your ideas about the air?

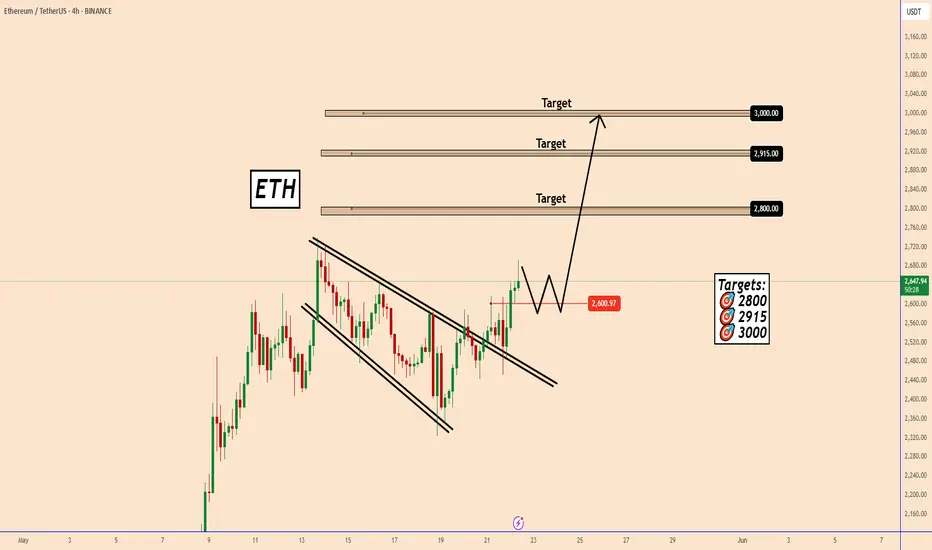
Ethereum Eyes New Highs as BTC Breaks Records🚀 Ethereum Eyes New Highs as BTC Breaks Records
Ethereum has broken out of a bullish flag pattern and seems ready to rise further.
Yesterday, Bitcoin surged to $111,800, hitting a new all-time high and fueling hopes for further gains.
If BTC keeps pushing upward, Ethereum is likely to follow.
The price could first test $2,600 before continuing its rally.
🎯 Next targets:
$2,800
$2,915
$3,000
You may find more details in the chart!
Thank you and Good Luck!
❤️PS: Please support with a like or comment if you find this analysis useful for your trading day❤️
ETH Strongly BullishAs soon as ETH breaks out of the resistance level at $4100 we could see a huge rally up to $22000.
NFA
Ethereum (ETH): Reached The Resistance Line | Plan A VS Plan BEthereum has reached an important zone where this area will decide in which direction our next bigger movement. For now we are just going to wait and not rush into any trade but as soon as we see any kind of BOS to form or proper rejection with MSB, we are going to look for proper movement to lower zones.
Swallow Academy
