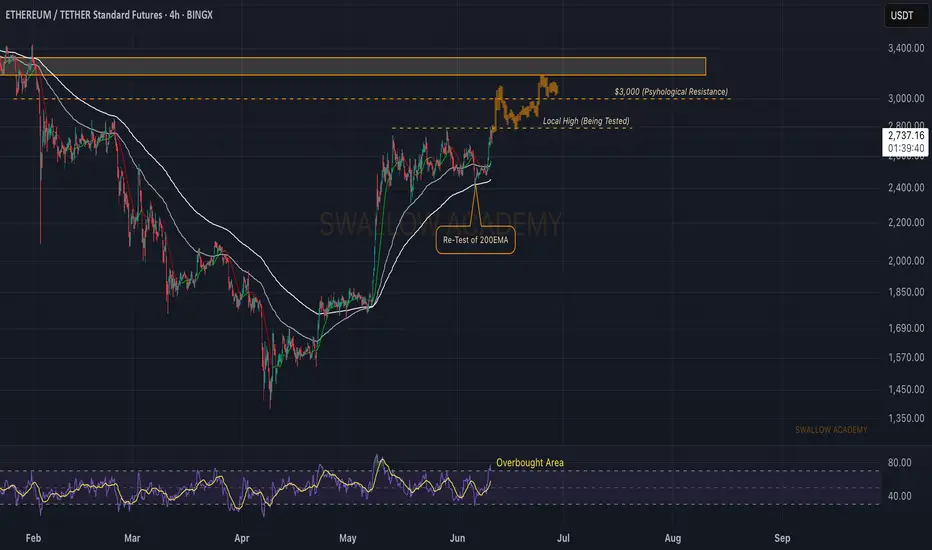
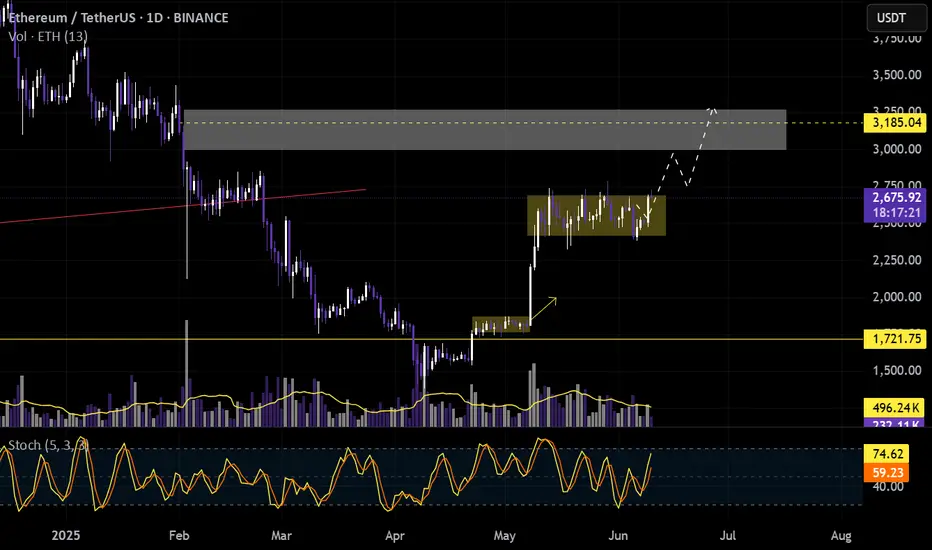
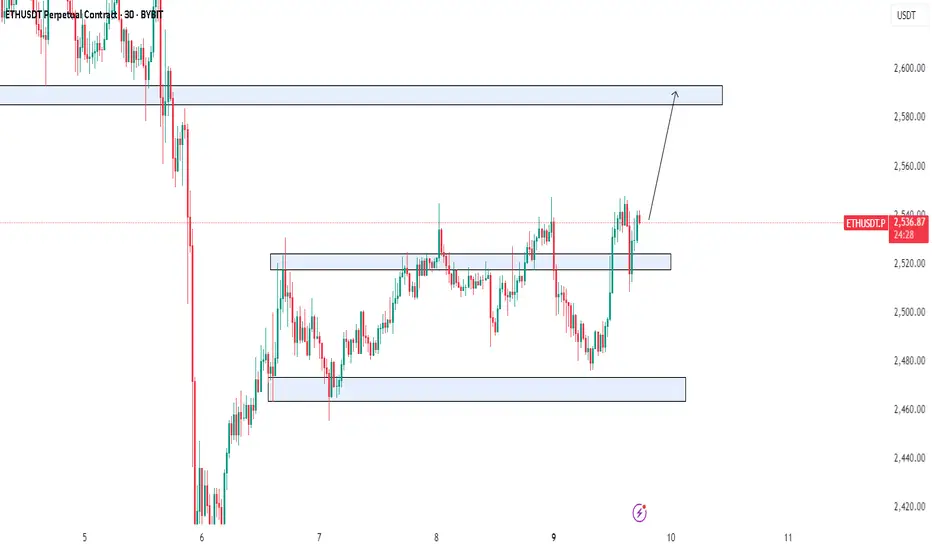
Ethereum (ETH): Testing Local High, Looking For Bullish MoveEthereum is showing some strong signs of upward movement, where we are testing the local high area after a successful retest of the 200EMA.
We are looking for a breakout from here, which would then give us a good movement to upper zones toward the $3000 area.
Swallow Academy
ETHUSDT.PS trade ideas
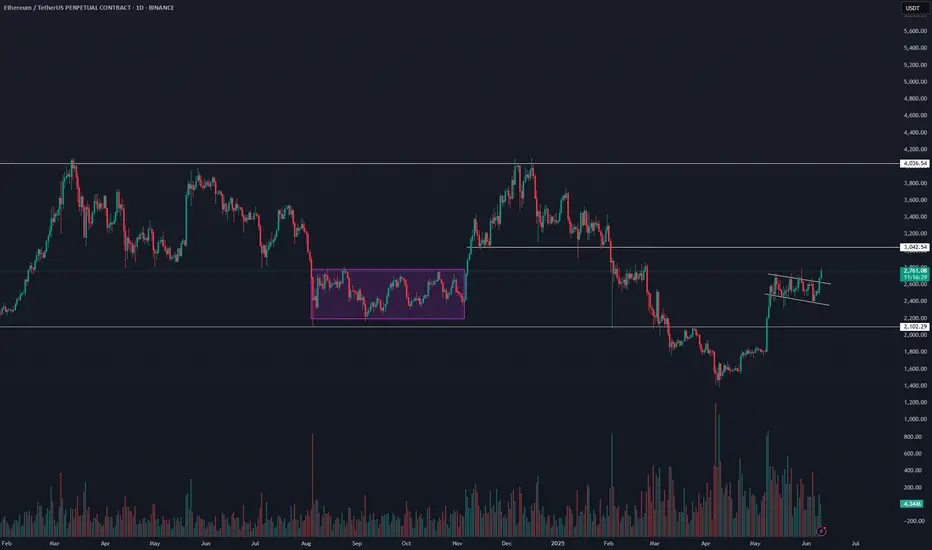
$ETH Breakout Holding Support, Targeting $4KBITSTAMP:ETHUSD has broken out of its long-term downtrend and is now holding above key support at $2,440–$2,500.
Once strong resistance, this zone has flipped to support after a clean breakout and retest.
#Ethereum could rally toward $4,000 if this level holds a potential 66% upside.
Bullish structure, but always manage your risk.
DYRO, NFA

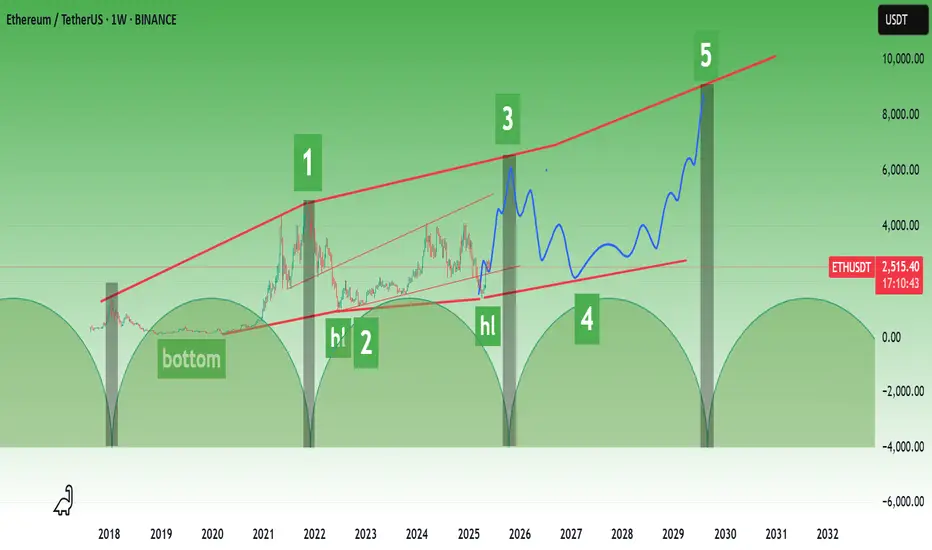
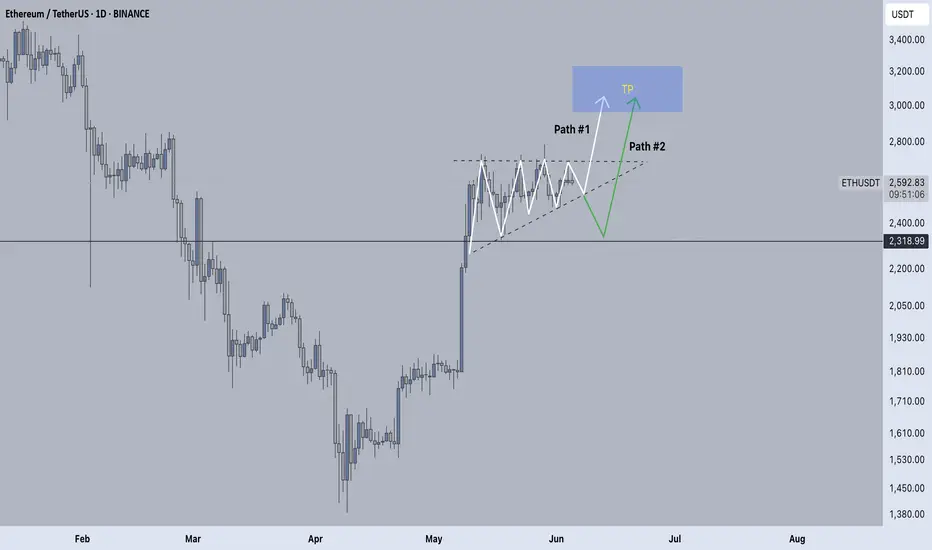
ETHEREUM ROADMAPI tried to predict based on previous time periods and elliot waves.
Please note that my analysis is not short-term. Of course, there may be short-term correction waves in Ethereum.
* The purpose of my graphic drawings is purely educational.
* What i write here is not an investment advice. Please do your own research before investing in any asset.
* Never take my personal opinions as investment advice, you may lose your money.
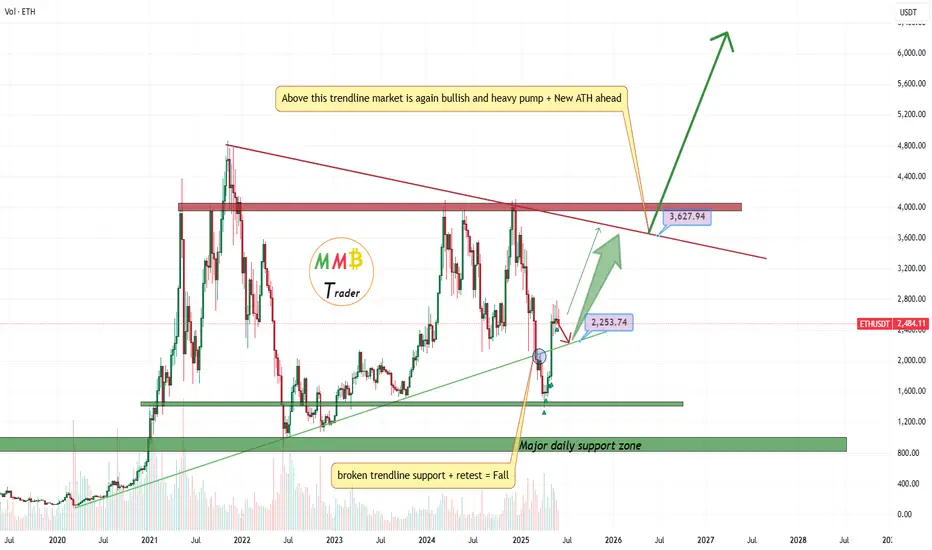
ETHUSDT still in range soon breakout to the upside and 7K$As we mentioned a lot this time ETH will also pump with BTC and soon we are looking for new high on this chart like the green arrows and what we need now is a little patience and let it cook.
DISCLAIMER: ((trade based on your own decision))
<<press like👍 if you enjoy💚
ETH is going for itAfter reclaiming the range, now the breakout on the daily RSI. Everything looks set for ETH.

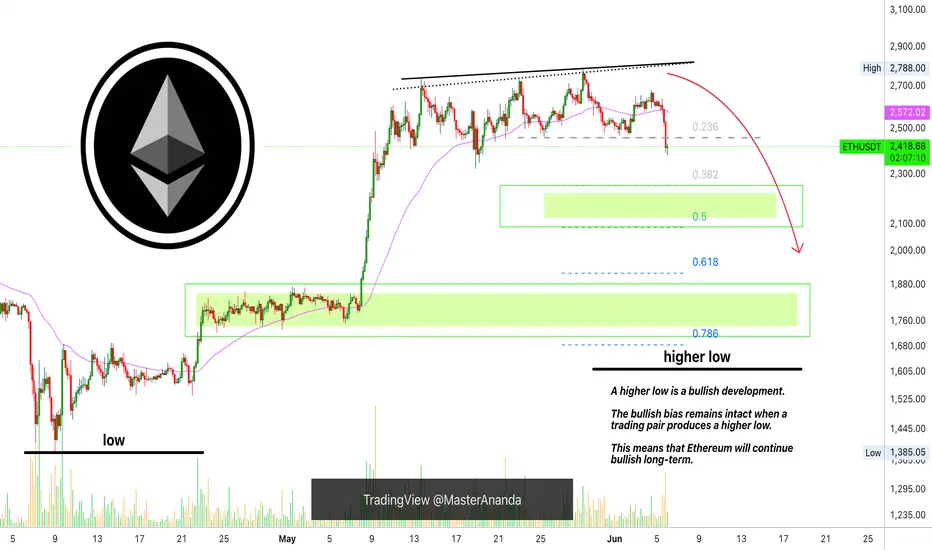
Ethereum: No Sellers, No Bears, No Pressure; Bullish ConfirmedTo put it simple, there is absolutely no selling pressure on ETHUSDT. And this is reasonable, Ethereum is now so cheap that not many people are looking to sell.
Let's dive into this chart and see what we can find.
Spoiler alert: I am no longer bearish on ETHUSDT. "The retrace" simply isn't a thing on this pair. There is no bearish action. Let's read the chart and see what it has to say.
The low 7-April... Ok.
8-May ETHUSDT produced a very strong green candle to break above EMA55 and EMA89. Volume was also high on this date. These levels tend to work as strong resistance and the fact they broke decisively, means that the bullish bias is confirmed and Ethereum isn't likely to move back below again. Whenever there is a drop, these lines will work as support.
The peak soon happened and Ethereum went sideways, it has been sideways in a small phase of consolidation. The lowest point came 18-May. There was a failed attempt by the bears to push prices lower but this ended as a big fail. Ethereum continues strong.
Here we have again EMA55 and EMA89, magenta and blue lines on the chart. These levels remain untested as support which is a signal of strength. While some pairs went down 20%, 30%, 50%, Ethereum's maximum drop has been 14%, now, that's strength.
As seen from the diagram on the chart, we are about to enter the third wave of a bullish impulse. There can be a correction after the third wave ends followed by additional growth.
The break of EMA55/89 as resistance confirms that Ethereum is bullish mid- to long-term. This means 3-6 months of growth.
Once MA200 is broken as resistance, we have at least six months of bullish growth confirmed, this will happen later this month.
No bears means the bulls are in control.
A very small retrace means buyers are strong.
It all makes sense, who would be willing to sell their Ether when there is so much room left for prices to grow?
No one, that is why prices remain strong.
Adapt to market conditions fast and live.
Some pairs are going down while others are going up.
Some pairs are sideways; some are growing strong.
This is the early stage of the 2025 bull-market, just wait and watch... Just watch! It will get wild faster than you think and it will become so wild that you won't be able to handle the market at all. Everything will become so good, so fast, that you will feel blessed for deciding to enter the Cryptocurrency market during April's low.
It is still early though, remember, $7,000 is the minimum price for Ethereum in late 2025. $11,000 is also possible.
Thanks a lot for your continued support.
Namaste.

ETH Road to RecoveryWhile the spotlight often shifts to short-term price action, Ethereum (ETH) is laying the groundwork for structural expansion that could surprise even seasoned investors.

ETH SELL SIGNAL 🚨 ETH SELL SIGNAL 🚨
Ethereum is flashing red on the charts! 🔻
📉 Target: $2496
High-probability setup based on price action + volume dynamics.
Perfect time to lock in gains or short the dip! 💰
Follow for more real-time crypto signals, smart entries, and profit-taking strategies. 🚀
#ETH #Ethereum #CryptoSignals #SellSignal #TradingView #CryptoTrader #Altcoins #ETHAnalysis
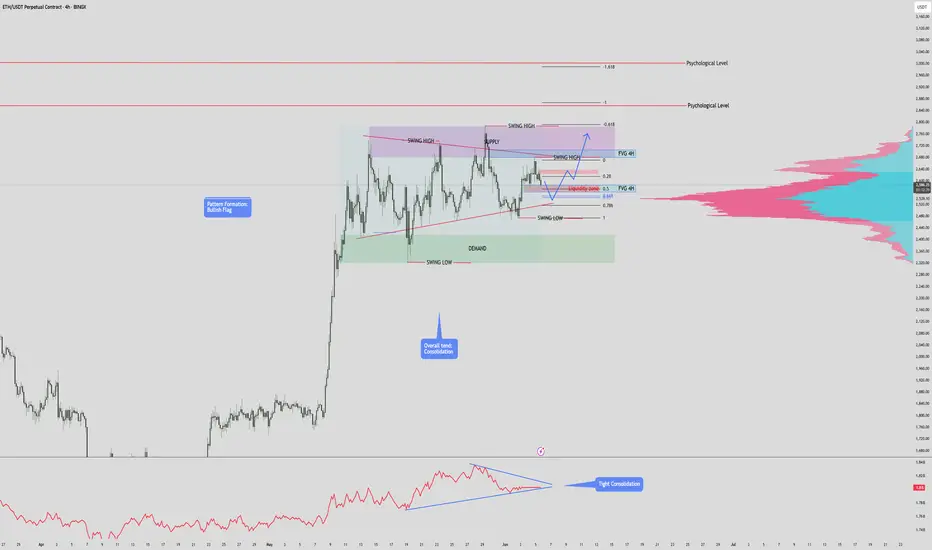
$ETH / USDT – 4H Time Frame Analysis 3,000 INCOMING?? CRYPTOCAP:ETH / USDT – 4H Time Frame Analysis
Structure: Bullish Flag | Outlook: Neutral-Bullish | Target: $3000?
🔹 Chart Overview
-Pattern: Bullish Flag (continuation structure)
Current Range:
- Supply Zone: $2,680.00 – $2,786.21
- Demand Zone: $2,319.79 – $2,417.61
Price Action:
- Tight consolidation between higher lows and lower highs, forming a symmetrical triangle within a flag structure.
Trend:
- Consolidation, but within a macro uptrend (prior strong rally).
Volume Profile:
- Anchored Volume shows high participation around $2,540–$2,600.
OBV:
- Flattening, signaling indecision and potential energy buildup.
Key Psychological Levels:
$2,860: Minor resistance from past S/R flips.
$3,000: Major round-number psychological resistance.
📐 Technical Confluences
Fibonacci Retracement:
- The 0.618 golden pocket aligns with the support trendline, reinforcing this as a critical zone.
Fair Value Gaps (FVG):
- Above Price: Acts as a magnet in bullish continuation.
- Below Price: Risk zone if price drops; aligns with liquidity and trendline support.
- Liquidity Zone: Aligned with 0.5–0.618 retracement; strong reaction expected.
📈 Bullish Scenari o
Breakout of Pennant Resistance:
- A clean break above $2,786 (supply zone & swing high) with volume.
Close above Upper FVG and Liquidity Zone:
- Confirms bullish intent. Targets psychological level at $2,860, then $3,000.
Volume Confirmation:
- OBV uptick and high breakout volume would validate the move.
Bullish Target Zones:
TP1: $2,860 (psych level + previous resistance)
TP2: $3,000 (major psychological level)
TP3: $3,120–$3,180 (1.618 Fib extension)
📉 Bearish Scenario
Rejection from Current Supply or Liquidity Zone:
- Fails to break above supply; rolls over from the upper pennant line.
Break Below Support Trendline:
- Break below golden pocket and $2,417.61 demand zone.
Invalidation of Bullish Flag:
- A breakdown below $2,319.79 (swing low) invalidates the bullish flag and may signal a trend reversal.
Bearish Target Zones:
TP1: $2,200 (local volume gap + structure support)
TP2: $2,060–$2,120 (previous accumulation zone)
TP3: $1,950 (macro support & last strong demand)
✅ Summary
Structure:
- Price is compressing within a bullish continuation pattern, awaiting breakout confirmation.
Bias: Slightly bullish unless the swing low at $2,319 is broken.
Confirmation Needed:
- Break above or below pennant boundaries with volume.
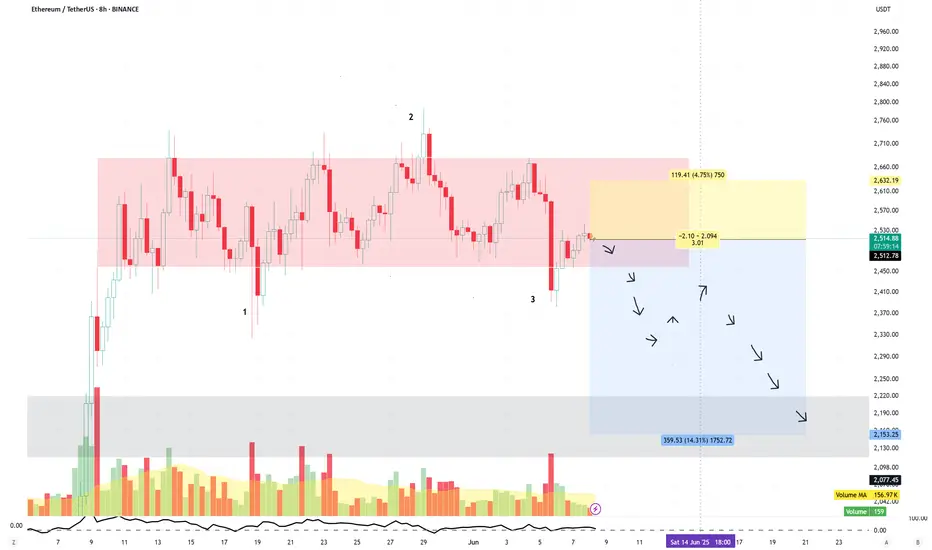
Short ETH
ETH has been consolidating below the key resistance level at $2,700.
On the 8-hour timeframe, price action suggests the formation of a potential distribution schematic 1-2-3.
A short setup is illustrated on the accompanying chart.
Disclaimer:
This analysis is based on my personnal views and is not a financial advice. Risk is under your control.
Ethereum, Guessing The Next Move ($1,500 or $2,000?)The million dollars question; What about Ethereum, lower or recovery?
And this is truly a million dollars question because knowing the answer can make you millions. It can either safe you lots of money or it can make you lots of money.
👉 Ethereum is going lower.
The 18-May low happened at $2,323, and this low wasn't challenged, the drop yesterday ended as a higher low. But, there is something... We lost some important support levels.
ETHUSDT lost the 0.236 Fib. retracement, when this happens, the action tends to move to the next lower-level which is below the 18-May low.
Looking at the 4H TF, ETHUSDT lost EMA55 and MA200, so these are also pointing lower.
Just a few days back I mentioned $2,000 entry LONG opportunity for Ethereum, this price might be possible but it is still really early.
The market has been sideways and this breakdown is new. It would be good to wait for the weekly session close to see what prices we will get, without this information, I can say that it is still too early to say, but I can still make my guess. My guess is that it is going lower.
Thank you for reading.
Namaste.
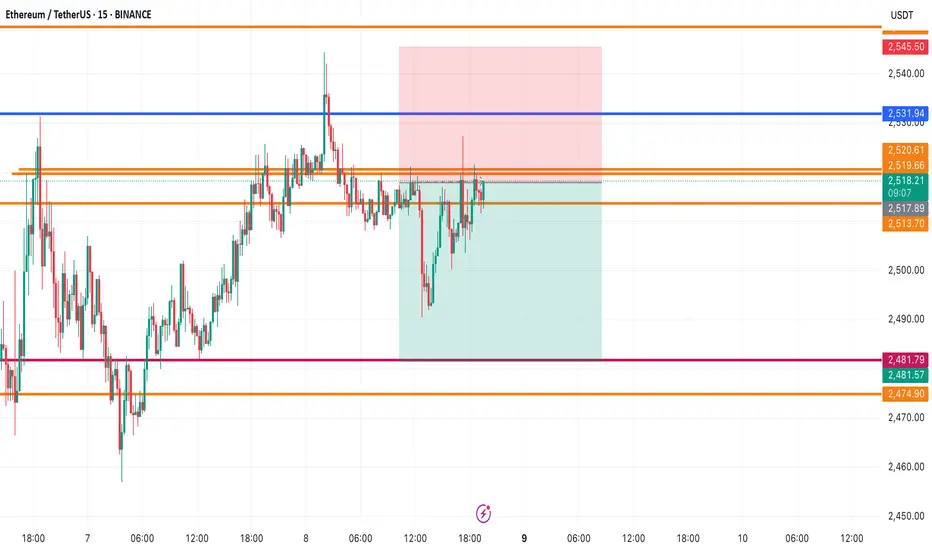
ETH/USDT – Short-Term Bearish SetupETH/USDT – Short-Term Bearish Setup
Ethereum is losing momentum near resistance and showing signs of weakness.
I’m entering a short position, targeting $2,481 in the near term.
🔻 Clean structure, strong rejection – watching for continuation.
📉 Follow for more high-conviction setups and sharp entries!
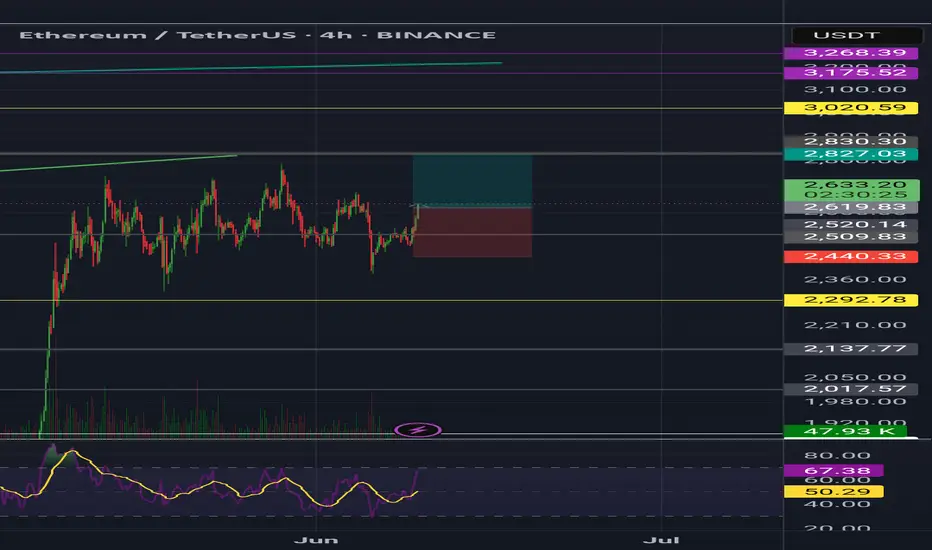
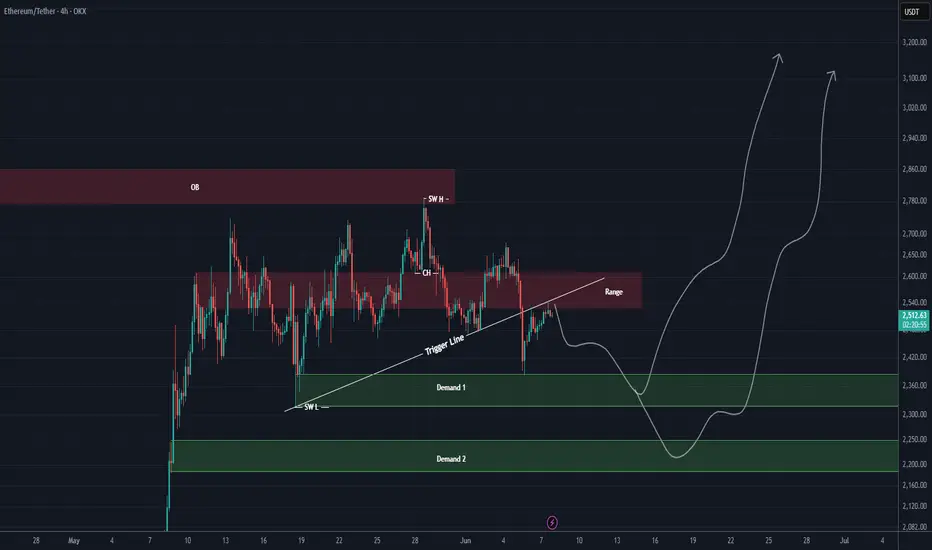
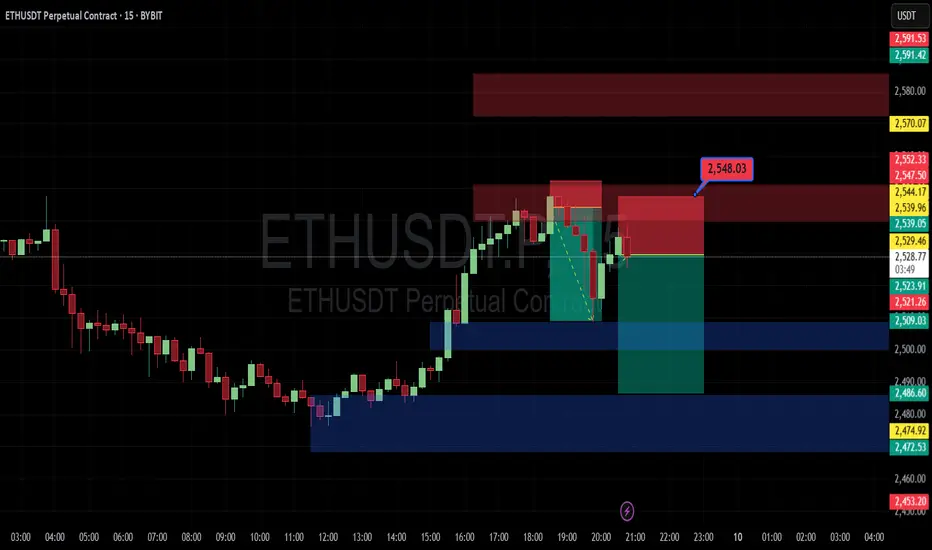
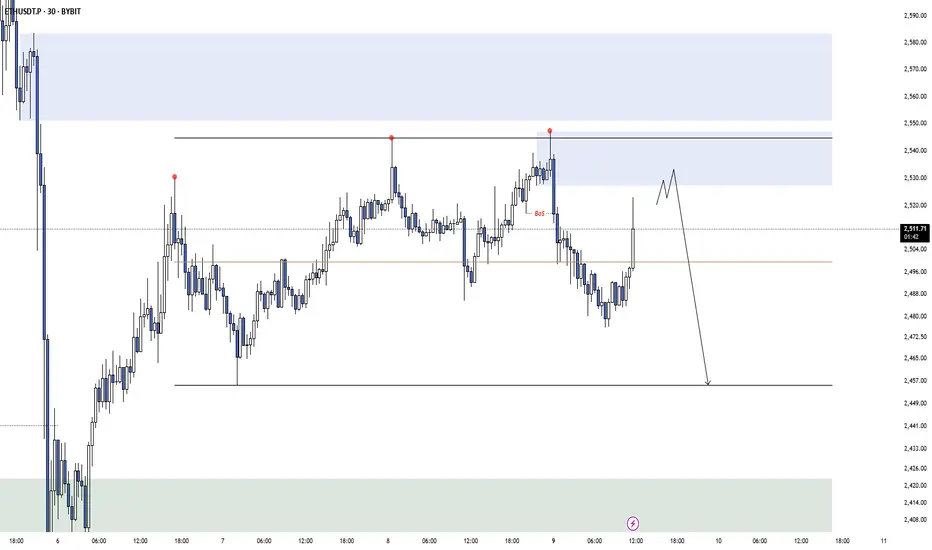
ETH New Update (4H)After being rejected from the higher levels and losing the trigger line, Ethereum now appears to have pulled back into the range zone and the trigger line.
It is expected that the price will be rejected once again from the red zone to the downside, and then turn bullish again from one of the two green zones and move upward.
This is our current outlook on Ethereum. The analysis will be updated accordingly.
Keep in mind that taking short positions in these zones is not low-risk either!
For risk management, please don't forget stop loss and capital management
Comment if you have any questions
Thank You
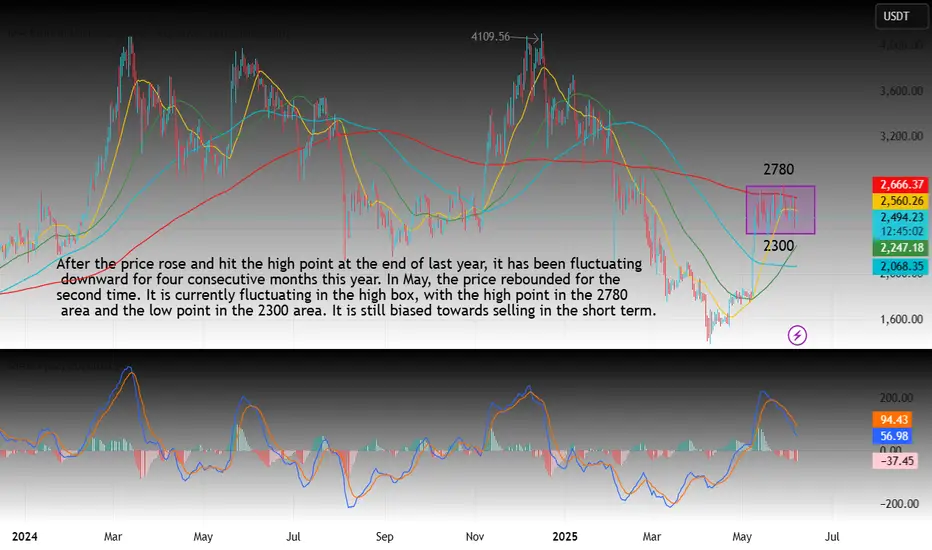
Technical analysis of ETH contracts (outlook for next week)Technical analysis of ETH contract on June 7 (next week outlook):
After the price rose last year and hit the high point of 4170, the weekly level has been fluctuating downward for four consecutive months this year. After the price rose sharply in May, it has maintained a high-level oscillation trend. The K-line pattern is single Yin and single Yang, and there is no signal of breaking; the daily level is still oscillating in the box, with a high point of 2780 and a low point of 2300; although the price is below the moving average, the attached indicator is dead cross, but the strength and continuation are the current problems; then the advantage of price decline in a short time is relatively large, the current high pressure of the four-hour chart and the hourly chart is near the 2533 area, and the low is near the 2450 area; in general, next week, before the price has no obvious break and trend signal, it is still necessary to follow the trend and still treat it as a range of fluctuations;
Ethereum breaking out!Two days ago, I've posted that we're most likely trading in a 2K-4K range on Ethereum. There was a slight deviation below 2K but the bulls swiftly regained control.
As for now, it's seems obvious we are heading towards, at least, 3K. I'm confident 4K is on the horizon, though I prefer to take it level by level.
ETH is breaking out off this bull flag and this chart looks more and more like one of those charts you study in textbooks.

ETH Ascending TriangleETH has formed a clear ascending triangle pattern with a possibility of imminently breaking out to the upside. If rejected, we could see a breakdown to the ~2,300 support and subsequent rebound.
My bias is still bullish. We'll let the market tell us what happens and respond accordingly. Worst case scenario is more boring consolidation.
Stay patient.
Happy trading,
Melonfarmer
ETH/USDT possible breakout and buy continuationThe price hasn't made any new lows and is showing strong signs of buy trend continuation....since it already made a break and return to the zone its a possibility of a nice late trade.
ETH DistributionThere is a potential extended model 1 going over into a model 2 on ETH. I look for entries at this extreme supply. The supply above and the speed its coming up is not optimal so let's see what happens.
HolderStat┆ETHUSD retests 2300 pivotCRYPTOCAP:ETH dips to the 2 300 pivot where Ethereum bulls last ignited upside. Price still hugs an up-sloping guide; reclaiming 2 600 would re-target 2 800-2 900, though the 3 100 sell zone remains the big hurdle overhead.
