ETH ANALYSIS📊 #ETH Analysis : Update
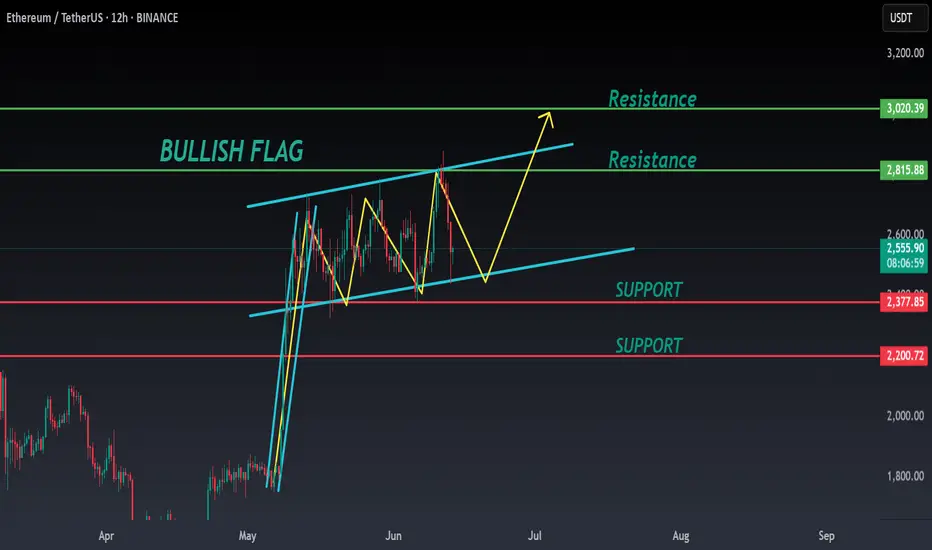
✅As we said earlier, #ETH performed same. Now we can see that #ETH is trading in a bullish flag pattern and its a bullish pattern. We could expect around 10% bullish move if it sustain above its major support.
👀Current Price: $2555
🚀 Target Price: $2815
⚡️What to do ?
👀Keep an eye on #ETH price action and volume. We can trade according to the chart and make some profits⚡️⚡️
#ETH #Cryptocurrency #TechnicalAnalysis #DYOR
ETHUSDT.PS trade ideas
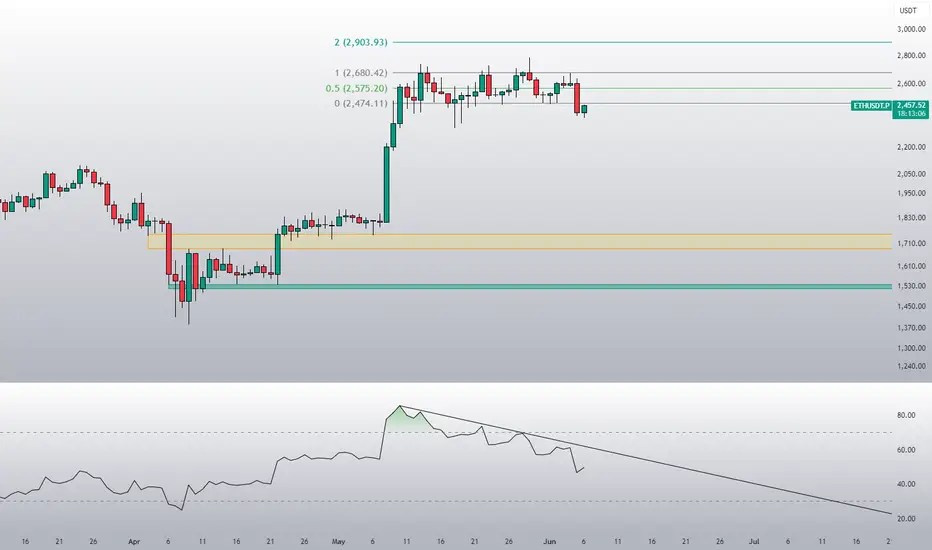
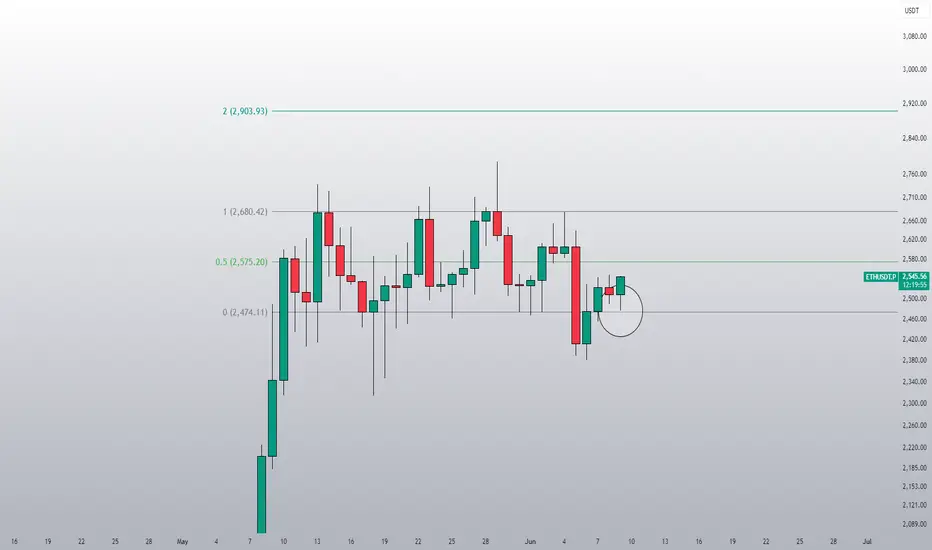
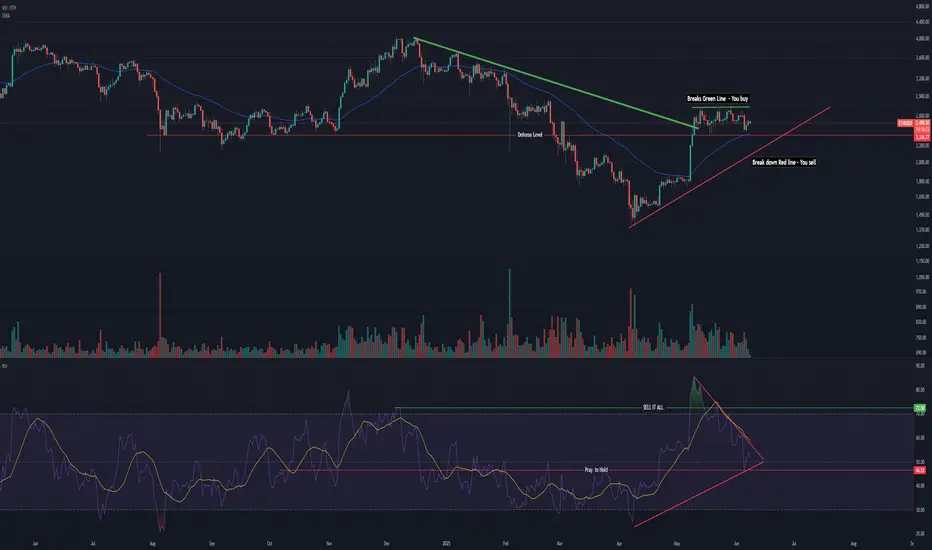
ETH 3D – Between Panic and Balance
When panic hits, zoom out and try to find balance.
ETHUSDT on the 3D timeframe just had its strongest rejection from the 200MA in this rejection series that started on May 13—exactly one month ago.
Price is now once again retesting the 0.5 Fib, continuing the same retesting pattern that began on May 13.
Touching the 200MA often triggers profit-taking from traders.
On the macro side, recent events are causing panic and prompting sell-offs.
Now let’s see if hitting the 0.5 Fib will bring buyers back in.
Looking at the volume bars from the past month, buying volume is increasing while selling volume is declining . This could suggest that in this choppy range, sellers are stepping back while buyers are starting to build strength.
MLR = SMA = BB center, confirming the current sideways environment.
The 50MA hasn’t even started to flatten—it’s still pointing down.
Always take profits and manage risk.
Interaction is welcome.

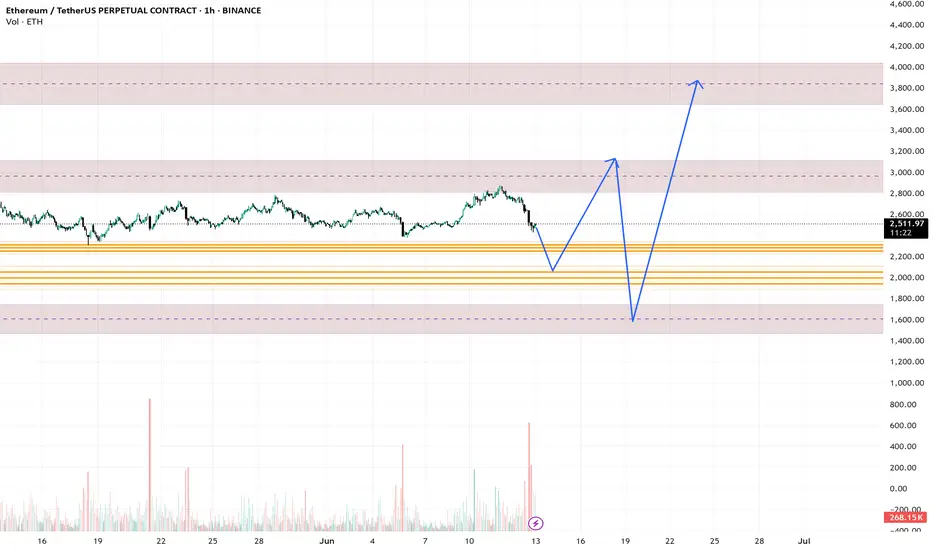
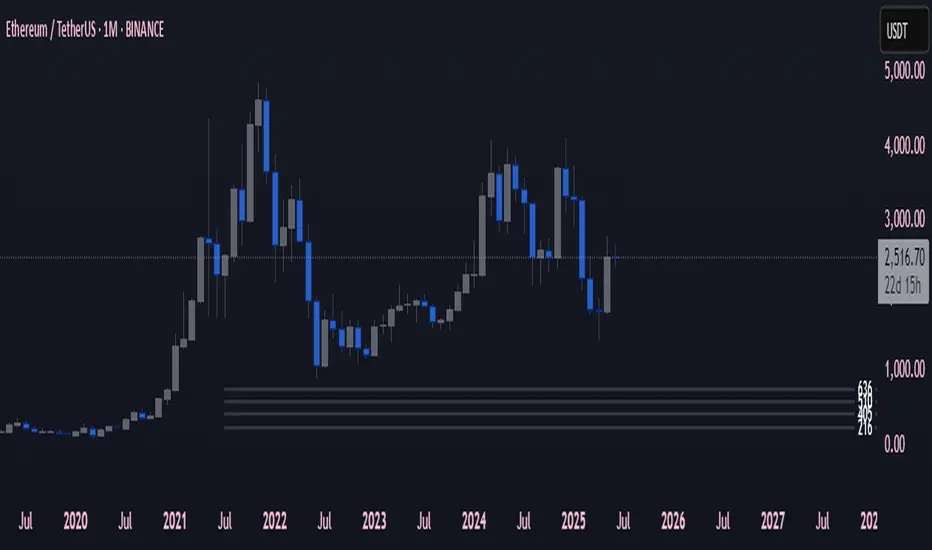
ETHUSDTIt will go to 2000 FVG after consolidating I might go back to 3000.
It probably will not come to 1600. More likely Go to 3000.
ETH - ReTestETH - Break out + ReTest
ETH broken out and Re Testing the previous resistance. Hopefully resistance becomes support!
Up only from here!
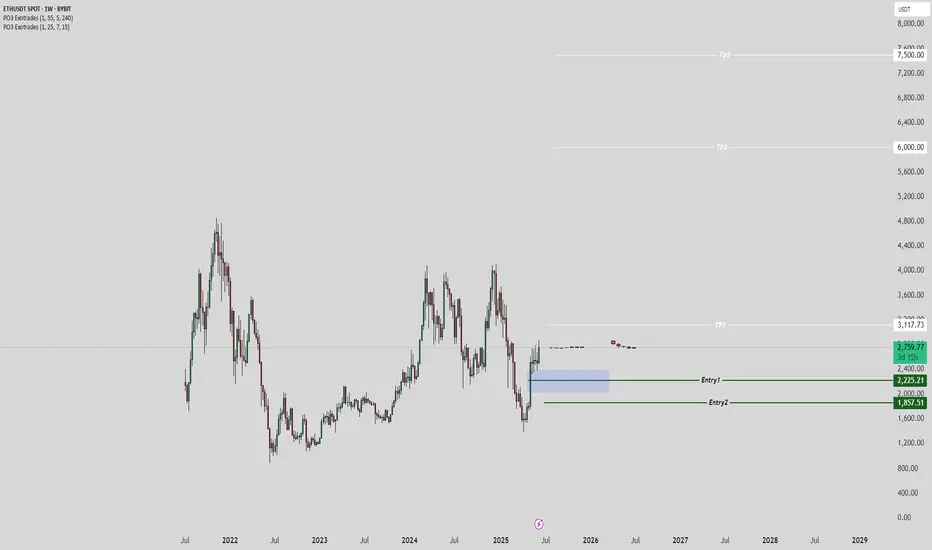
Ethereum's Road to $7500 – Strategic Entries & Profit Optimizati🔵 Entry Zone: My first position is placed at $2225.5, aligning with a strong support level, while a secondary entry at $1857.5 serves as an additional safeguard against unexpected market swings—lowering my average purchase price and protecting capital.
💰 Profit-Taking Strategy: For low-risk traders, securing a 40% profit from the first entry is a prudent move to lock in gains early. However, my long-term target remains ambitious.
🚀 Main Target: Based on valuation models and fundamental news, Ethereum’s upside potential points toward $7500. However, I personally plan to secure 90% of my holdings at $6000, ensuring strong profit realization while leaving room for further upside.
This setup balances risk management, smart positioning, and strategic profit optimization. Let’s see how ETH’s trajectory unfolds!
Entry1: 2225.5
Entry 2: 1857.5
If your second entry is successful, you are required to withdraw 50 to 70 percent of your capital to maintain your capital. I will definitely update this setup.
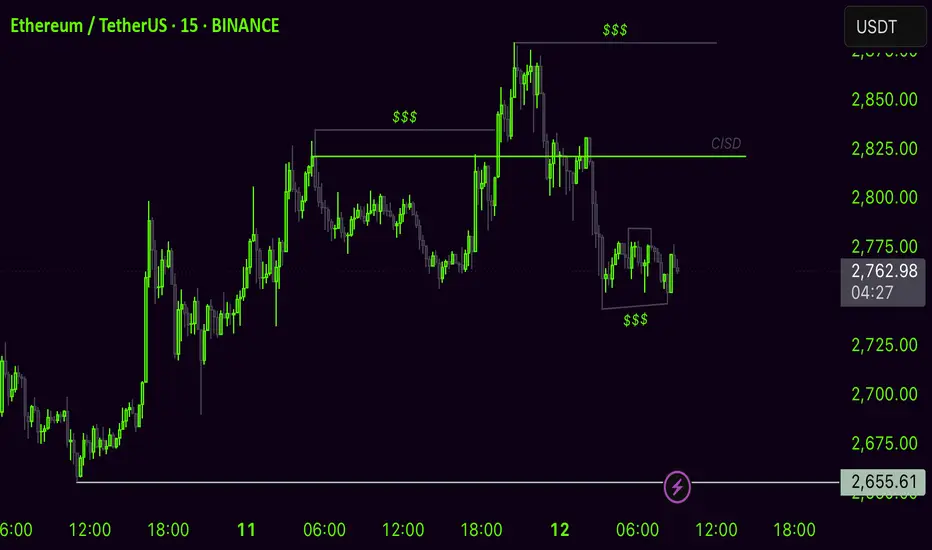
Posible short scalp im seeing on eth Previous High SSL been taken im seeing simple standard deviation on 1HTF
ETHUSD FAV CRYPTOChart is More Detail in description. Road to ATH.
Crypto Adoption being done Globally

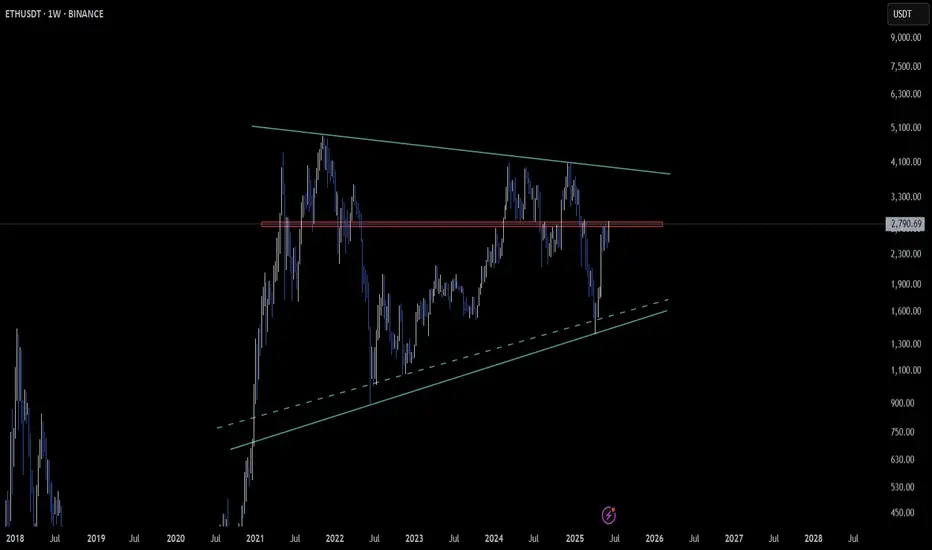
ETH Building a Bullish Base – Weekly Pennant in Play
CRYPTOCAP:ETH is sculpting a bullish pennant on the weekly timeframe 📈, gathering strength for what could be a fresh surge.
Price is consolidating just below the $2800–$2820 zone — a critical area to watch for a breakout and confirmation of a bullish shift.
A decisive move above this zone could open the door for a new wave of upside momentum 🔥.
For now, patience is key: let this weekly structure reveal its true intentions! 🌟
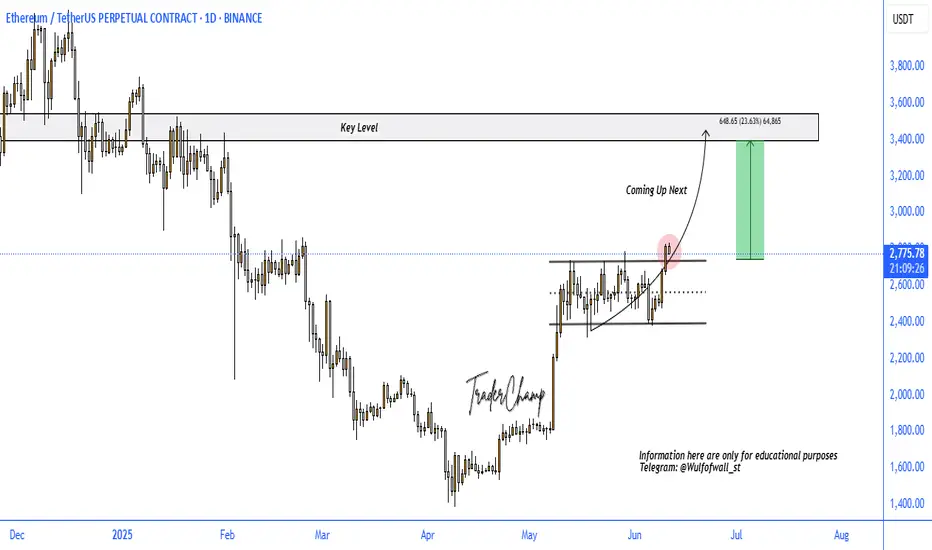
ETH BULLISH SETUPEthereum has recently broken out bullishly on higher timeframes, signaling a potential move toward the key resistance zone around $3,460. This level holds significant technical importance. The breakout above the hourly flag pattern confirms bullish momentum. As long as price holds above $2,300, the setup remains valid. A drop below this level would invalidate the current bullish outlook.
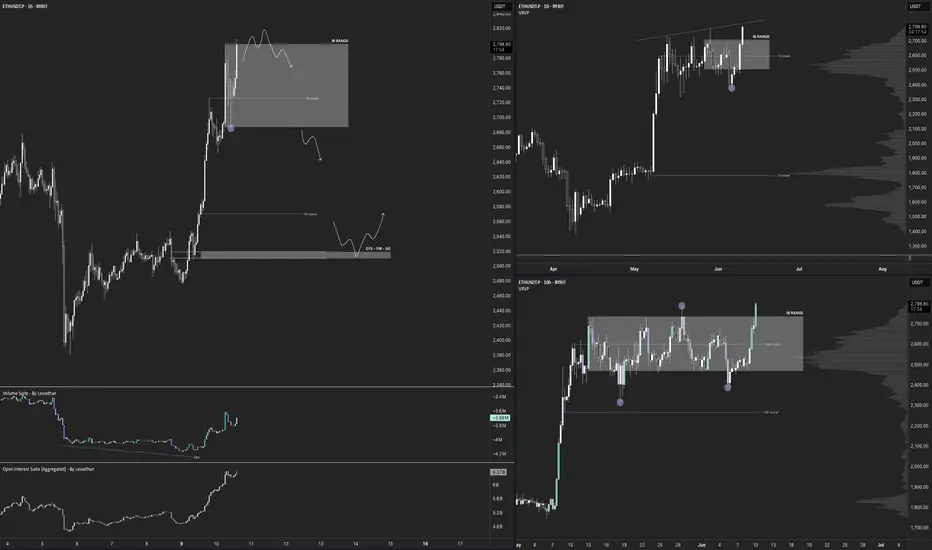
$ETH - Top DownBYBIT:ETHUSDT.P Top Down (10/06/25)
V-Levels Bias
Weekly = Bullish
Daily - Bullish
10-Hour = Bullish
1-Hour = Bullish
V-Levels Momentum
Weekly = Bearish FA
Daily = Neutral
10-Hour = Neutral
1-Hour = IB Range (Neutral)
DeCode Market Breakdown
Macro Context
Weekly Chart
Strong bullish MS, printing clean HHs and HLs.
Price has rejected from the same V-Level multiple times.
Rejections are paired with high relative volume and aggressive selling footprints → indicates strong passive interest above.
This area is not ideal for aggressive long entries.
Daily Chart
Still in bullish structure, holding above key POCs and range lows.
The Failed Auction at IB lows has added fuel for upside momentum.
However, we’re trading right into a potential liquidity pocket just below resistance.
Context calls for a wait-and-see approach: either clear breakout or rejection confirmation.
Intraday Picture (10H & 1H)
10H Chart
Still within an Inside Bar (IB) range.
FA at range lows suggests momentum continues upward — but we are at the top of the range.
Key risk: trap above range highs → ideal area for shorts if we get absorption and selling imbalance.
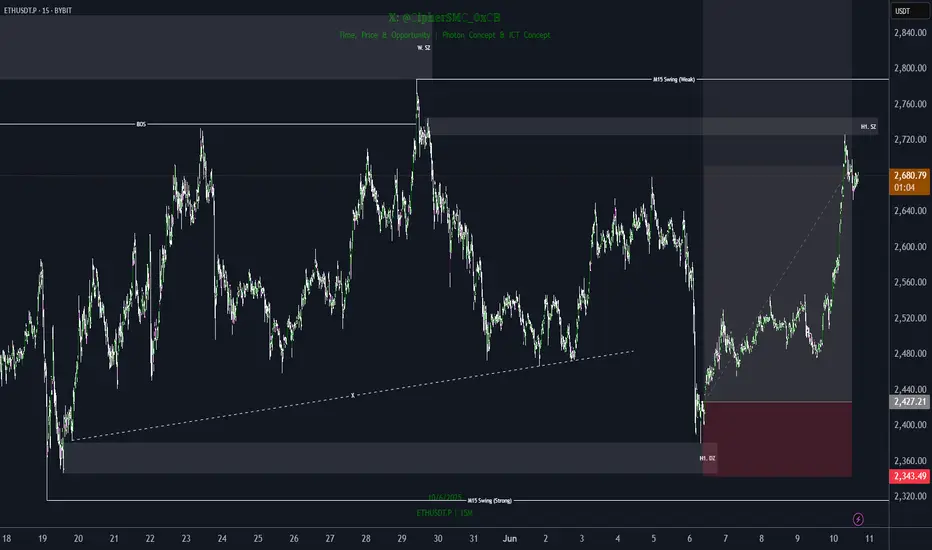
1H Chart
Market is rotating inside the current IB range.
No breakout confirmed yet.
Best short setup: Rejection from IB Highs + Absorption on CVD / Footprint charts.
Breakdown scenario: Short on range low breakdown with volume confirmation.
Longs: Only valid if HTFs confirm breakout → then look for bullish retest or mid-retest entries.
⸻
Summary & Trade Plan
Big Picture: Still bullish, but this isn’t the area to long blindly.
Short Setup 1: Rejection from IB Highs with clear absorption + imbalance.
Short Setup 2: Breakdown below IB Range Lows with volume follow-through.
Long Setup: Wait for HTF confirmation of breakout. If confirmed → retest of prior resistance as support.
Final Notes
This is where traders get chopped. HTF resistance meets LTF momentum.
Let price prove itself. Let volume confirm the move.
No breakout = no long. No trap = no short.
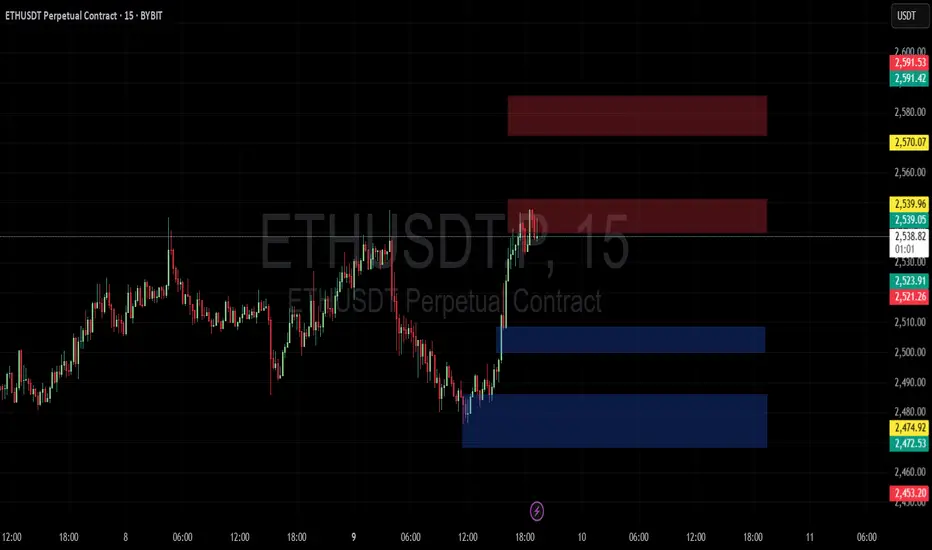
ETH play the boxes (Analyst Crypto Tantrik)📈 Your Strategy Guide: Trade with Confidence! 📉
Ready to elevate your trading? Here's a quick guide to understanding my strategy, designed to help you spot key entry and exit points.
🔵 Blue Zone: Your Bullish Base
* Bullish from blue zone: When the price is in the blue zone, it signals a strong potential for upward movement. Look for buying opportunities here!
* Bearish if breaks out blue zone: If the price falls *below* the blue zone, it indicates a weakening trend. This is your cue to consider bearish positions or exit long trades.
🔴 Red Zone: Your Bearish Barrier
* Bearish from red zone: When the price enters the red zone, it suggests a high probability of downward movement. Prepare for potential selling opportunities.
* Bullish if breaks out red zone: If the price surges *above* the red zone, it's a powerful sign of bullish momentum. This could be an excellent time to enter long positions.
🚀 Key Takeaway: The blue and red zones act as critical support and resistance levels. Understanding how the price interacts with them is key to making informed trading decisions.
Stay disciplined, follow your plan, and happy trading!
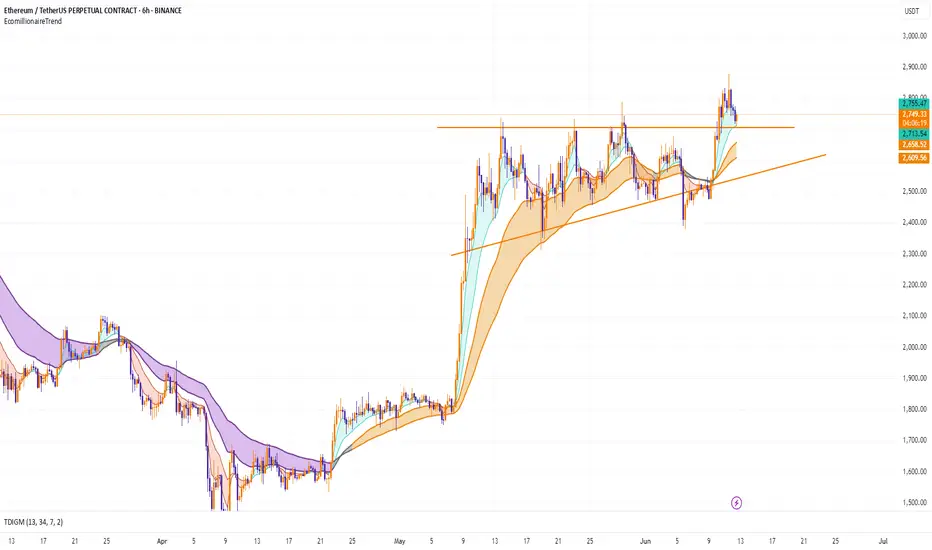
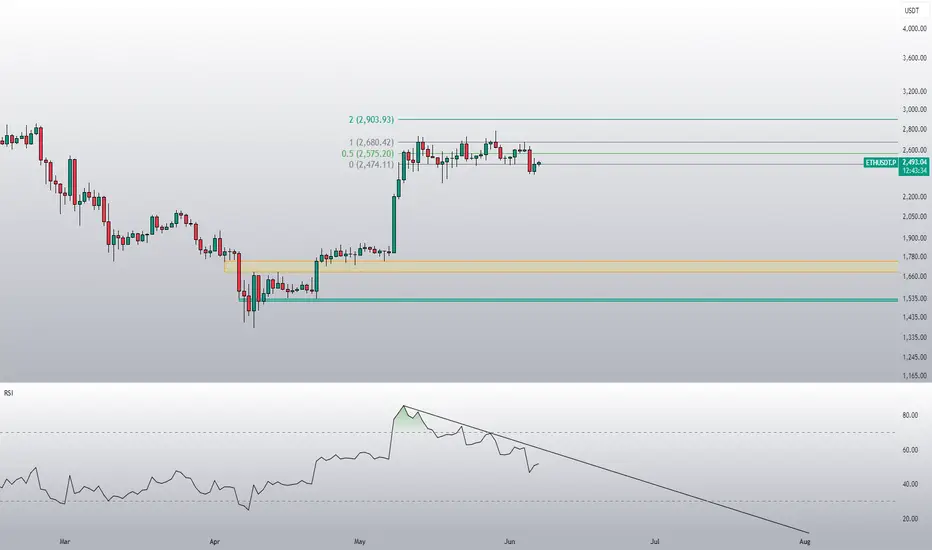
This is a textbook example of price action on ETH!After trading back above it, the price retreated to the lower band of the range. This is exactly the price action we want to see in order to confirm that the break below the range was a fakeout. This suggests that we will most likely see a real breakout above the range at some point, with much upside potential.
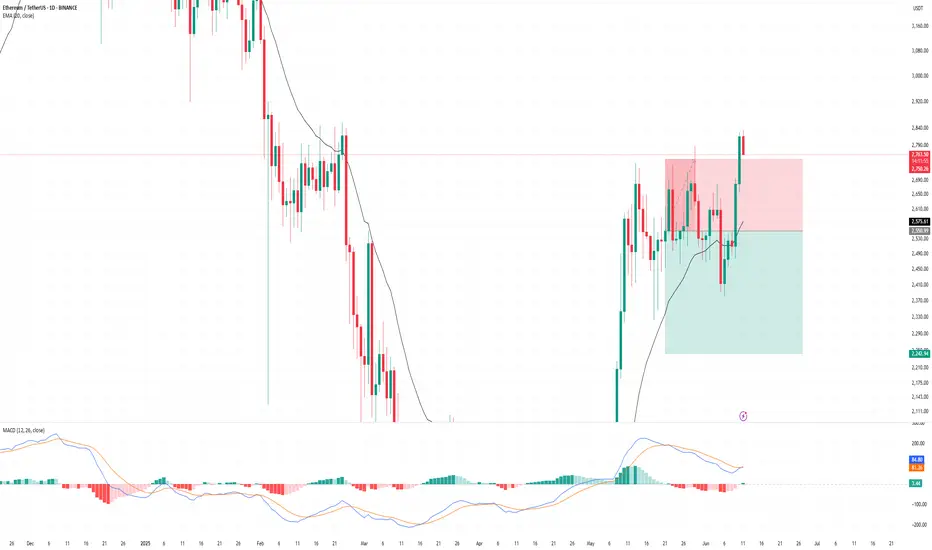
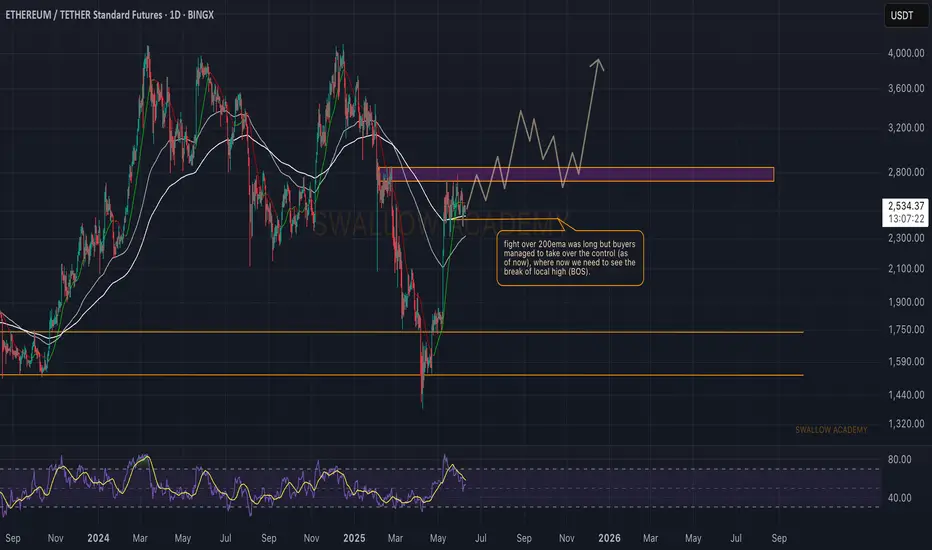
Ethereum (ETH): Fight Over 200EMA | RSI Stable | Bullish AFEthereum is back at 200 EMA, where buyers are not giving the area away so easily, yet sellers still show the pressure. What we noticed was that RSI stabilized here, giving us an opportunity for a proper breakout to happen, which would lead us to our upper targets being reached on a bigger timeframe.
Swallow Academy
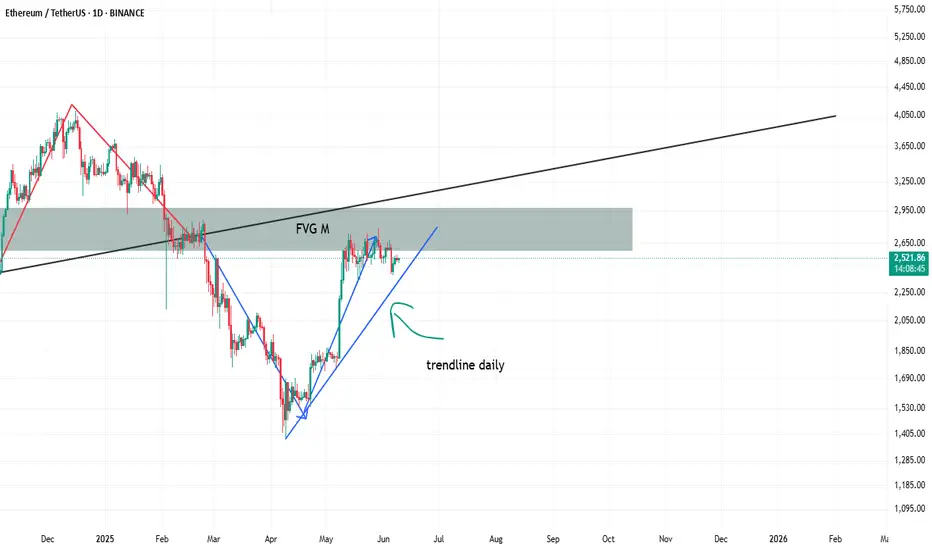
Should i start panicking ?
Man, I really wish I didn’t look at this chart right before bed—this thing looks like it’s straight out of a horror movie.
From what I can tell, we’ve got a monthly bearish inverted FVG lining up perfectly with daily resistance. There’s also a broken trendline on the daily, and right after it snapped, we got that sharp V-shape move, which looks like a classic retest—either of the broken support or the trendline that flipped to resistance.
To add to the bearish vibes, there’s a pretty obvious divergence on the daily chart. That’s not exactly comforting.
Honestly, I’m struggling to find anything bullish here. The only tiny hope is that the price doesn’t break below that daily trendline (the one marked in blue). If it holds, maybe—just maybe—we can reclaim the broken main trendline and turn that resistance back into support.
If anyone out there is deep into crypto and has thoughts on how to approach this kind of setup, I’d really appreciate your take. Could use another perspective right about now.
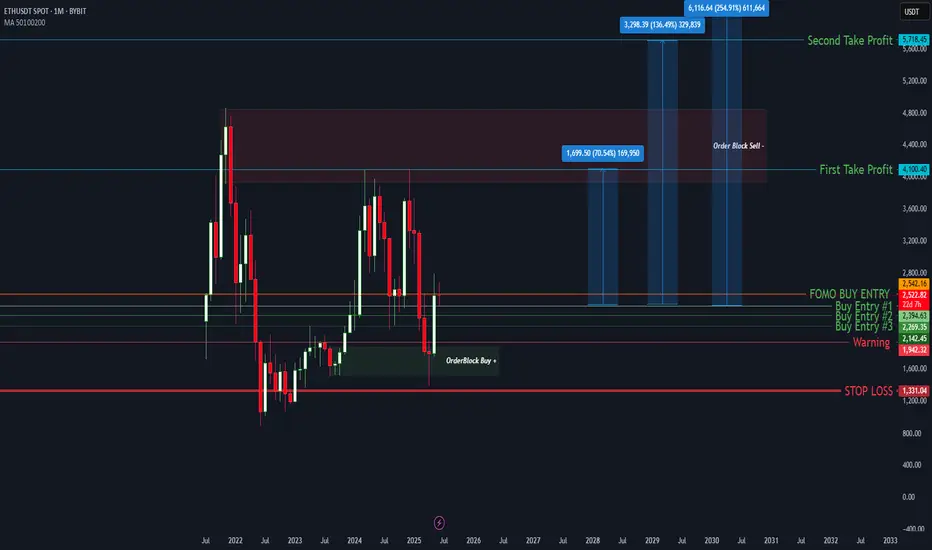
ETH Monthly Masterplan – From Frogs to the Moon 🐸 1. Miracle’s Take – The Legendary Leap Begins!
“Yo yo yo! Miracle here – and ETH just jumped outta the swamps straight into the order block jungle! 🐸💥”
We kissed the Order Block Buy zone like it’s the holy ground of memes 📿
3 Buy Levels hit – frogs were loading while normies were panicking 🤡
Price now chilling near the FOMO Zone – and trust me, most are buying now that it's too late
First target: 4,100 💸
Second target: 5,700+ – That’s where meme dreams start getting real!
Ultimate dream: 6,100+ – That’s a 250% leap... Frogs do fly 😤
💣 But yo, don’t ignore that massive Sell Order Block between 4.1K and 5K.
"Miracle Rule: You don't chase green candles – you trap 'em in green nets." 🎣
🟥 If we fall? Warning zone at 1.9K and hell no below 1.3K – STOP LOSS city 🚨
🐸 “ETH isn’t just a coin. It’s the ticket to meme kingdom.”
🔍 2. Clean Technical Breakdown – Analyst Mode
ETHUSD Monthly shows a textbook rebound from a long-term demand zone (“Order Block Buy”)
Three strong entry levels respected:
$2,142
$2,269
$2,394
Current price is retesting FOMO zone, last seen as local resistance
First Take Profit: $4,100
Second Take Profit: $5,718
Final fib extension target: $6,116 (254% from lows)
“Price must break and close above $2,750 with volume for confirmation.”
A monthly close below $1,942 is a strong warning
Final invalidation at $1,331, where structure is broken
“Respect the order blocks. Trade the levels.”
🎭 Which side are YOU on this time?
📈 Logical Analysis OR 🐸 Meme Mastery?
💬 Type #TeamMiracle or #TeamAnalyst and let the ETH prophecy unfold!
🎬 @TradeWithMky – where altcoins speak louder than Bitcoin!
#ETHtoMoon #EthereumMonthly #TradeWithMky #AltcoinSeason #MemeAnalysis
ETH PLAYGiven the statue of the market, its fair play for any side at this point of the game.
If ETH breaks down, we could see a major sell off for ALTS - itll be hell.
If it flys up, itll be short lived so take profits imho.
Maybe into BTC?
God Bless.
All eyes are on the daily closeA daily close back within the range would look super bullish for ETH.
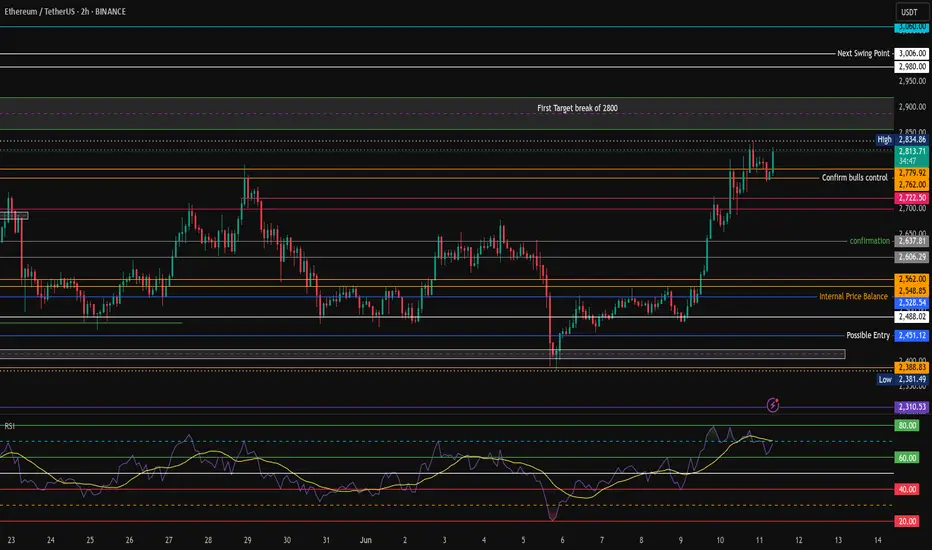
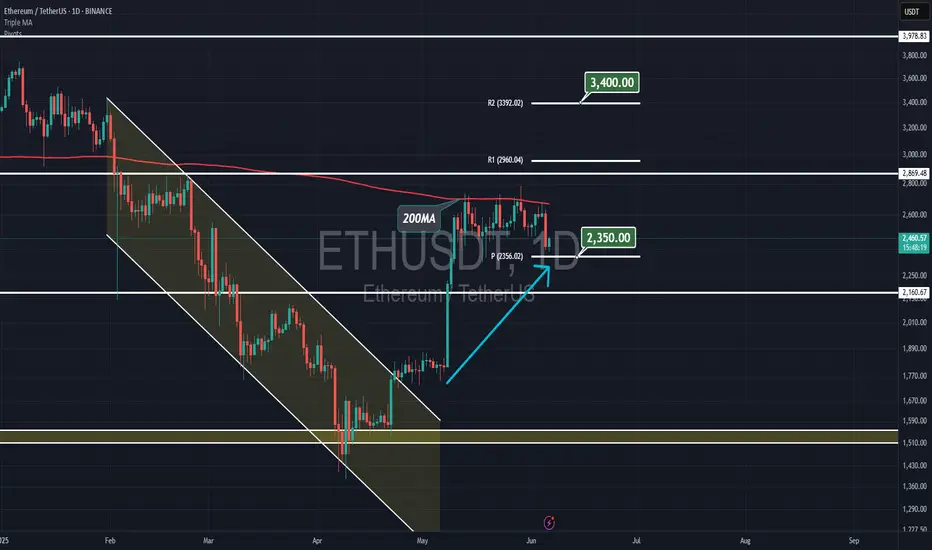
Ethereum & June's pivot supportEthereum price is now playing below the 200 daily MA, but the price about 2350 is the pivot and holding as a support, and I'm expecting to see upside movement in the coming days to about 3400 which is the resistance 2 for the pivot.
Ethereum is still on trackETH might've printed a spot-on "spring" below its daily range. If there's a breakout on the daily RSI, that'll probably be a confirmation.