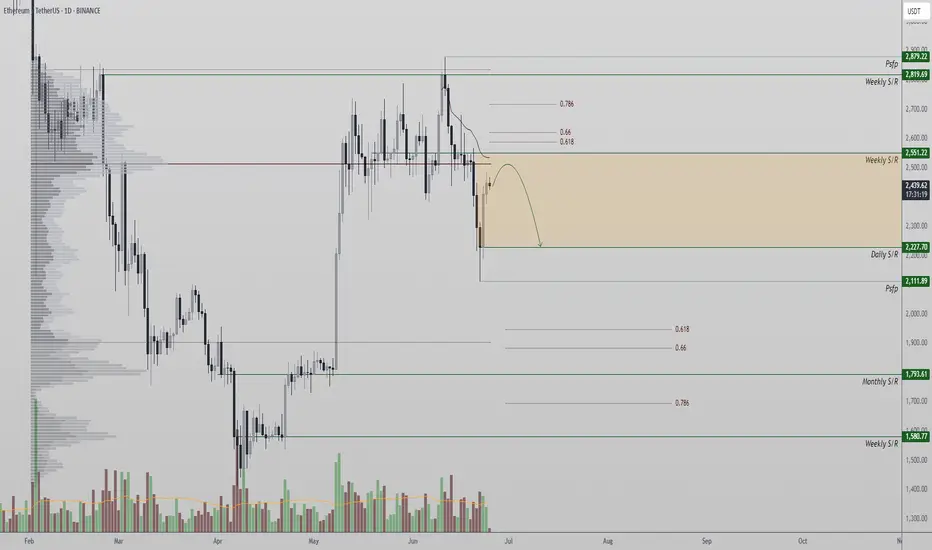
Ethereum at Key Resistance After Short Squeeze BounceEthereum recently found a local bottom at $2,111, triggering a sharp bounce that resembles a short squeeze. However, the rally has met a significant resistance zone—a former support level now flipped into resistance. This zone is technically loaded with multiple confluences: the point of control, the VWAP, the 0.618 Fibonacci retracement, and the $2,550 weak resistance area. Reclaiming this zone is essential for Ethereum to regain bullish momentum.
Structurally, the daily market structure has shifted. The previous trend of consecutive higher highs and higher lows has been broken with the recent drop, signaling a bearish structural shift unless key levels are reclaimed.
If Ethereum fails to break and hold above $2,550, the current move may confirm as a bearish retest, increasing the likelihood of a rotation back to $2,227 in the near term. A loss of $2,227 would open the door for a much deeper correction, targeting the $1,790 support zone—a critical level that acted as a base during previous consolidations.
At this point, Ethereum sits at a pivotal juncture. The reaction at current resistance will determine whether bulls can regain control or if bears will drive the next leg lower.
ETHUSDT trade ideas
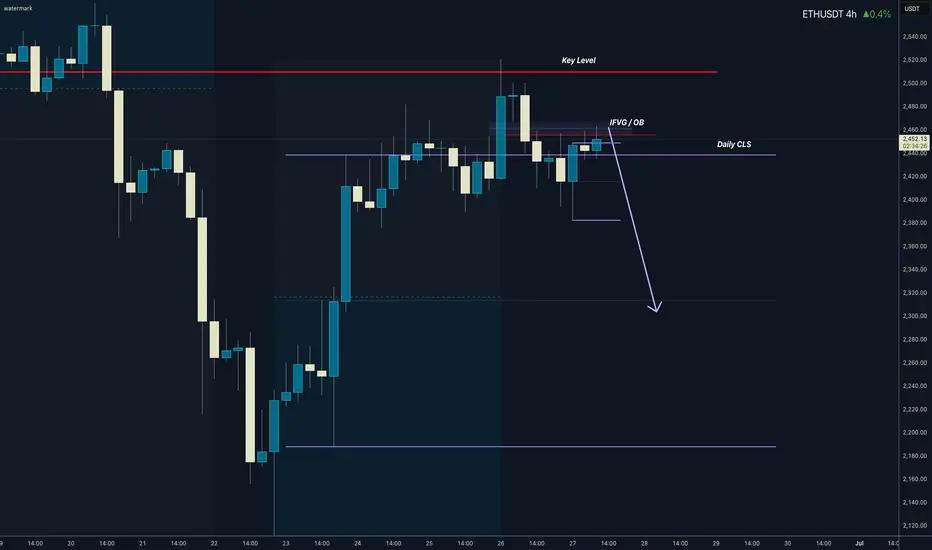
ETHUSDT.P I Daily CLS I KL OB I Model 1Yo Market Warriors ⚔️
Fresh outlook drop — if you’ve been riding with me, you already know:
🎯My system is 100% mechanical. No emotions. No trend lines. No subjective guessing. Just precision, structure, and sniper entries.
🧠 What’s CLS?
It’s the real smart money. The invisible hand behind $7T/day — banks, algos, central players.
📍Model 1:
HTF bias based on the daily and weekly candles closes,
Wait for CLS candle to be created and manipulated. Switch to correct LTF and spot CIOD. Enter and target 50% of the CLS candle.
For high probability include Dealing Ranges, Weekly Profiles and CLS Timing.
Trading is like a sport. If you consistently practice you can learn it.
“Adapt what is useful. Reject whats useless and add whats is specifically yours.”
David Perk aka Dave FX Hunter
💬 Don't hesitate to ask any questions or share your opinions
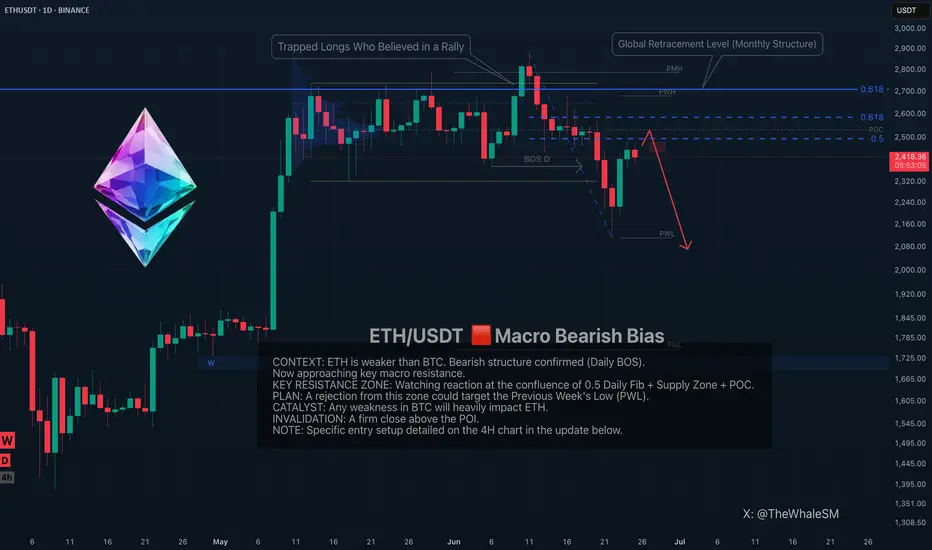
Ethereum's Rally Looks Like a Trap. Here's Why.In this analysis, you will find a clear scenario for a potential short setup with precise conditions for confirmation and invalidation. No fluff or guesswork—only institutional analysis of capital footprints and pure price action. I will provide updates for every stage of price interaction with the POI in near real-time, so you can make timely trading decisions, not just observe events after the fact.
Context
Ethereum's recent sell-off was only stopped from falling into the abyss by Bitcoin's reversal and the trapped shorts that needed to be shaken out. The instrument looks very weak for any sustained growth. The bearish structure was confirmed by a daily Break of Structure (BOS) to the downside and the beginning of a higher-timeframe order flow from the global 61.8% monthly retracement level.
The Resistance Zone to Watch
I expect a little more upside under Bitcoin's influence, after which Ethereum will face the key resistance zone. This area is a confluence of:
The 0.5 Fibonacci retracement level.
The key supply zone that aligns with the range's Point of Control (POC).
A reversal from this zone could lead to a decline to take out the Previous Week's Low (PWL) . The catalyst could be any weakness in Bitcoin, as ETH is clearly weaker (it fell out of its global range, while BTC held its).
I assume ETH won't pass this resistance because many retail traders are trapped in losing long positions above $2700, and there are no significant institutional POIs higher up to justify a price return.
The specific entry conditions are detailed on the 4h timeframe in the Note below.
~~~~~~~~~~~~~~~~~~~~~~~~~~~~~~~~~~~~~~~~~~~~~~~~~~~~~~~~~~~~~~~~~
If you found this analysis helpful, support it with a Boost! 🚀
Have a question or your own view on this idea? Share it in the comments. 💬
► Follow me on TradingView to get real-time updates on THIS idea (entry, targets & live trade management) and not to miss my next detailed breakdown.
► For DAILY watchlists & more assets, find me on X! The direct link is located right under my profile name above ↗️
~~~~~~~~~~~~~~~~~~~~~~~~~~~~~~~~~~~~~~~~~~~~~~~~~~~~~~~~~~~~~~~~~
$ETH: The 1-week chart is an absolute disaster!Once again, I want to make it clear: I’m naturally a bull. But I live in Thailand, far from the noise of influencers shouting "buy, buy, buy!" I’ve learned my lesson—when they scream buy, you get rekt. That’s why I rely solely on the charts.
Charts are just mathematics—they don’t lie. So here’s my honest interpretation of what I’m seeing for Ethereum:
🕐 Daily Outlook
Yes, we might see a few nice bounces in the short term. But if your plan is to hold ETH, you should be paying attention to higher timeframes, especially the weekly.
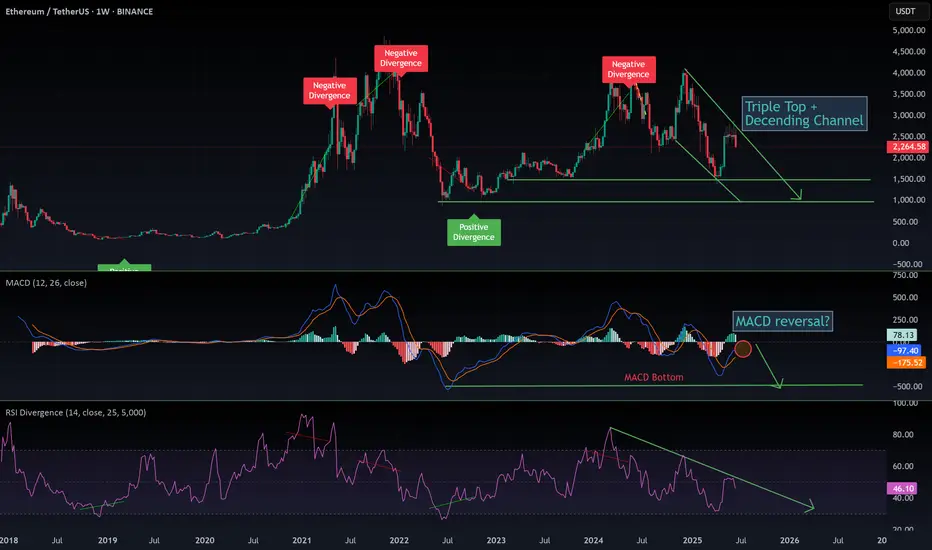
📉 Weekly Chart — It's Ugly
We’re clearly in a descending wedge, and overall, ETH is bearish. Don’t be fooled by the hype or the people trying to take your money.
- RSI is bearish, with a strong bearish divergence still unfolding.
- MACD is on the verge of a bearish crossover, and what’s worse, it’s doing that without even touching the neutral zone—a major red flag.
The last time we saw this setup? November 2021. The price crashed below $1,000.
🔍 Where’s the Support?
This cycle, the support zone looks closer to $1,500, mainly due to institutional interest and the ETF narrative. A full retracement seems unlikely, but technically speaking—it’s still a possibility.
🤔 Why Is This Happening Despite Institutional FOMO?
Here’s the key: ETH has staking, and every month, new CRYPTOCAP:ETH is minted to pay stakers. This creates constant inflation. On top of that, many stakers compound their rewards, accelerating the inflation. And guess what? These same stakers are selling as soon as ETH pumps.
So fundamentally, Ethereum is under pressure because of its own staking mechanics—a system flaw that creates long-term selling pressure.
Do your own research (DYOR). I could be wrong—but at least I’m not trying to sell you a course.
ETH Building Blocks - Keep it Simple🧱 Building Block - ETH Weekly Analysis 🧱
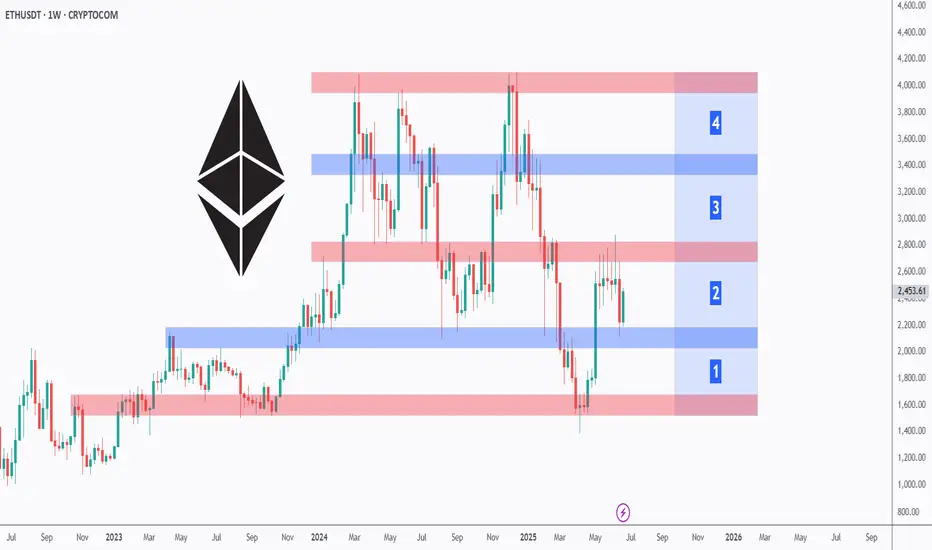
Ethereum has been trading within a well-defined structure, respecting key horizontal zones — each acting as a crucial building block in ETH’s macro journey.
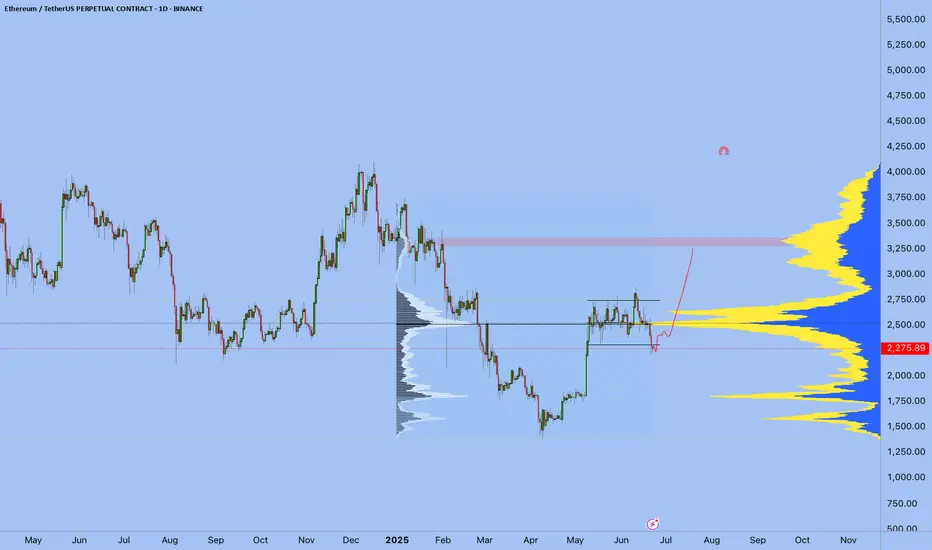
🔹 Zone 1 ($1,700 - $2,100)
A strong demand and accumulation zone. ETH bounced from here multiple times, proving itself as the foundation of the current bullish attempt.
🔹 Zone 2 ($2,400 - $2,600)
We're currently hovering around this key mid-range resistance. A successful break above it would pave the way for the next major leg up.
🔹 Zone 3 ($2,900 - $3,400)
A major historical resistance turned supply area. ETH needs strong momentum and volume to break through this ceiling.
🔹 Zone 4 ($3,800 - $4,200)
The final building block before retesting ATH territory. A retest here could signal full bullish control in the coming months.
📍 As long as Zone 1 holds, ETH remains structurally bullish. Watch for breaks and rejections at each building block to gauge the next move.
Which block will ETH break next? 🔮
📚 Always follow your trading plan regarding entry, risk management, and trade management.
Good luck!
All Strategies Are Good; If Managed Properly!
~Rich
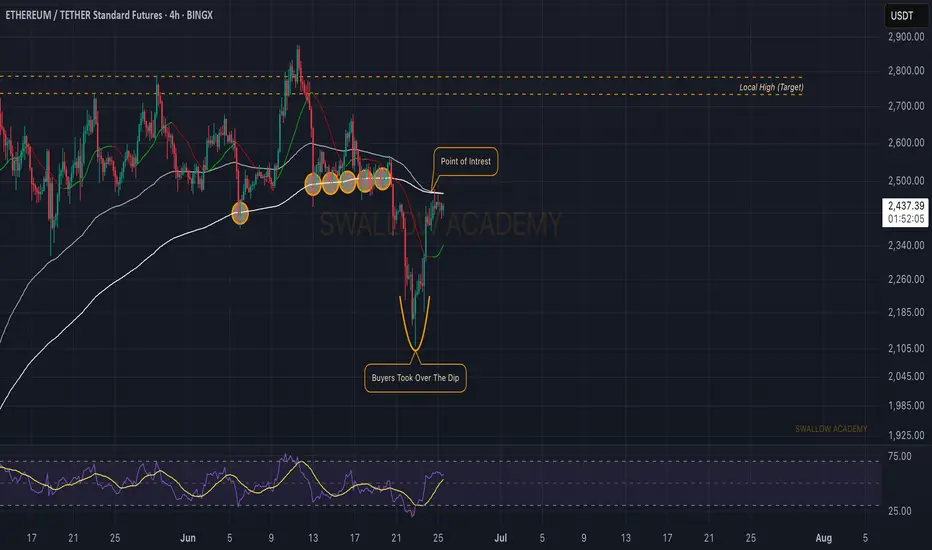
Ethereum (ETH): Buyers Taking Back Control!Ethereum had a nasty fall both on Sunday and Saturday where price dipped from $2500 to $2100.
Despite that movement took place during the weekends it was harsh one and we are expecting osme kidn of re-test to happen towards the local broken area (near 200EMA).
Swallow Academy
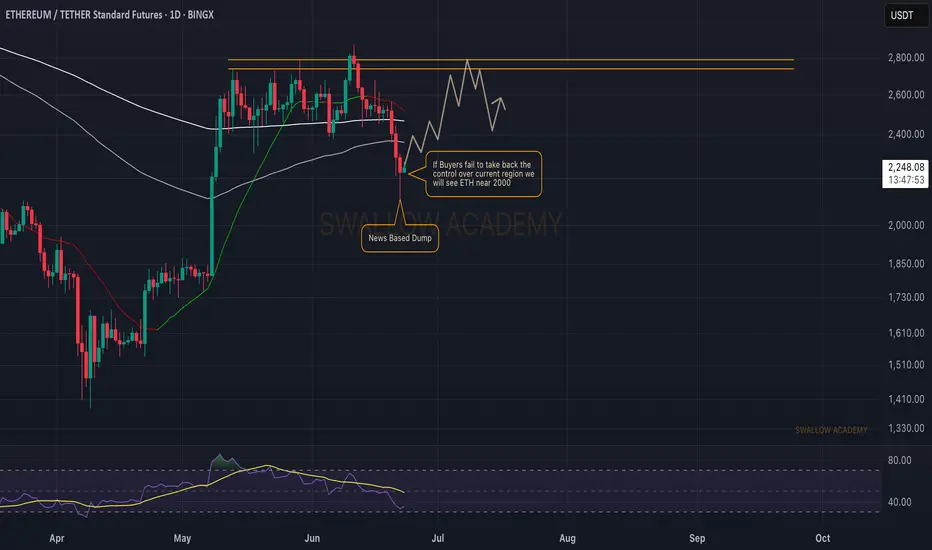
Ethereum (ETH): Buyers Dominating | Going For $3000Ethereum is pushing, and we are back near EMAs and possibly going for another breakout attempt from here.
We are looking for a proper breakout, which would then trigger for us an opportunity for a long position towards the $3000.
Swallow Academy
#ETHUSDT: Currently On The Way Towards Filling The FVG?ETCUSDT is currently experiencing a significant correction as the price approaches a pivotal juncture where a substantial bullish price reversal is anticipated, potentially propelling it to new all-time highs or even surpassing them. It is imperative to exercise meticulous risk management and conduct your own thorough analysis before engaging in any cryptocurrency trading or investment activities.
Should the price indeed undergo a major correction, it is likely to decline to our second designated area, where it is anticipated to fill the liquidity gap and subsequently reverse course, continuing its trajectory towards our established targets.
Please consider this analysis as a secondary influence only, or even solely for educational purposes. It is crucial to conduct your own independent analysis and risk management prior to engaging in any cryptocurrency trading or investment endeavours, as they inherently carry substantial financial risks.
We extend our best wishes and encourage you to trade safely and responsibly.
Should you wish to demonstrate your support, you are welcome to express your appreciation through likes, comments, or sharing this information.
Thank you for your consideration.
Have a pleasant weekend.
Team Setupsfx_

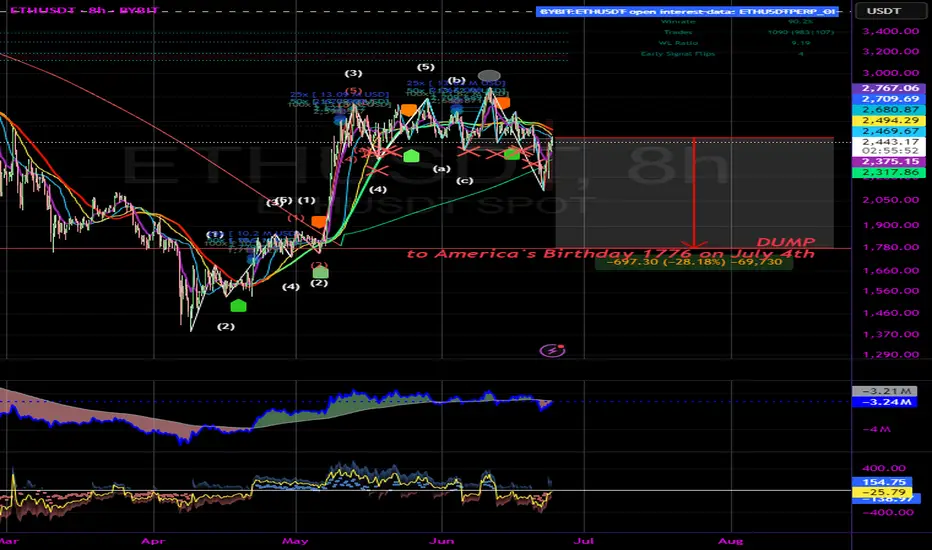
ETH Dumping to 1776 in honor of America's birthdayBART express incoming. Nice liquidity grab down there as well.
Not financial advice.
Happy July 4th!
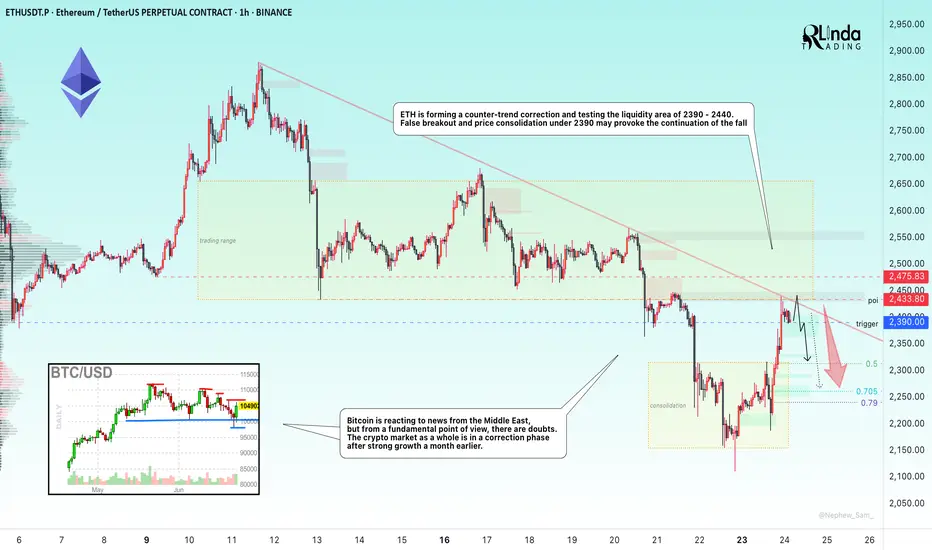
ETHEREUM → Rally and liquidity capture. Up or down?BINANCE:ETHUSDT.P is strengthening following Bitcoin. This is a reaction to developments in the Middle East, namely Trump's comments on peace. But there are doubts...
The crypto market is reacting to the situation in the Middle East, namely Trump's statements about peace. But apart from him, no one else is talking about peace. No agreements have been reached, so the level of risk is quite high.
Another nuance hinting at the general mood in the market: 66% of the largest traders on Hyperliquid are currently shorting crypto — Cointelegraph
ETH, technically, has stopped in the trend resistance zone as part of a local rally in the Pacific session.
If there is not enough potential to break through the trend resistance and the price forms a false breakout of 2390, the local trend may continue
Resistance levels: 2433, 2475
Support levels: 2390, 2313
The inability to continue growth will confirm the fact of bearish pressure (market distrust of the bullish momentum). The past momentum, in hindsight, can be considered manipulation (liquidity capture). Consolidation below 2390 may trigger a decline.
Best regards, R. Linda!
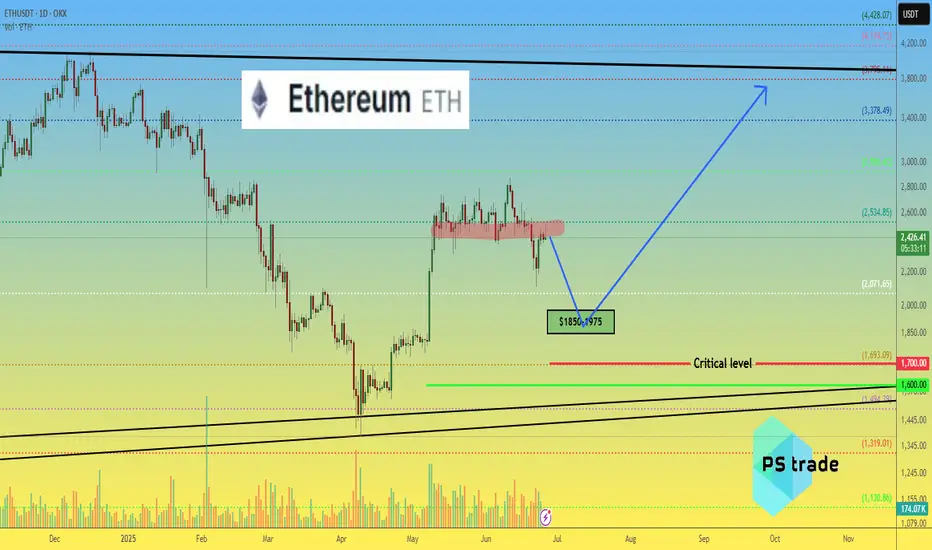
Ethereum ETH price analysis💰 The price of CRYPTOCAP:ETH tested the strength of the bottom support and failed to consolidate above it.
This means that there will be another correction wave
🔥 Considering that #ETHETF is steadily "bying" every day, it would be a good idea for us/you to buy OKX:ETHUSDT in the range of $1850-1975 for investment portfolio before further growth.
👌 And you can also place a “bucket” with a pending order to buy #Ethereum at $1700, and maybe they will even "draw fall" the price at the moment to break all stops.
_____________________
Did you like our analysis? Leave a comment, like, and follow to get more
ETH/USDT High winning scalping signals in 15 minutes are as foll- Signal: LONG
- Admission: 2,436 ~ 2,442
- Take Profit: 2,462, 2,478

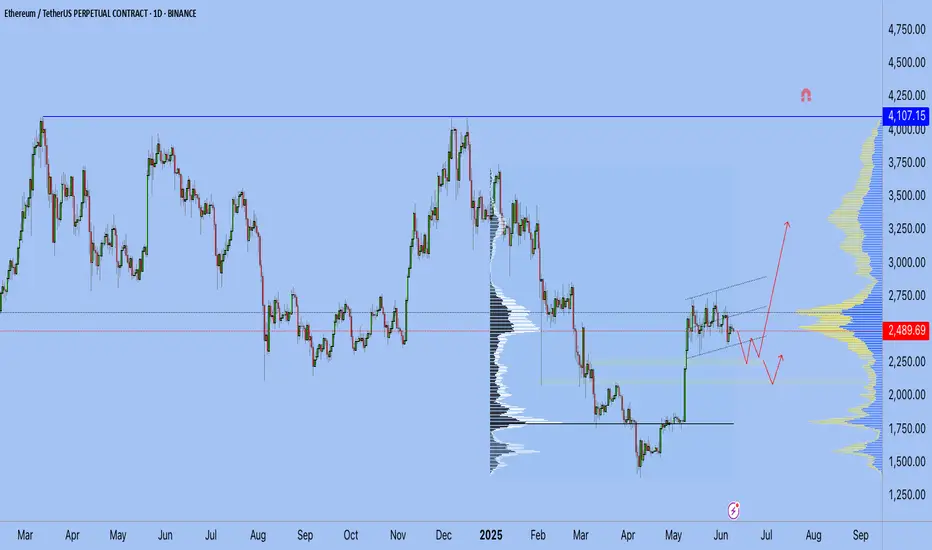
ETH update 9.06.2025Hello everyone, many of you asked me to publish my vision for ETH.
Here you go!
I believe that the previous impulse movement was only the first upward movement, and now we are in a sideways correction movement — call it what you will, but the fact is that the exit from this flat will be upward.
1. End of the year
2. ETH is accumulating on the Onchain
3. Liquidity overflow from BTC can be seen on the ETHBTC chart, and the overflow began at the very bottom
4. What else can large conservative players accumulate?
5. We are going after liquidity from above and should break 4100 by September
Best Regards EXCAVO
#ETH Rebounds on Ceasefire News – Eyes Set on $3100 and Beyond!By analyzing the #Ethereum chart on the weekly (logarithmic) timeframe, we can see that after dropping to $2100, ETH started recovering strongly following the ceasefire announcement, and is currently trading around $2430. If Ethereum manages to close above $2700 by the end of the week, we could expect further upside.
The next potential bullish targets are $2890, $3100, and $4100.
Please support me with your likes and comments to motivate me to share more analysis with you and share your opinion about the possible trend of this chart with me !
Best Regards , Arman Shaban

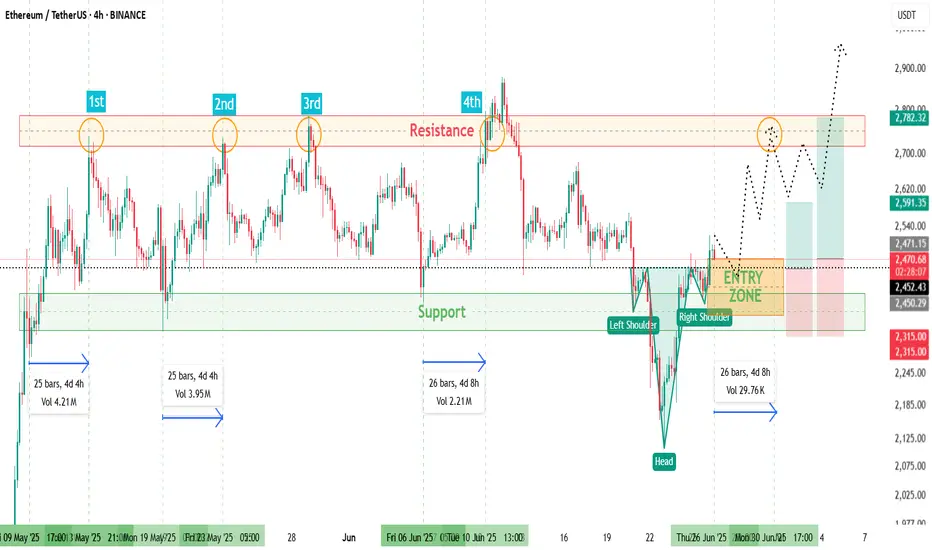
ETHUSD📊 ETH/USD 4H Trade Setup For Long
🔍 Watching an Inverse Head & Shoulders 🫱🫳👤
🔼 Entry: At Fib levels or marked zone
🛡️ Stop Loss: Below support / right shoulder
⏳ Time to Move: ~4 to 5 days from Support ➡️ Resistance
🚪 Tried to break major resistance 4 times
🌍 Geopolitical tensions 🌐 caused pullback
⚡ Now, resistance is weakening —
💥 Breakout likely
🎯 High Risk:Reward setup
📈 Get ready for the move!
DeGRAM | ETHUSD rebound from the support line📊 Technical Analysis
● Bounce off the purple up-trend and 2 320 support printed a bullish engulfing, maintaining the sequence of higher-lows that has guided price since April.
● Price is squeezing into an ascending triangle under 2 700-2 730, where the former wedge cap meets horizontal supply; a break projects to the 3 040 macro fib / channel roof.
💡 Fundamental Analysis
● Net-staking deposits keep rising while, per FXStreet (25 Jun), whales add ETH ahead of the SEC’s spot-ETF S-1 verdict, underpinning demand.
✨ Summary
Long >2 320; triangle breakout above 2 730 targets 3 040. Thesis void on a 16 h close below 2 200.
-------------------
Share your opinion in the comments and support the idea with like. Thanks for your support!

ETH | BULLISH Pattern | $3K NEXT ??Ethereum has established a clear bullish pattern in the daily as we're seeing an inverse H&S:
The war issues across the globe must also be considered. So far, it's been bullish for crypto but this can also change overnight since it's a very volatile situation - and crypto being a very volatile asset.
For the near term, I believe ETH is due for another increase - at least beyond the current shoulder. This is IF we hold the current support zone:
It seems to be a bit of a slow burn with ETH for this season's ATH. In the ideal world, we'd either:
📢 consolidate under resistance (bullish)
📢make a flag (bullish)
📢OR smash right through the resistance.
But there's likely going to be heavy selling pressure around that zone.
__________________________
BINANCE:ETHUSDT

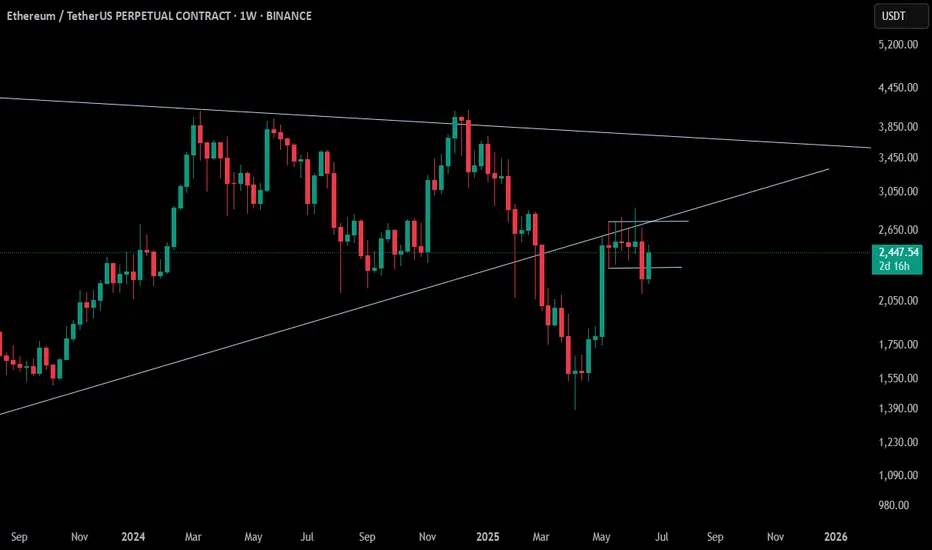
ETH Long.As we can see on the weekly timeframe, ETH made a breakdown after which it consolidated for a while and then made a false breakdown of the zone, now showing a reversal. One can plan to take the long position at the target of the higher trendline.
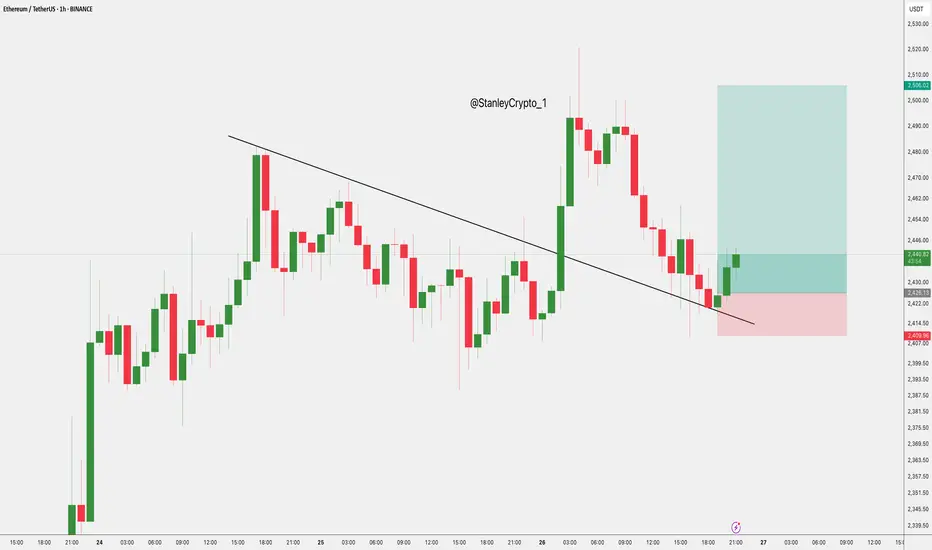
$ETHUSDT 1H Trade Setup CRYPTOCAP:ETH – 1H Trade Setup
- Entry: CMP
- SL: $2,410
- Target: $2,506
ETH broke above the falling trendline and retested it. Clean breakout setup, bullish continuation likely above $2,445.
DYRO, NFA

ETH, hinting of a monster RISE from 2.4k to 4k... SEED NOW!ETH has been the most stubborn pair in comparison to BTC. Its price behavior is almost opposite that of BTCs with unstable volatility the last 2 years -- and thats an understatement.
But from what we know based on its historical movement -- ETH, when it gets into the zone, theres no stopping this sleeping giant to capturing new heights. And that's what we're sensing now with initial hint of BIG SHIFT transpiring this month based on its latest long term metrics.
From our diagram above. Here is what we observed.
LONG TERM MOMENTUM BEAR CLERANCE SHIFT.
FIRST ONE IN 2.5 YEARS! LAST TIME WAS JANUARY 2 2023
Lower highs momentum baselines conveying intense build up ascend pressure.
Precise 78.6 FIB LEVEL TAP. This is where most buyers converge before a BULL SEASON.
From this metric changes, something is definitely evolving. This shift doesnt happen often. It took ETH 2.5 years to repeat this signal, and we got one this month. This is special and it is BIG.
SEED NOW while you can. See you up there at 4k era soon and beyond.
Spotted at 2400
Mid/Long term Target 4k++
Trade Safely. Market is Market.
Not financial advice.
TAYOR.

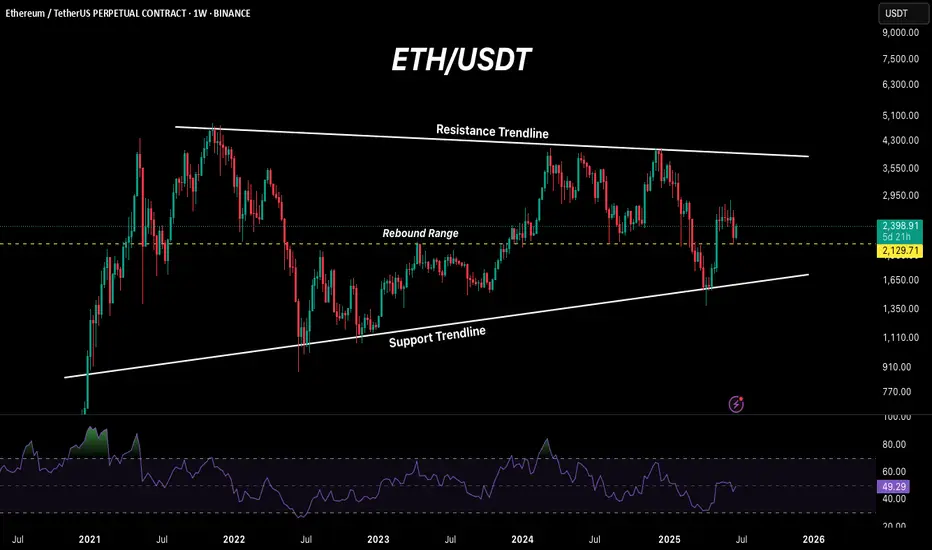
ETH Update: A Possible Rebound!ETH Weekly Update
ETH has formed a support trendline in the $1500–$1600 range and previously rebounded from it with a 90% gain. After a retest, it’s once again showing signs of a potential rebound from the $2100 level.
If this rebound holds, it could bring relief to price momentum, and we may see ETH retesting the $3500 zone. The RSI still has plenty of room to expand, suggesting further bullish potential.
Strategy:
~ Entry: $2100 to Current Market Price (CMP)
~ Accumulation Range: $1500–$1600
~ Trade Type: Spot
~ Holding Period: Q4 2025
~ Target: $3500
Note: Always do your own research and analysis before making any decisions. This is not financial advice.
Regards,
Dexter