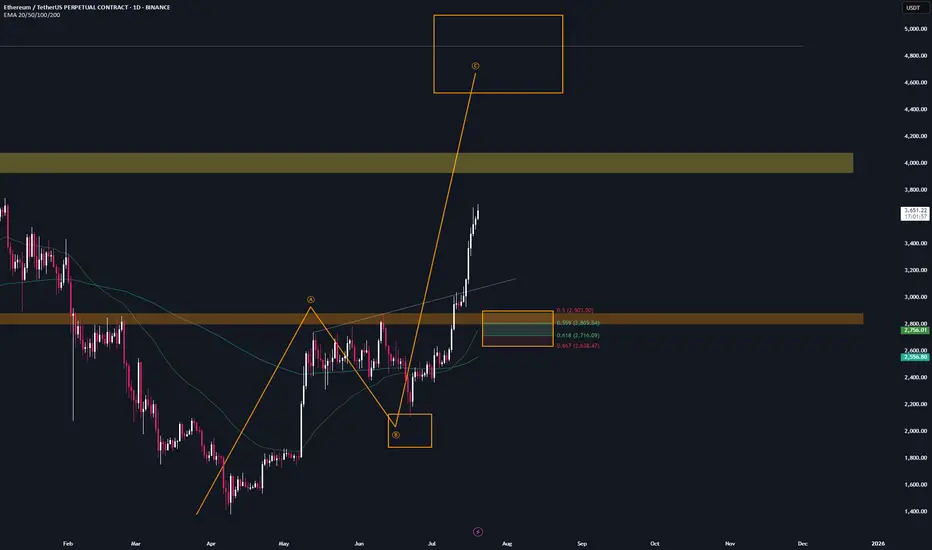
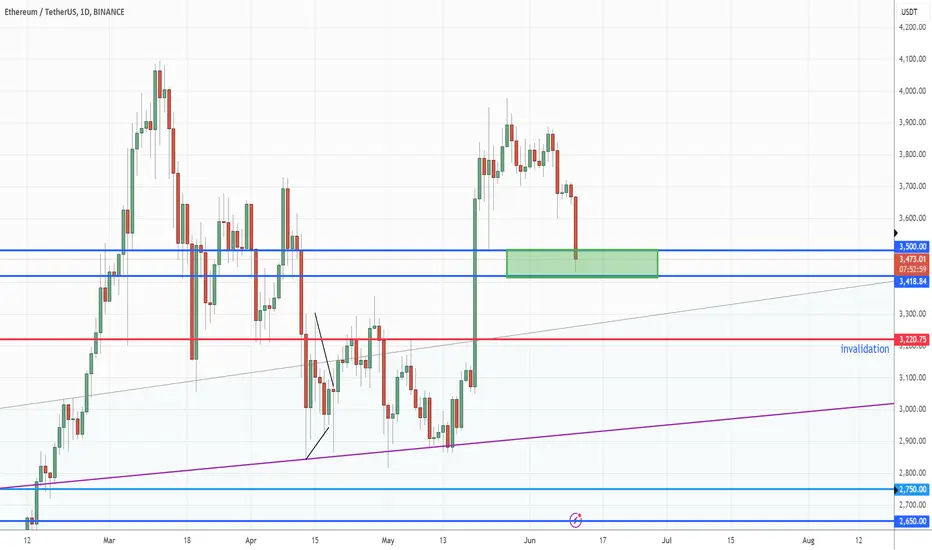
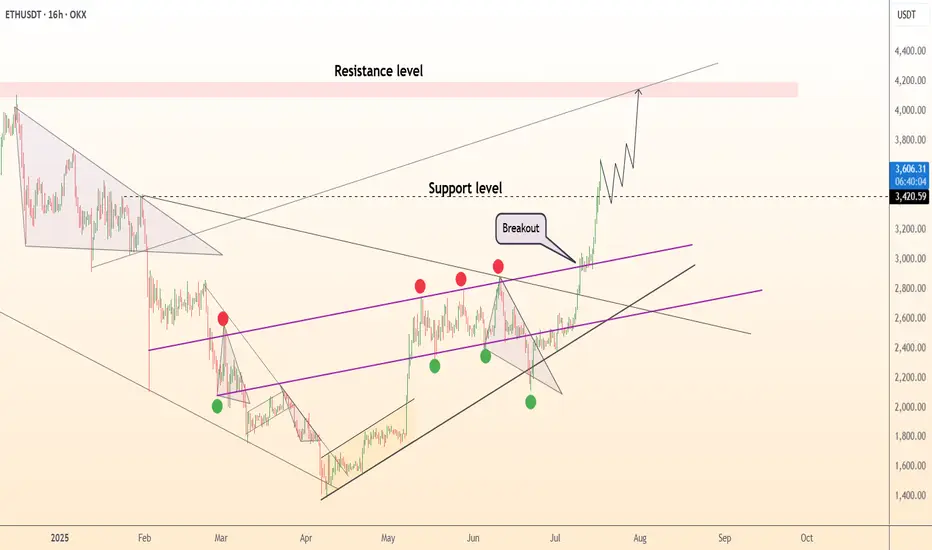
ETH | Trade setup📌 After the breakout from the last high at $2.9k, a bullish sequence (orange) has now been activated.
📊 These setups typically occur no more than twice per year on any given altcoin, so I’ll be aggressively buying each level at the B-C retracement area.
Trademanagement:
- I'm placing long orders at each level and SL right before the next level. (If the price continues climbing, I’ll adjust the trend reversal level (orange) accordingly and update my limit orders.)
- Once the trade reaches a 2 R/R, I’ll move the stop-loss to break-even.
- From a 3 R/R onward, I’ll start locking in profits.
✅ I welcome every correction from here on —
but I won’t enter any new positions at these top levels.
ETHUSDT trade ideas
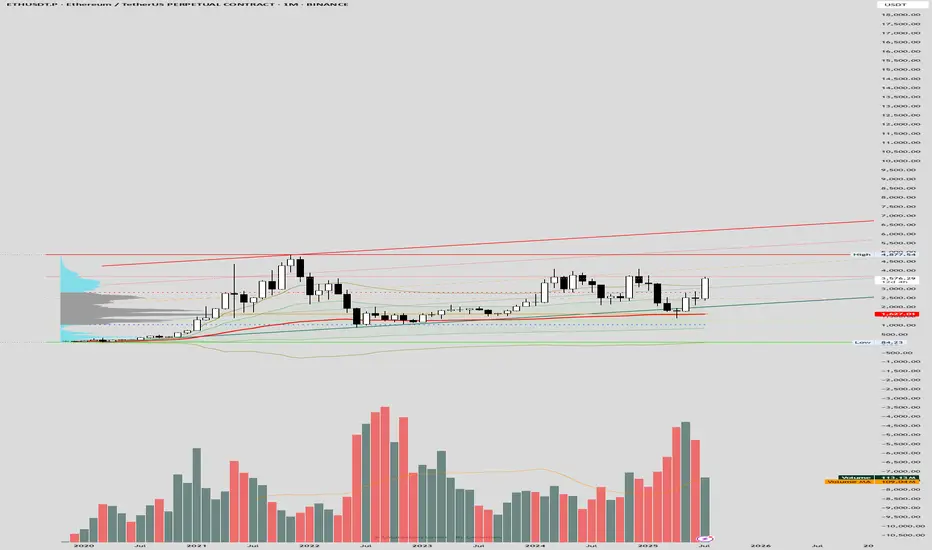
ETH Monthly Chart (AVWAP)The chart highlights a bullish structure with the AVWAP providing key dynamic support and resistance levels. The price has recently approached the upper AVWAP deviation around $4,977.54, aligning with the prior bull flag scenario's resistance zone. The red trendline indicates a potential upper boundary, while the green and orange lines suggest intermediate supports and resistances, with the current price near $3,579.48 testing the middle range. The lower AVWAP deviation near $842.23 serves as a critical invalidation level. Volume remains supportive, with spikes corresponding to price movements, and the volume moving average (109.4k) indicates steady activity.
Real-time data shows ETH trading at $3,565-$3,600, consistent with the chart's mid-range levels, driven by ETF inflows and on-chain activity. A breakout above $3,700-$4,000 with increased volume could target $3,834-$4,000 or higher, while support at $2,533-$2,700 remains vital. Sentiment on X and web sources is optimistic, though volatility persists due to external factors.
ETH Monthly ViewThe monthly chart suggests a potential bull flag pattern, with a strong upward trend followed by consolidation. The "Vector Candle Gap" indicates a breakout zone around $4,977.64, with recent price action testing resistance near $3,700-$4,000. Volume trends support the bullish case, showing increased activity during the initial rise and consolidation. The moving average reinforces an upward trajectory, but a downward-sloping trendline and support at $933.19-$2,800 suggest invalidation risks if the price drops below these levels.
Real-time data shows ETH trading at $3,565-$3,600, bolstered by institutional inflows into spot ETH ETFs and on-chain activity. The bull flag aligns with a potential target of $3,834-$4,000 if the breakout sustains with strong volume. Key support lies at $2,533-$2,700, with sentiment on X and web sources remaining optimistic, though volatility persists due to macroeconomic and regulatory factors.

#ETH look for the false breakoutany false break out to the area of
2400-2500
will be a good buy sign with stop below 3200 and target 4300
trade safe and follow me 😉
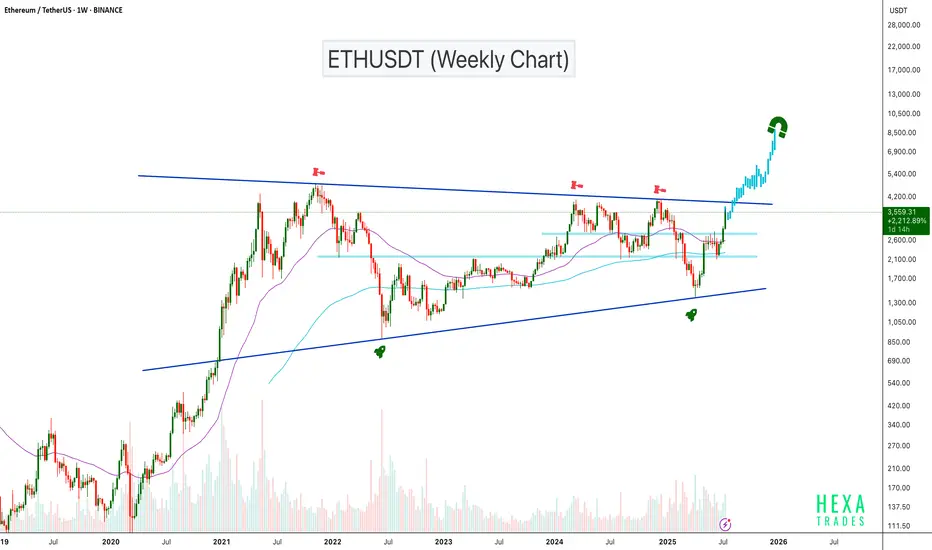
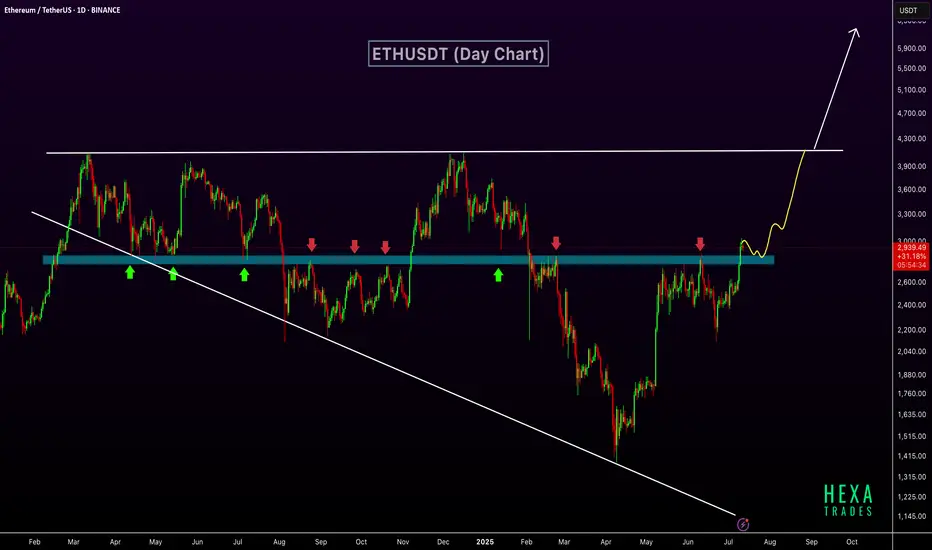
ETHUSDT Gearing Up for Explosive MoveBINANCE:ETHUSDT has been trading inside an ascending triangle pattern for the past 1,600 days. The price is now moving toward the triangle's resistance zone with strong volume support. A confirmed breakout above this resistance could trigger a powerful bullish move, with potential targets in the $6,000–$8,000 range.
Cheers
Hexa🧘♀️
BITSTAMP:ETHUSD
Best Buy Entry for EthereumIn my opinion, if Ethereum is going to make a minor pullback, the best entry zones have already been marked with arrows on the chart.
However, if the price continues upward without a correction, we should wait for clear confirmation, as the bullish momentum appears weaker compared to the previous move

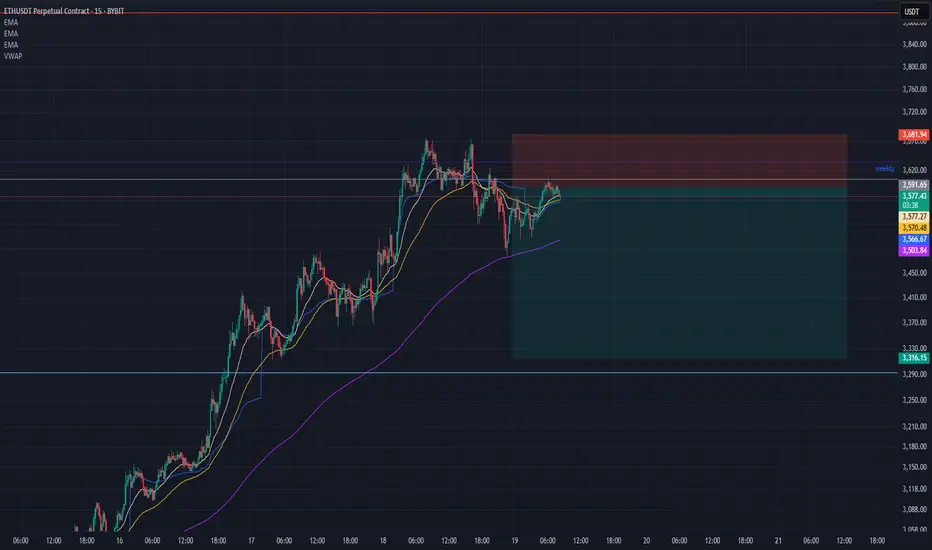
ETH SCALP SHORT RR 3:1 Ethereum just hit weekly level with two 15min lower high and lower low. Rules are telling us to not short against trend, but there can be hedge for long positions.
I don't ask to trade more then 0.5 % capital per trade.
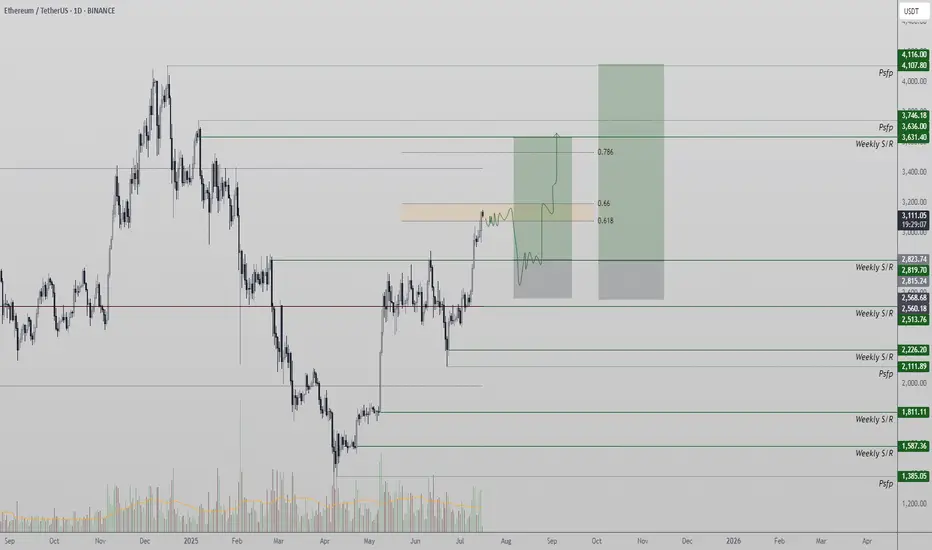
Ethereum Hits Golden Pocket Resistance — Rejection or Breakout?Ethereum (ETH) is facing a pivotal moment as it trades directly into the Golden Pocket — a Fibonacci zone widely recognized for its strong influence on price behavior. As ETH reaches this resistance, traders are watching closely to determine whether a rejection will lead to a bullish retest at lower levels, or if a breakout will confirm continuation toward much higher targets. The next few days will be key in defining the near-term trend.
- Golden Pocket Resistance: Ethereum is trading at the 0.618–0.65 Fibonacci retracement zone, a historically reactive level.
- Bullish Retest Zone at $2,800: A rejection could lead to a healthy high-low formation at this support.
- Upside Target at $3,600: A breakout above the Golden Pocket would likely accelerate the move toward this high-time frame resistance.
Ethereum’s current price action has entered a region of significant resistance: the Golden Pocket, which lies between the 0.618 and 0.65 Fibonacci retracement levels. This zone often acts as a strong inflection point, either halting price momentum temporarily or confirming a breakout with strong follow-through.
Should Ethereum face rejection from this zone, price could rotate back down to the $2,800 region, which now aligns with a key support structure and potential bullish retest zone. This would allow for a higher low formation, reinforcing the uptrend and setting the stage for a long opportunity targeting previous highs.
So far, no rejection has occurred, but if it does, it will likely be seen as a buy-the-dip opportunity for traders aiming to re-enter the trend. This would also mark a textbook retracement within a bullish market structure.
Alternatively, if Ethereum breaks above the Golden Pocket without rejection and consolidates above it, this would be a strong bullish confirmation. In that scenario, the next likely destination is the $3,600 high-time frame resistance, a key level that has previously acted as a major barrier.
Volume and candle structure over the next few sessions will offer key signals — a strong impulse with follow-through would favor the breakout scenario, while weak closes and rejection wicks would support the retracement idea.
Ethereum is at a make-or-break level. A rejection from the Golden Pocket could lead to a healthy correction toward $2,800, offering a long setup. However, if ETH breaks through this resistance with strength, a rally toward $3,600 becomes the high-probability scenario. The next move will likely define Ethereum’s short-term trend.
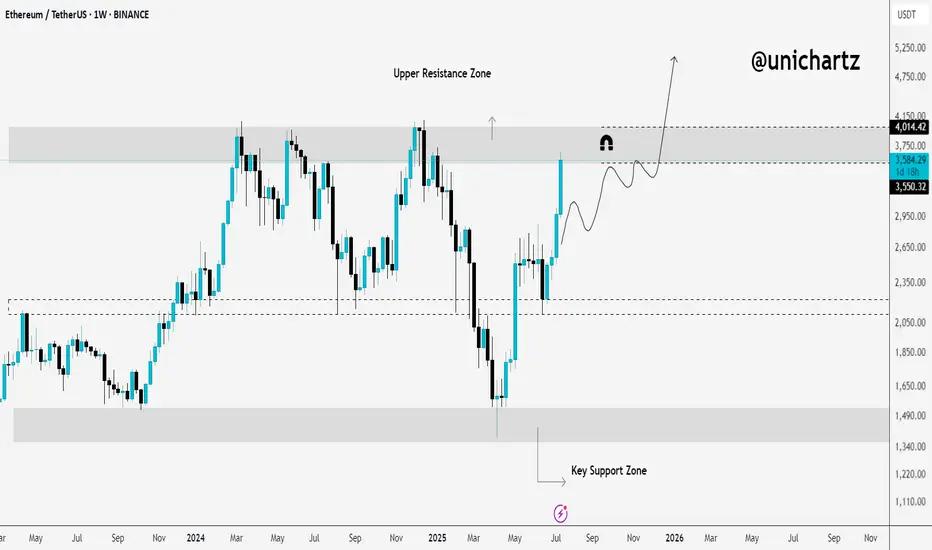
Altseason Starts Here? ETH Hits Critical Resistance!Ethereum has finally reached the upper resistance zone — and this could be the decisive moment for Altseason.
This level has historically acted as a major turning point for ETH. If it breaks and holds above this zone, we could see capital start flowing aggressively into altcoins.
🧠 Why it matters:
ETH reaching resistance usually signals a rotation phase from BTC to ETH.
If ETH breaks above, altcoins tend to follow with explosive momentum.
If it gets rejected, we may see a short-term cool-off.
This is the zone where narratives shift. Eyes on the breakout — or the rejection.
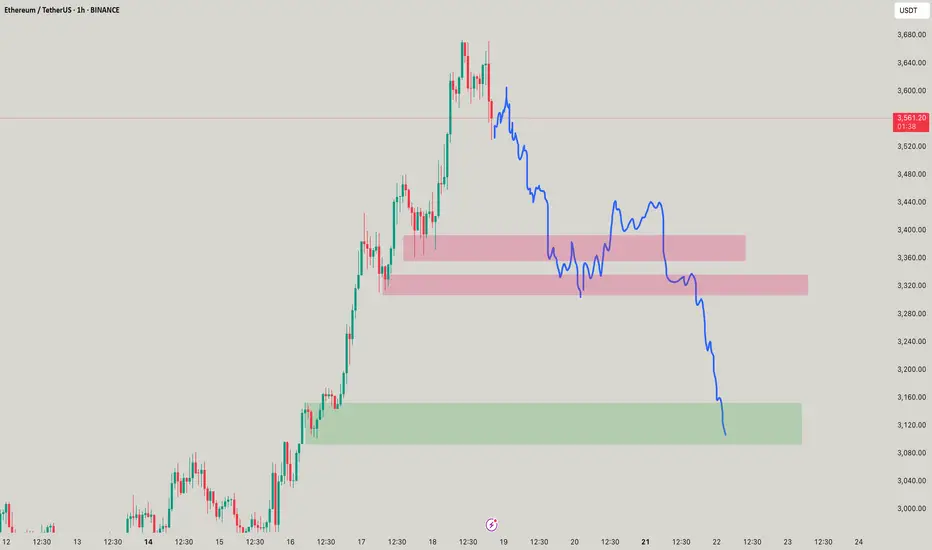
You need smol Scalps for ETH!ETH SMOL scalps but u know it takes your liquidity on top blowing ur accounf! Keep mindful where the trade goes! good short oppurtunity!

Ethereum · No Reason To Stop · Will Continue RisingEthereum will continue rising. Remember Ether is number two and it is awesome, to start, and it follows Bitcoin like darkness follows the light. There is no reason for Ether to move down. There is no necessity for ETH to stop its major advance, in fact, it has been lagging behind and it needs to catch up. Bitcoin is waiting and will continue waiting but it won't wait forever so Ethereum must wake up and is waking up. We are going up.
Ethereum has grown 165% since its 7-April low. This is more than XRP and its capital is twice as much. Boom! The best part? Ethereum will continue growing straight up for weeks and months. It needs to be trading at a new all-time high as soon as possible just so that the market can feel at ease and know, once again, that Crypto is here to stay.
What has been suppressed can't stay suppressed forever. Crypto went through a fight but challenges only made us that much stronger. We are now happy and grateful for everything that we went through because we know that we can take anything the world throws at us.
The chart. Green, green, green straight up. Two months of consolidation. That's the key. ETHUSDT went sideways for almost two months and this reveals what comes next. The advance outside the consolidation range has been happening for 8 days. 60 days of sideways can support at least an entire month of growth. When the entire month is consumed, we can expect a retrace, nothing more, followed by additional growth.
In short, Ethereum will continue rising. If you see a shakeout, know that growth will always resume in a matter of days. If you see a drop, know that this is a bear-trap, the bulls now own the game. If you are in doubt, come read my articles and I will publish something that you will understand and agree is right, so you can continue holding until you can reach the big prize.
The time to sell will come, but it isn't now. Right now is the time to hold strong. Not only Ethereum, but Cardano, XRP, BTC, Dogecoin, Solana and the rest of the altcoins. This is only the start.
I expect Ether will continue rising. $8,000 now looks like such an easy target...
Very good indeed. If you enjoy the content, follow me.
Namaste.

ETH/USDT 4H Chart✅ Market Trend and Structure:
Uptrend: The highlighted orange trend line shows continuous growth since mid-April. The price is trading above the 50- and 200-period moving averages (EMA and SMA), confirming bullish sentiment.
Current price: around 3556 USDT – very close to local highs.
Resistance break in the 3200–3300 USDT area, which now acts as support.
📈 Technical Levels:
Resistance (red horizontal lines):
3600–3650 USDT – local resistance resulting from market reaction.
3888 USDT – next historical resistance level.
4133 USDT – established long-term target (green dashed line at the top).
Support:
3300 USDT – strong support after a previous breakout.
3080 USDT – previous high, now the next support level.
3070 / 2900 USDT – key technical support levels in the event of a larger correction.
📊 Indicators:
MACD:
The MACD is in a strongly bullish zone, but:
The histogram is flattening.
A bearish crossover pattern is possible in the following candles – a signal of weakening momentum.
RSI:
RSI ~74 – is in the overbought zone, which often heralds a correction or at least consolidation.
A value above 70 confirms the bullish trend but may suggest that momentum is overheated.
📌 Conclusions and Scenarios:
🔼 Upside Scenario (trend continuation):
If the price remains above 3300–3350 USDT, it could move towards 3888, and then 4133 USDT.
A break above 3650 USDT on heavy volume will be a strong continuation signal.
🔽 Corrective scenario (short-term pullback):
The RSI and MACD suggest a possible correction.
Potential pullback to:
3300 USDT (retest of previous resistance as support).
SMA 200 (~2600 USDT) with a deeper downward move.

ETH Breaks Key Resistance – $6K Possible if Wedge BreaksETHUSDT has broken out above a key horizontal resistance zone that has historically acted as a strong support and resistance level. This zone, marked in blue, has seen multiple rejections and bounces over the past year, confirming its significance.
The recent breakout above this zone indicates a shift in market structure and suggests growing bullish momentum. The price action shows a clean move above resistance, with potential for a retest before continuing higher. The market is also forming a long-term broadening wedge pattern. The next target lies near the upper resistance of the wedge, around $4,000. If the price breaks above this broadening wedge, it could open the path toward the $6,000 level.
Regards
Hexa
ETH 3rd Attempt at Resistance — Breakout or Bull Trap?Ethereum is back at a major level that’s rejected it twice already. A breakout here could finally end the range and send price into discovery — but if history repeats, this might be the ultimate fakeout before a sharp reversal. All eyes on the next few candles.

ETH ~ It Gives you a chance ~ $4000 soon!ETH will soon go to $4000 bidding Lower TF for actual buys and shorts to stay till there, will post the buy moves soon!
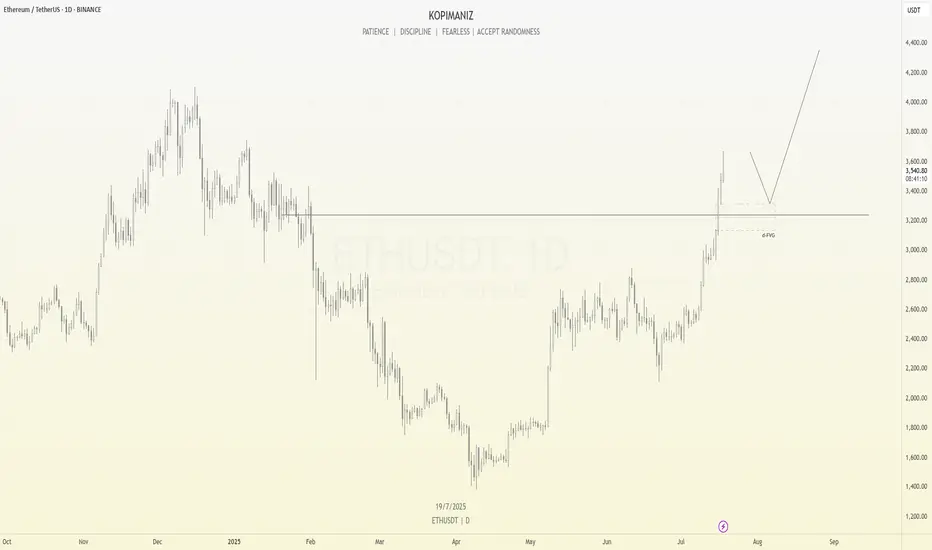
ETHUSDT Analysis – Potential Pullback Before ContinuationAfter a strong bullish rally, ETHUSDT may be ready for a short-term correction. The price has broken a key structure and is now trading well above previous resistance.
I'm expecting a potential pullback into the Fair Value Gap (FVG) area around $3,200, which also aligns with a retest of the previous resistance now turned support. If this level holds, it could act as a springboard for the next bullish leg, possibly targeting the $4,000+ region.
This setup follows a typical market behavior where price fills imbalance zones before resuming its trend.
Key levels:
Support zone: $3,200 – $3,300
Bullish continuation target: $4,000 – $4,400
Let’s see how price reacts at the FVG zone. Patience and discipline are key.
eth mini scalp simple trade using order block 15minutes , but its not powerfull ob so maybe can go to our sl , just manage the risk , dyor!

DeGRAM | ETHUSD retest of the support level📊 Technical Analysis
● ETH exploded out of the purple median channel, invalidating March-July lower-highs; retest of 3 210 held as a fresh higher-low, confirming trend acceleration.
● Price is now travelling the channel’s outer parallel; flag pole projected from the 2 430→3 210 thrust aligns with the 4 150-4 250 supply zone shown in pink.
💡 Fundamental Analysis
● CME ether futures OI hit a 14-month high on 17 Jul while exchange balances dropped to a five-year low, signalling strong institutional demand and tight float ahead of expected spot-ETF approvals.
✨ Summary
Long 3 210-3 300; hold above 3 210 targets 3 600 → 4 200. Bull view void on a 16 h close below 3 020.
-------------------
Share your opinion in the comments and support the idea with like. Thanks for your support!
Ethereum (ETH): Looks Good, We Are Going For $3300-3400 EasilyWe are flying; Ethereum seems strong, so we are bullish on it. Our target of $3K was reached and broken easily, and now we are looking for the next resistance area to be reached, which is $3300-3400.
Targets are set; the first one got reached, and now we're heading towards the other 2 targets of ours!
Time for BINGX:ETHUSDT.P to shine.
Swallow Academy

Ethereum (ETH): Time For Ethereum To Shine | $3300-$3400The daily timeframe is showing no remorse to sellers, with buyers strongly dominating the zones after a local resistance area near $2800 was broken.
After that breakout we had a smaller sideways consolidation movement, here we formed a proper BOS and now price is heading towarsd the upper zones. we are tergeting the $3300 to $3400 are as of now, where we might see another sideways movement before a breakout.
Swallow Academy

Ethereum (ETH): Will Overtake The Bitcoin Soon? Ethereum has been moving much better compared to Bitcoin, which confirms our theory that ETH will now head for its ATH, just like Bitcoin did before.
We are looking for further movement to $4000 area, but be careful as we are entering weekends market, we should keep an eye on our entry area.
Volatility can happen but nevertheless, we are very bullish on ETH.
Swallow Academy

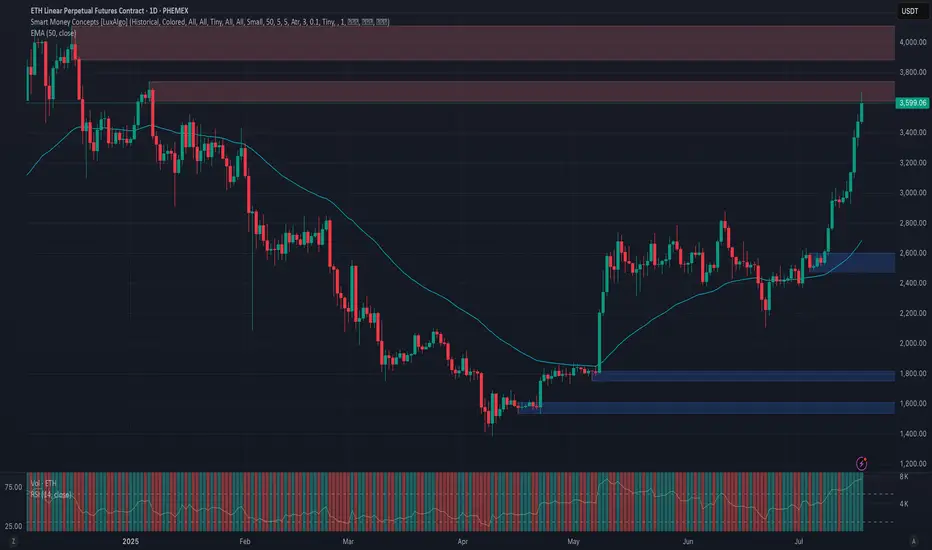
Phemex Analysis #98: ETH Price Explodes— Is $5,000 Finally Next?Ethereum ( PHEMEX:ETHUSDT.P ) has recently shown impressive strength, surging past significant resistance levels and stirring excitement in the crypto market. After an extended consolidation, ETH decisively broke through the crucial $3,300 resistance level, rallying more than 15% in just three days, and is now trading confidently around $3,500.
This renewed bullish momentum has traders and investors eagerly speculating: Could this be the start of Ethereum's next major run? Or should caution prevail amid ongoing market uncertainty? To help navigate this critical period, let's explore several key trading scenarios.
Possible Scenarios
1. Bullish Continuation – Targeting New Highs
Ethereum’s recent breakout above the $3,300 resistance signals strong bullish sentiment. If buying volume continues increasing, ETH could swiftly move towards higher resistance levels at $3,800 and potentially challenge the psychological milestone of $4,100.
Pro Tips:
Profit Targets: Consider locking in partial profits as ETH approaches strong resistance zones around $3,800 and $4,100.
Risk Management: Place tight stop-loss orders on recent lows, approximately around $2,902 to minimize downside risks.
2. Short-term Retracement – Healthy Pullback
Given ETH’s rapid surge, a short-term pullback to retest the recently broken resistance zone at $3,300 to $3,000 (now acting as strong support zone) is plausible. A successful retest would strengthen the bullish case, signaling healthy consolidation before further upward momentum.
Pro Tips:
Buying the Dip: If ETH holds above $3,000 with declining volume, consider cautiously adding to your positions or initiating new longs.
Volume Confirmation: Closely watch trading volume; lower volume during pullbacks typically indicates a healthy retracement rather than a bearish reversal.
3. Bearish Reversal – Breaking Below Critical Support
If Ethereum’s price experiences heavy selling pressure and breaks below the key support at $3,000, bearish sentiment could escalate, potentially driving ETH towards lower support levels near $2,470 and possibly even $2,110.
Pro Tips:
Short Positions: Experienced traders might consider initiating short positions if ETH decisively breaks below the crucial $3,000 support zone on increasing selling volume.
Long-term Accumulation: Long-term investors may strategically accumulate ETH near stronger support areas at $2,470 and $2,110, after clear signs of price stabilization.
Conclusion
Ethereum (ETH) currently offers attractive opportunities, propelled by recent bullish momentum yet balanced by market uncertainties. Traders must closely observe key resistance at $4,000, critical support around $3,000, and carefully analyze trading volumes for confirmation of market direction. By maintaining disciplined risk management and strategically capitalizing on outlined scenarios, investors can effectively navigate ETH’s price action in the weeks ahead.
🔥 Tips:
Armed Your Trading Arsenal with advanced tools like multiple watchlists, basket orders, and real-time strategy adjustments at Phemex. Our USDT-based scaled orders give you precise control over your risk, while iceberg orders provide stealthy execution.
Disclaimer: This is NOT financial or investment advice. Please conduct your own research (DYOR). Phemex is not responsible, directly or indirectly, for any damage or loss incurred or claimed to be caused by or in association with the use of or reliance on any content, goods, or services mentioned in this article.