#ETH Update #2 – July 10, 2025🟢 #ETH Update #2 – July 10, 2025
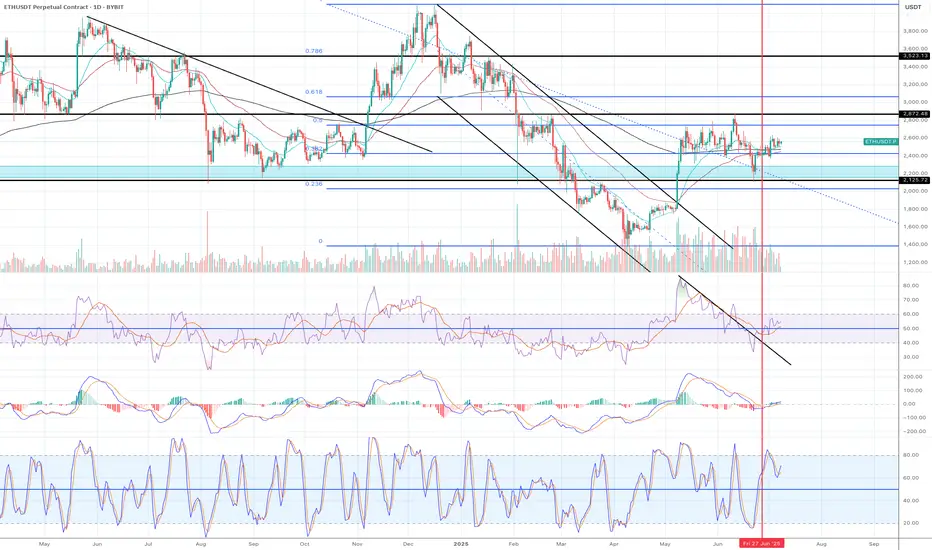
Ethereum has formed a new high above its previous impulsive leg. Although this peak is lower than the one a month ago, the current structure looks healthy. During this move, ETH left an imbalance around the 2373 level, which aligns closely with a potential retracement zone. Volume appears to be decreasing or reaching exhaustion, suggesting the rally may be losing strength. A correction towards 2685 could be on the table. For now, the setup does not favor either a long or short position.
ETHUSDT trade ideas

DeGRAM | ETHUSD rebound from the support line📊 Technical Analysis
● Bounce off the purple up-trend and 2 320 support printed a bullish engulfing, maintaining the sequence of higher-lows that has guided price since April.
● Price is squeezing into an ascending triangle under 2 700-2 730, where the former wedge cap meets horizontal supply; a break projects to the 3 040 macro fib / channel roof.
💡 Fundamental Analysis
● Net-staking deposits keep rising while, per FXStreet (25 Jun), whales add ETH ahead of the SEC’s spot-ETF S-1 verdict, underpinning demand.
✨ Summary
Long >2 320; triangle breakout above 2 730 targets 3 040. Thesis void on a 16 h close below 2 200.
-------------------
Share your opinion in the comments and support the idea with like. Thanks for your support!

Ethereum Wave Analysis – 9 July 2025- Ethereum broke the resistance area
- Likely to rise to resistance level 2885.00
Ethereum cryptocurrency recently broke the resistance area located between the resistance level 2645.00 (which stopped wave 1 at the start of July) and the resistance trendline of the weekly Triangle from January.
The breakout of this resistance area accelerated the active short-term impulse wave 3 of the intermediate impulse wave (3) from June.
Given the strongly bullish sentiment seen across the crypto markets today, Ethereum cryptocurrency can be expected to rise to the next resistance level 2885.00 (top of wave (1) from June).

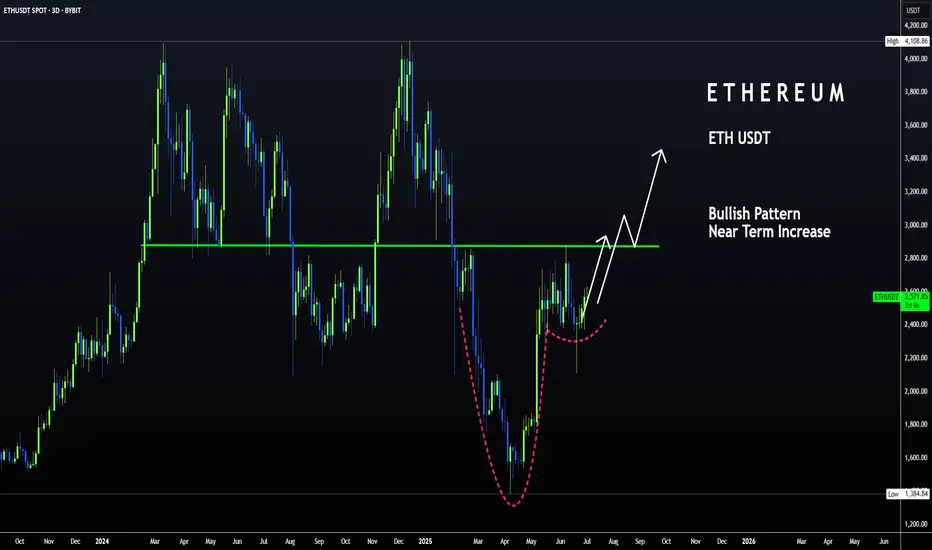
ETH | Bullish Pattern - Cup and Handle +15%A Bullish pattern is appearing on the Ethereum chart.
From a Cup and Handle pattern, we can easily expect atleast a 15% increase. This is true for the near term. A +15% would put us here:
Just under $3K we may see heavy resistance. This is also the neckline resistance, as it was the previous support for the breakout that ultimately led to a new ETH ATH.
_______________________________
BYBIT:ETHUSDT
Short oppurtunity for ETHShort Opportunity on Ethereum (ETH)
Ethereum has recently failed to reclaim key resistance near \$2,800 and is showing signs of renewed bearish momentum. A brief pullback toward \$2,705 is likely before any meaningful bounce back to retest \$2,800. This setup offers a shorting opportunity with defined risk and reward.
Technical Rationale
Resistance at \$2,800 : Price has been unable to close convincingly above this level on multiple attempts, indicating strong overhead supply.
Bearish Momentum : Recent lower highs on the 4-hour chart and a break of the short-term uptrend line suggest sellers are in control.
Support Target at \$2,705 : The next logical area where buyers may step in confluence of the 50-period moving average (4h) and prior swing low from late June.
Outlook
If ETH reaches \$2,705 and shows bullish signs (hammer or bullish divergence on RSI), expect a retest of the \$2,800 area. Conversely, a decisive break below \$2,705 could open the path to \$2,650 and lower. Adjust your plan accordingly based on how price behaves around these key levels.
Disclaimer : Always conduct your own due diligence and size positions according to your risk tolerance. Markets can be unpredictable, use proper risk management.
ETH Gearing Up for Lift-Off — Eyes on $4,000+ETH Weekly Outlook
ETH is currently trading around $2,660 on the weekly timeframe and holding up well at these levels.
If the momentum continues, the upper resistance zone near $3,550 could act like a magnet — pulling price higher. A breakout above this zone may trigger a strong rally toward $4,000+.
And when ETH starts to move big… altcoins usually follow.
Keep an eye on it. The next few weeks could get interesting.
DYOR, NFA

Weekly trading plan for EthereumLast week's price action followed our bullish scenario perfectly. Currently trading above the weekly pivot point, we've already hit target 1. Now anticipating target 2 - either directly or after a local pullback. However, if we lose the pivot with no buyer recovery, expect downside momentum toward support. Also explained the $2,112 target rationale in the video analysis
Which scenario do you think will play out? 👀

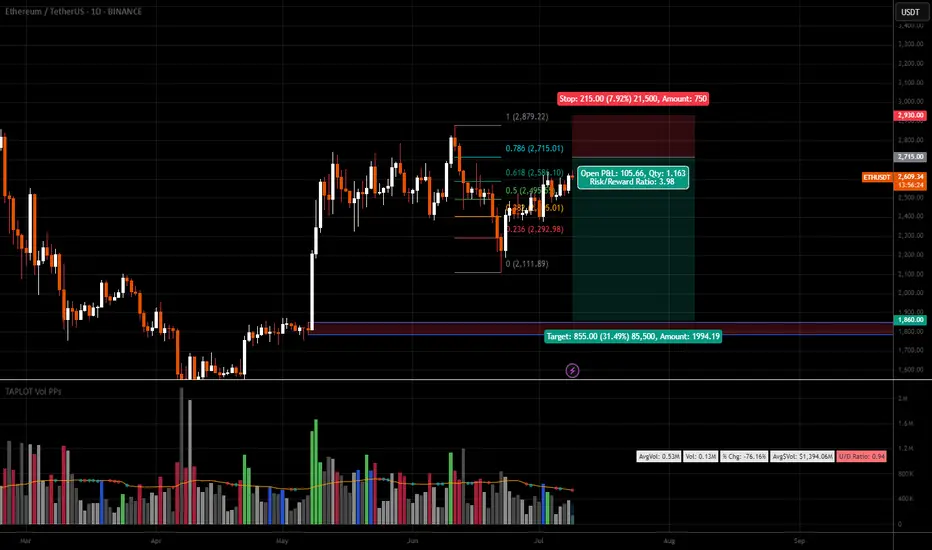
ETH Short IdeaRising trend broken. You can see MSB easily
Volume going down during price rising.
I am waiting correction to 1860
Ethereum (ETH): Will Say It Again $2800 Is Scripted!Ethereum buyers are dominating currently, with the price climbing closer and closer to our major target of $2800.
What to pay attention to are the 100 and 200 EMAs, where usually once we have shifted apart from them, we have seen some kind of correctional movement if buy-side momentum is lost so that's what we are keeping an eye on.
If we see currently further buy-side pressure, then we might reach our target within this week, but if sellers take even slight control, we most probably will retest the EMAs before another attempt to upper zones.
Swallow Academy

ETH/USDT Long term ContinueAbsolutely! Here's your Ethereum long position analysis in English based on the chart you shared:
🧠 My Position – Long at $2,590
📍 Current Price: ~$2,605
👉 That means you're currently ~$15 in profit (small gain for now).
📊 Chart-Based Technical Analysis (1D timeframe)
✅ Key Support Levels
$2,423 – Fibonacci 0.382 level
$2,450–$2,475 – Close to the 50 EMA (blue line)
These zones serve as strong support, holding the price up.
🚀 My Entry Strength
You entered at $2,590, which is:
Above EMA 20 (red) — bullish short-term signal
Right in the tight moving average cluster (20/50/200) — often a sign of an upcoming breakout
📈 Risk/Reward Ratio
Entry: $2,590
Stop-Loss: $2,575 → Risk: $115
TP1: $2,743 → Reward: $1530
R/R ratio for TP1: ~1
✔️ Overall: Very good entry with balanced risk.
🔔 Recommendations:
If ETH moves above $2,650, consider moving SL to break-even ($2,590) — protect your capital
Near $2,743, you could:
Close 50% of my position
Or use a trailing stop to lock in more profit

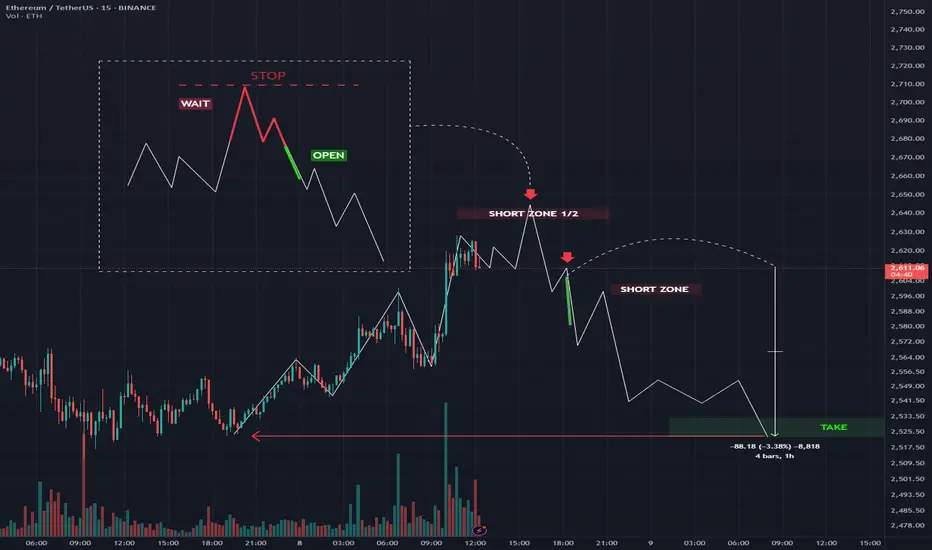
ETH FAST TRADE [15M]📝 My ETH Short Idea (Test Trade)
This is a test idea where I’m simply practicing my analysis and trade execution. It’s built entirely on my own personal strategy, so it’s primarily for self-development and tracking.
💡 The main setup:
I’m looking for a short position on ETH, but this idea will only be valid if all my levels and conditions align exactly.
Otherwise, I’ll skip the trade.
📌 How to enter:
I’ve detailed exactly how to enter the trade:
Wait for my specific trigger conditions to be met (price levels + confirmation by my indicators).
Enter only after the setup is fully formed — no early entries.
Manage risk properly with stop-losses beyond key invalidation levels.
Scale in only if price structure continues to validate my scenario.
⚠️ Important:
This is not financial advice. I’m using this idea mainly to test and refine my strategy. Sharing it here for transparency and to improve my analytical discipline.
✅ Plan:
If the setup completes exactly as planned, I’ll look for targets according to my strategy’s rules, trailing stops along the way.
#ETH Ascending Triangle📊#ETH Ascending Triangle 📉
🧠From a structural perspective, the bullish target near the neckline support area has been achieved, so there is an expectation of a pullback.
➡️From a graphical perspective, there is an ascending triangle superimposed inside the ascending wedge. Generally, we regard such models as bearish models. Therefore, with the support of multiple decline expectations, we should not chase the rise here! ! !
🤜If you like my analysis, please like 💖 and share 💬 BITGET:ETHUSDT.P

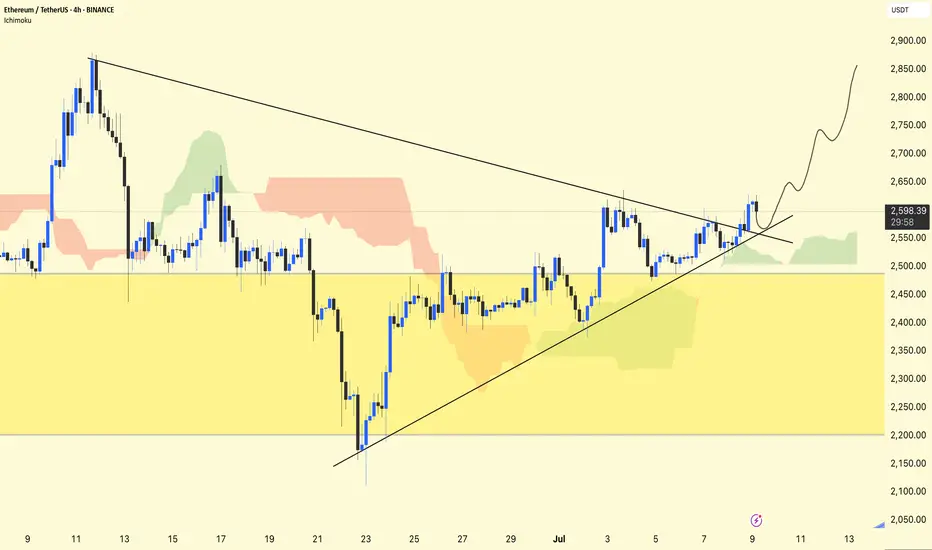
ETH/USDT Chart Analysis (4H)
ETH has been trading inside a symmetrical triangle (shown by converging black trendlines).
A breakout has occurred above the descending trendline, signaling bullish momentum.
The rising diagonal trendline from late June is acting as strong support.
Ichimoku Cloud:
ETH is above the cloud, indicating a bullish bias.
The cloud below the price is green and fairly thin, suggesting modest support if the price dips back.
Key Levels:
Resistance Zone: $2,650–$2,700 (upper breakout zone).
Immediate Support: $2,550 trendline area.
Major Support Zone: $2,250–$2,450 (large yellow box). This has previously served as a significant accumulation zone.
Potential Scenario:
The price may retest the broken triangle trendline around $2,550–$2,570 (as indicated by the wavy projection on your chart).
Holding above this level could fuel a rally toward $2,750–$2,850 next.
Losing $2,550 would expose ETH back toward the bigger yellow support zone.
Short-Term Outlook:
Momentum favors bulls as long as ETH stays above ~$2,550.
Watch for volume on any move above $2,650 to confirm continuation toward higher targets.
Conclusion:
ETH has broken its triangle resistance and looks poised for further upside. A successful retest near $2,550–$2,570 could launch the next leg higher toward $2,750–$2,850.
Stay tuned for updates and key levels to watch!
Thanks for your support!
DYOR. NFA
ETHUSD At 0.618 fib If holds can go 2680 ETHUSD recently in uptrend as par to correction the price has reached 0.618 Fib and price maty reverse if the bulls are Strong let us see....

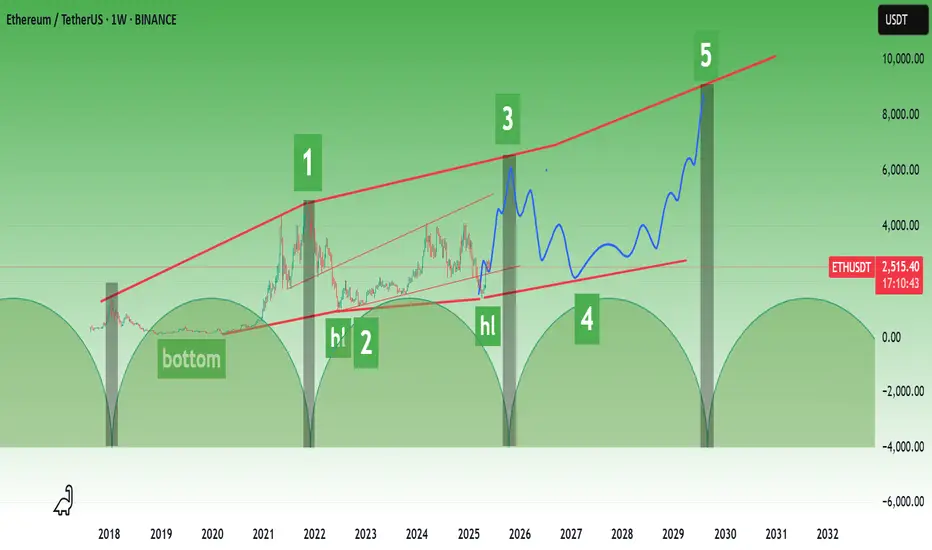
ETHEREUM ROADMAPI tried to predict based on previous time periods and elliot waves.
Please note that my analysis is not short-term. Of course, there may be short-term correction waves in Ethereum.
* The purpose of my graphic drawings is purely educational.
* What i write here is not an investment advice. Please do your own research before investing in any asset.
* Never take my personal opinions as investment advice, you may lose your money.
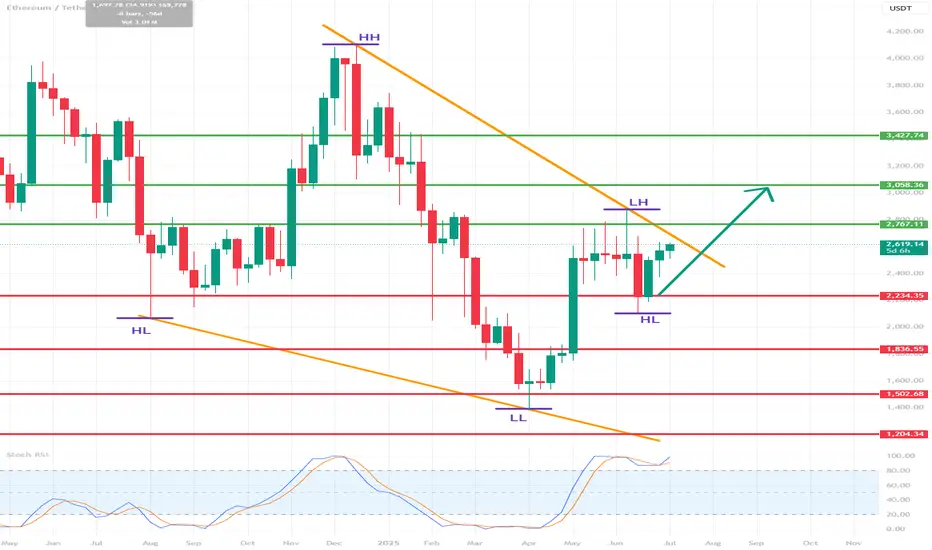
ETH/USDT 1W Chart📊 Trend structure (Price Action)
Downtrend (historical):
A series of Lower Highs (LH) and Lower Lows (LL) — a classic downtrend.
Confirmed by the orange downtrend line.
A change in structure — a possible beginning of an uptrend:
A Higher Low (HL) has recently been formed after a Lower Low (LL).
Suggests a possible end to the downtrend and an attempt to break out upwards.
Currently:
The price is testing the upper downtrend line.
A breakout above the orange line may confirm a trend change.
🟢 Key Resistance Levels (Green Lines):
Level Meaning
3.058 USDT Potential target after a breakout from consolidation
2.767 USDT Nearest strong resistance - currently being tested
3.427 USDT Deep resistance level from the previous high (HH)
🔴 Key Support Levels (Red Lines):
Level Meaning
2.234 USDT Nearest support - previous breakout
1.883 USDT Early 2023 support
1.507 USDT Local bottom
1.204 USDT Historical support - LL extreme
📉 Stochastic RSI (Momentum Indicator):
Currently in the overbought zone.
This may suggest a short-term correction before an actual breakout.
However, in a strong uptrend, the indicator may "hang out" in the overbought zone for a long time.
📈 Potential scenario:
If the breakout above 2.767 and the orange trendline holds:
A possible move to 3.058 USDT as the first target.
Extended target: 3.427 USDT (HH).
If the breakout fails:
Correction to 2.234 USDT or lower.
There is a risk of returning to a downtrend.
✅ Bullish signals:
Higher Low (HL) formation after Lower Low (LL).
Testing the upper downtrend line with an attempt to breakout.
Volume is increasing (based on candles).
⚠️ Bearish threats:
Stochastic RSI in the overbought zone.
Breakout not confirmed by 100% (needs a weekly closing candle above 2.767).
Resistance at 3,058 could halt the move.
📌 Conclusion:
Ethereum (ETH) could be on the cusp of a new uptrend, but a breakout above 2,767 USDT is needed for confirmation. If it does, a move to 3,058 and then 3,427 is possible. However, the current overbought level on the Stochastic RSI could signal a short-term correction before the trend gains strength.
ETH Long Swing Setup – Sideways Hold with Dip-Buy OpportunityETH continues to hold above the key $2,300 support, showing resilience and consolidating within range. We’re watching for one more dip into the $2,300–$2,375 zone to trigger a long entry, with momentum building for a potential breakout.
📌 Trade Setup:
• Entry Zone: $2,300 – $2,375
• Take Profit Targets:
o 🥇 $2,900 – $3,000
o 🥈 $3,300 – $3,400
o 🥉 $4,000 – $4,200
• Stop Loss: Daily close below $2,000

Short-Term ETH Setup – Bearish Bias with Target at $2536Short-Term ETH Setup – Bearish Bias with Target at $2536 🐻
Ethereum is showing signs of weakness below resistance, and a short-term pullback could be on the table. If bearish momentum holds, I’m watching $2536 as the next key target.
Tight risk management is crucial — this setup offers solid R/R if played with precision.
📉 Follow for real-time analysis, sharp entries, and no hype.

ETHUSDT Long / Buy SetupMust take from the entry and USE tight SL. Can be a fakeout, if real breakout then tps are mentioned. In case sl hit, use the previous setup, it's still valid. While for short I'm still waiting for 3k or above.

ethI have a strategy with 80% win rate.
The essence of it is that by the end of October, we will not see ETH above 4100.
On the other hand, we are still within the body of the 12-month candle from 2021. In 2024, we failed to hold above 3700, which indicates weakness and increases the likelihood of a move toward the 2021 low, around 700.
Right now, this sounds pessimistic and I don't like this scenario, but that’s how I see the chart.

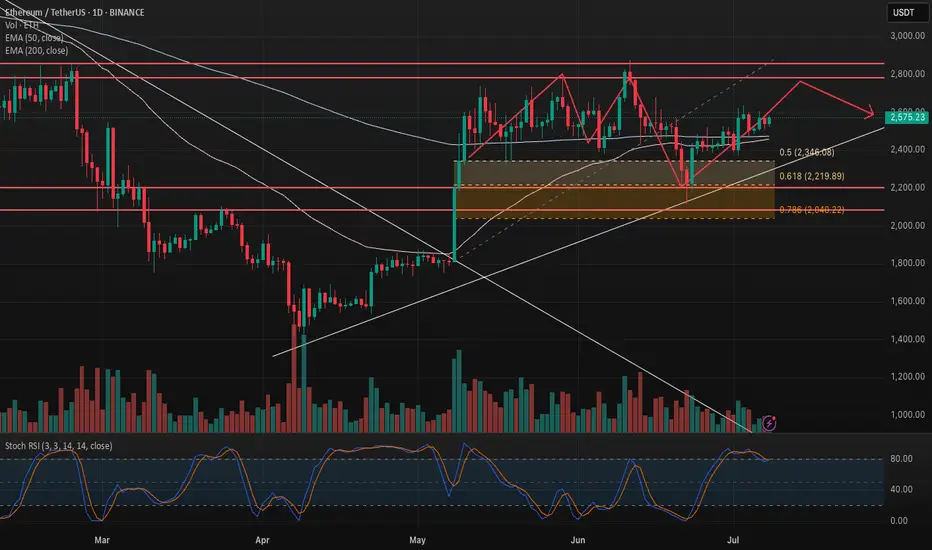
Ethereum Facing Key Resistance, Breakout or Fakeout?ETH is pressing into major horizontal resistance near $2,600 after breaking out from a double-bottom structure. Price is moving within a wide range capped near $2,900 and supported by the 0.5 and 0.618 fib zones.
🟢 Scenario 1 – Bullish:
Clean break and hold above $2,600 opens room to test the top of the range around $2,900. Watch for a higher low retest to confirm strength.
🔴 Scenario 2 – Bearish:
Rejection here could send ETH back toward $2,340 (0.5 fib) or even $2,220 (0.618). The stochastic RSI is approaching overbought, signaling caution.
This chart is for educational purposes only — not financial advice.
Time to go long!!
1) A candle broke out and closed above the descending parallel channel.
2) The price has been consolidating above Fib0.0382 level for weeks.
3) The recent candles are sitting above EMA21.
4) EMA 21 is above EMA55.
5) EMA200 is running horizontally still but it is getting close to cross EMA55.
6) All momentum indicators are in the bull zone and still plenty to go before it hits overbought territory.
There might be a strong breakout to the upside.
It is time to go long.
Ethereum (ETH): Buyers Showing Dominance | $2800 IncomingBuyers are doing a great job currently, keeping the price above the EMAs (which also have been marked by us as a retest area after we did that break of structure on the 2nd of July).
Now as long as we are above our buy zone, we are bullish on ETH. As many know, we are far away from the potential of ETH and the first target is at $2800-$3000.
Swallow Academy
