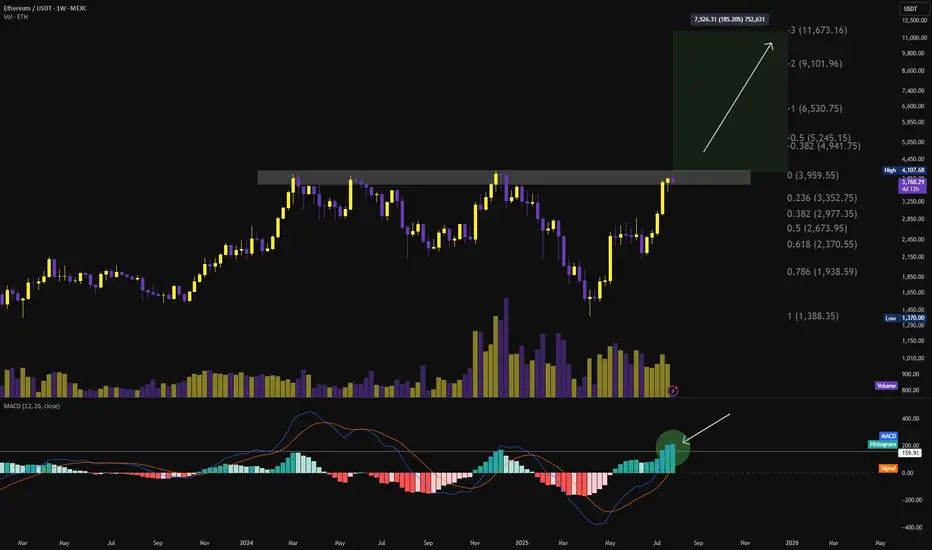
$ETH BREAKOUT FROM $4K IS A MATTER OF TIMEMomentum is in our favour — and this time, it's technically undeniable.
📈 MACD is at the highest levels it's ever been while testing $4K — signaling explosive breakout potential.
Weekly close above $3,959.55 confirms a breakout of a 28-month-long horizontal structure.
Once that’s in — it’s price discovery mode.
🎯 Targets:
→ $5,245 (0.5 Fib)
→ $6,530 (-1 Fib)
→ $9,101 (-2 Fib)
→ $11,673 (-3 Fib)
🟥 Invalidation:
→ Weekly close below $3,352
→ Bearish MACD crossover
Volume rising, structure clean, and momentum fully aligned.
This is the perfect storm for a macro leg to $10K+.
ETHUSDT trade ideas
Ethereum Turns 10 Amid Bullish News and Institutional AccumulatiJuly 23, 2025 - World Liberty Financial a crypto project linked to U.S. President Donald Trump spent millions to acquire more Ethereum and acquired more than 3,400 ETH
July 29, 2025 - World Liberty Financial purchased 256.75 ETH for $1 million
July 29, 2025 - The mining company BitMine, which has adopted the strategy of accumulating Ethereum (ETH), presented the results of a study according to which the cost of replacing Ethereum is $60 thousand. The current price of the altcoin is 15 times lower, it fluctuates around $3.8 thousand
Against the backdrop of such strong news, tomorrow July 30, 2025 ETH will have a bile tomorrow, 10 years since the coin was created
Ethereum has tried to break through the $4,000 mark and stay there 4 times already
Against the backdrop of such powerful news, it is clear that institutional investors are clearly preparing for the fact that the coins will grow in the long term, and for some time to strengthen on new ATN
In the near future, you can focus on the $4100 and $4200 marks
Also, you should not bet on growth, a correction from the current marks to $3600 is always possible
AI-powered charting tools and news sentiment analyzers indicate a continued bullish trend

ETH to $6500?Have had this chart created for a while since before 2020, now loading it back up looks like everything is going as planned. ETH has to reach its ATH again around 4800 then it shoots to prices discovery, it will forsure run through 5000$ so $6500 becomes a target afterwards.
ETH USDTETH - needs a breakout from this Trendline and we are targeting 4k$.
Good support 3600-3650.
Always DYOR!

Combining a "cup and handle" pattern with a long position on ETHCombining a "cup and handle" pattern with a long position on ETH/USDT is a classic bullish technical analysis strategy. Let's break down what this pattern signifies and how to approach it for a long trade.
Understanding the Cup and Handle Pattern
The cup and handle is a bullish continuation pattern popularized by William J. O'Neil. It suggests a period of consolidation followed by a breakout to the upside, signaling a likely continuation of the prior uptrend.
Disclaimer: Technical analysis patterns like the cup and handle are tools, not guarantees. Always combine them with sound risk management and your overall trading strategy. Past performance is not indicative of future results.

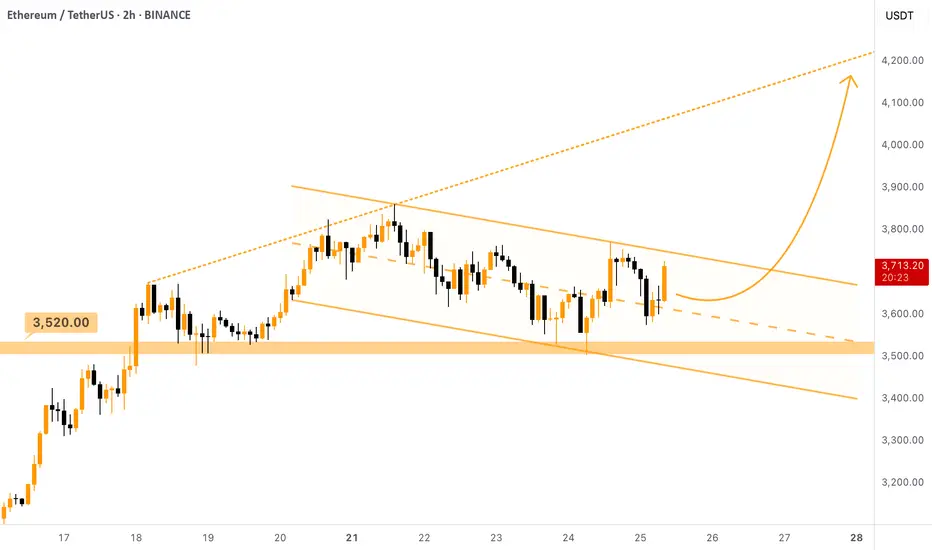
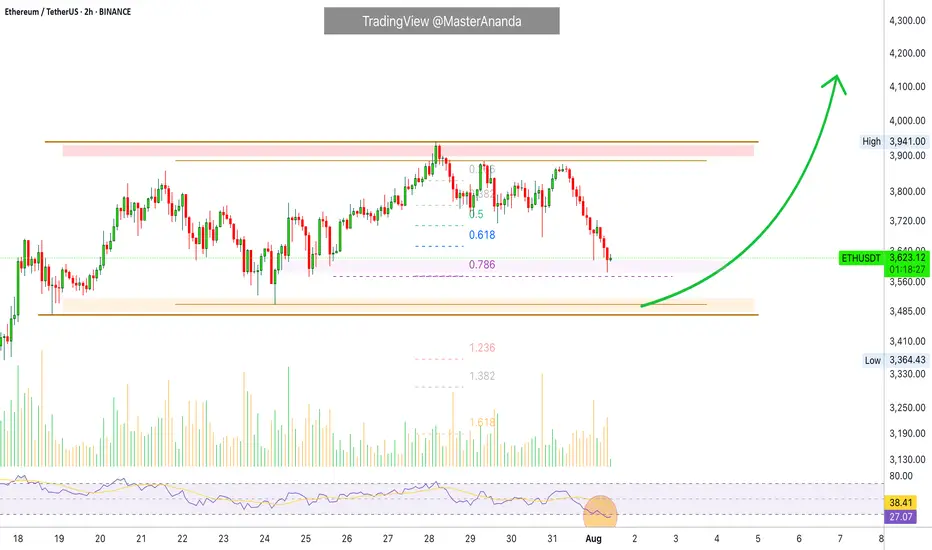
$ETH - Taking Lead Over $BTC (again)Ethereum is strong as ever here. Despite Bitcoin dumped due to the FUD of Galaxy Digital selling CRYPTOCAP:BTC worth of $3.5B, Ethereum managed not stay above the support and even umped!
It is currently forming a Descending Channel (bullish pattern) above the $3520 support level. Local setup. Once this channel is broken upwards, we can expect the price to move towards the ascending resistance that was set a week ago, target is $4100 - $4200 .
You can either enter a trade here or wait for the breakout of the descending channel, the second option is safer.
ETH Still Holding Key LevelDespite the recent pullback following the FOMC meeting, Ethereum is still trading above a key daily level that previously acted as resistance ($3,865). As long as we don't see a daily close below this zone, the market structure remains intact, and my bias stays bullish.
Support holding here could set the stage for another leg up and potentially reignite altseason, going below will cause me to shy away from the idea of an altseason in the short future.
For now, I’m watching daily close closely and staying patient
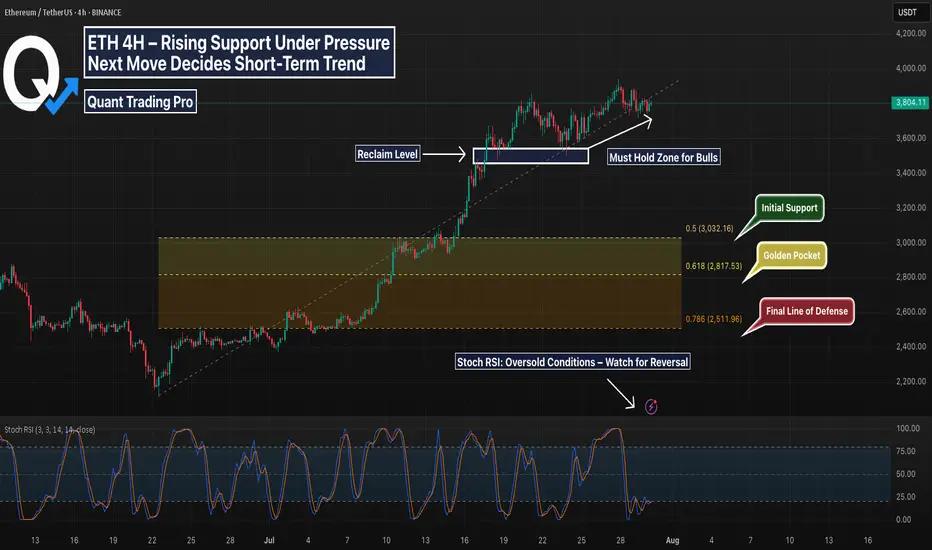
ETH 4H – Trendline Test or Trap? Golden Pocket BelowEthereum’s 4H chart shows price compressing against rising trendline support after a strong impulse move in July. While bulls have defended the key reclaim zone (white box) multiple times, momentum is fading and structure is at risk.
Price is now coiling just above the diagonal trendline — a decisive bounce here could spark continuation. However, a breakdown opens the door to deeper retracements.
Key Fib retracement levels below:
0.5 at $3,032 – Initial reaction zone
0.618 (Golden Pocket) at $2,817 – High confluence support
0.786 at $2,511 – Extreme retracement target
The Stoch RSI is deeply oversold, suggesting a bounce may be near — but confirmation is needed.
📊 Things to watch:
Reaction at trendline support
Sweep of reclaim zone followed by reclaim
Golden Pocket retest with bullish divergence
If support holds, this could be a textbook higher low. If not, expect liquidity hunts toward the fib zones. Stay nimble.
Perfect candidate for a strategy backtest or reactive plan using alerts and confirmation tools.
ETH (5 year of accumulation!)ETH / USDT
📌 Background: i shared an analysis about ETH/BTC chart and i predicted the ultimate bottom, from which ETH/BTC pumped 52% and ETH/USDT pumped 97% in few days !
you can check previous analysis: click here
📌 Today we have different chart against stable coin … Ethereum is being accumulated since 5 years in mega accumulation range with 2 major stop-loss hunt (long and short)
📌 What IF ?
What if ETH made a breakout throughout this accumulation ? i think we can see scenario like that in the green candles in my chart
DO YOU AGREE ?

Ethereum to 15K ? or fall to 500$ !!📊 Ethereum – Long range outlook
If the price manages to break the red resistance zone above and hold above it, the path will be poised to reach the main target at $15,000, as shown by the rising arrows. If it fails, it has another opportunity to regroup buyers from the resistance at $2,228, with a very important trend that will support the upward move.
If the price fails to break the rebound from $2,227, closes this area ($2,227), and then breaks the weekly trend, we expect a sharp drop to $1,408 and even $500 in the long term.
Main Target : 15,000$

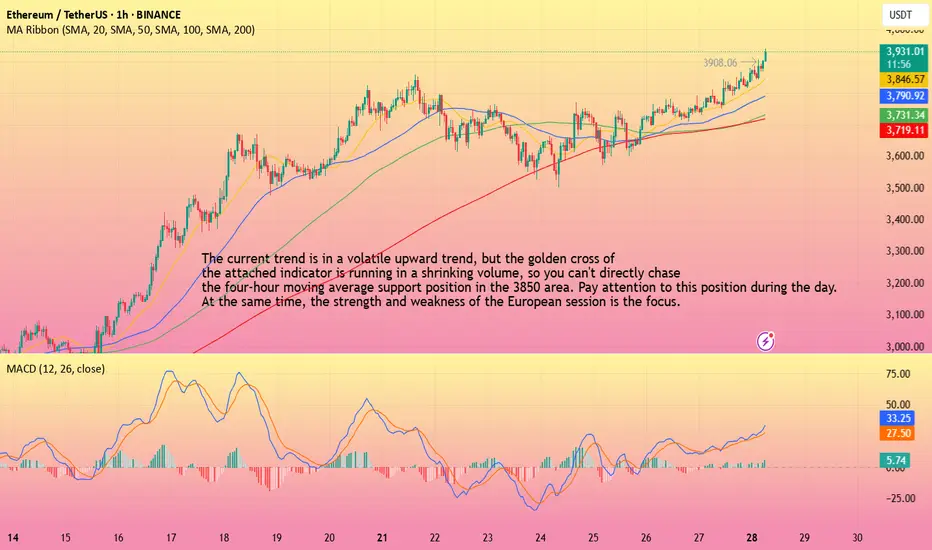
ETH-----Buy around 3850, target 3930 areaTechnical analysis of ETH contract on July 28:
Today, the large-cycle daily level closed with a small positive line yesterday, the K-line pattern continued to rise, the price was above the moving average, and the attached indicator was running in a golden cross. The general trend of rising is still very obvious. The current price has deviated from the moving average and returned to the moving average support position near the 3775 area, so you still need to pay attention to the risk trend of retracement in trading. The overall trend of the short-cycle hourly chart is in a volatile upward trend, but the price is relying on the support of the MA5 and MA10 daily moving averages to rise, and the general trend of rising is relatively obvious, so you still need to find obvious signals to enter the market during the day. The current four-hour moving average support position is near the 3850 area, and the hourly chart continues to fall.
Today's ETH short-term contract trading strategy:
Purchase at the 3850 area when retreating, stop loss at the 3820 area, and target the 3930 area;
ETHUSDT Short Trade IdeaShort ETHUSDT at $3,745.22 with a target of $3,561.34.
Reason for Short: The 4-hour chart shows a symmetrical triangle pattern with resistance around $3,745-$3,800. The price is testing this upper trendline, and a recent bearish candle suggests potential rejection. The DEMA at $3,747.75 indicates overextension, supporting a pullback.
What I See: Heavy sell pressure is forming near $3,745, with the triangle nearing a breakout/breakdown point. Support lies around $3,561, aligning with prior lows.
Stop Loss: Set at $3,802, above the recent high and triangle resistance, to avoid a bullish breakout.
Trade Rationale: A breakdown from the triangle with volume confirmation could drive the price to $3,561. The tight stop above resistance minimizes risk while targeting a key support level.

Ethereum Short-Term · Trading within Bullish RangeI am looking at Ethereum short-term using the same timeframe I used for Bitcoin, 2h. We have some interesting signals.
Here ETHUSDT is trading within higher lows. This is interesting because Bitcoin produced a lower low recently. The same volume signal is present here, ETHUSDT has been producing lower bearish volume since last month.
The RSI produced a lower low while ETHUSDT produced a higher low. This is called a hidden bullish divergence. Ethereum's bears did not only fail to take out the last low 24-July but also the previous one, and this clearly reveals bullish support.
The RSI being oversold is also a positive condition and can signal a reversal happening soon. Not truly a reversal because we are not in a downtrend, we are still witnessing a small pause after a strong rise; consolidation near resistance. A continuation reads better.
Ethereum's price continues really strong and the short-term signals are pointing to bullish action being favored in the coming days. We can wait easily and patiently because the best is yet to come. Never SHORT in a bull market, the market will surprise you with how fast things can turn. Better wait for support and go LONG.
Namaste.
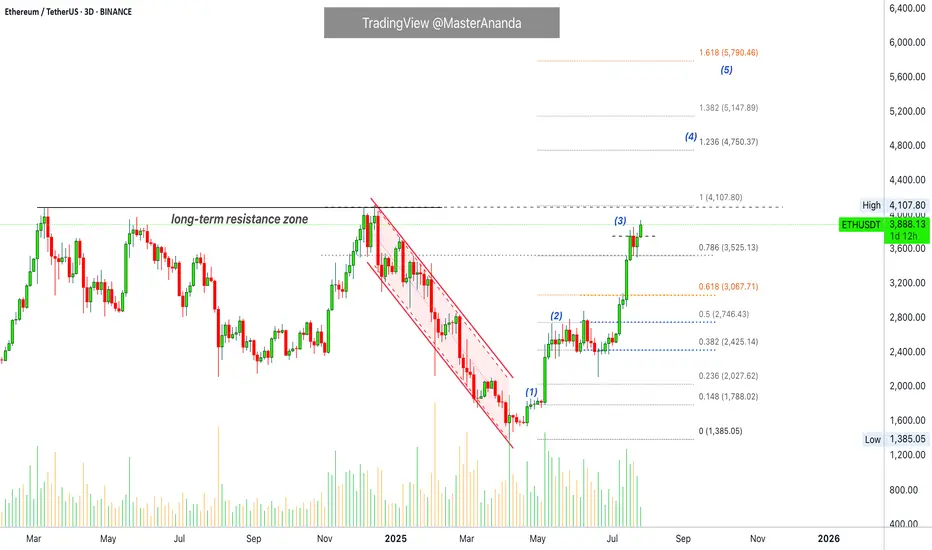
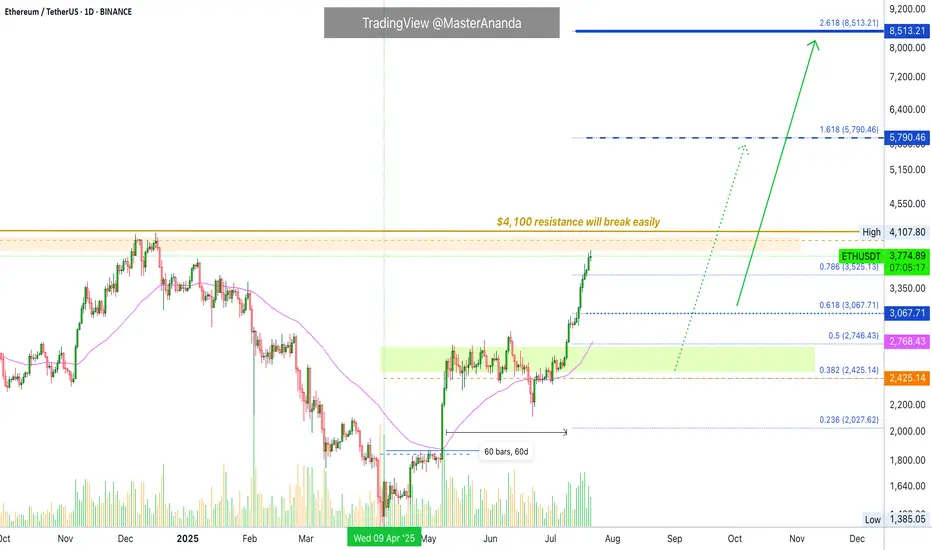
Ether Update · Accumulate, Buy & Hold · 2025 StrategyGood morning my fellow Cryptocurrency trader, I hope you are having a wonderful day.
Ethereum continues really strong and today is trading at the highest price since December 2024. Right now getting close to a long-term resistance zone that was first established in March 2024. As soon as ETHUSDT manages to break $4,100 as resistance, we can expect a major advance toward a new all-time high. Remember, sustained long-term growth, just as it is happening already. Notice the slope on the rising wave since April. It will continue just like this, prices going higher and higher until a final jump produces very high prices based on a long wick.
Market conditions have not change since our last update. Everything is extremely bullish and the chart looks even better now, the rest of the market is also looking better so the focus should be on hold and preparing a profit taking strategy. How will you profit from this trade? How do you intend to sell? How will you reduce or close your position when the time is right? You can start preparing now.
There are many ways to approach the targets but it is always wise to wait at least until a new all-time high. Since we have enough data support a new all-time high as a high probability scenario, we want to benefit as much as possible from the uptrend and thus we ignore the initial easy targets. We go for the higher targets because we are now in the 2025 bull market.
When in doubt, you don't have to be 100% right but neither 100% wrong. If you don't know how the market will behave next, instead of thinking to sell the entire position, you can sell a small portion only, say 10%. And continue like this long-term.
There are many strategies, many ways to plan and win, but for now focus on holding patiently, patience is key. Those who can wait the longer without being tempted can produce the best results. Just let it roll... The market is set to grow. Accumulation and buying now the best choice.
Namaste.
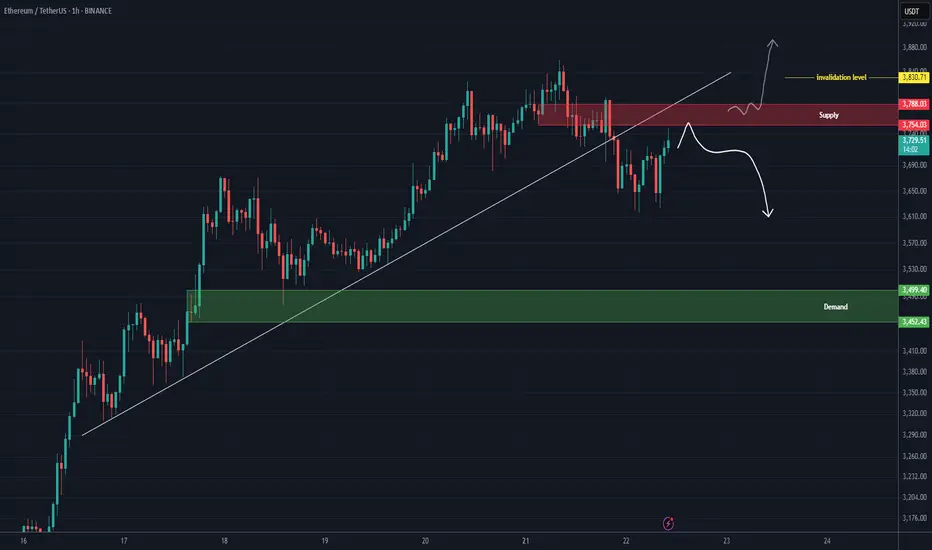
ETH/USDT: Bearish Reversal After Hitting the Decision PointHello guys!
After a strong rally, ETH finally hit the Decision Point (DP) zone marked above. Like what I said:
And we’ve already seen signs of rejection from that level.
🔹 The ascending trendline is broken
🔹 A key support got engulfed
🔹 Price is now forming a bearish structure
The target zone is mapped out around $3,500 – $3,470, where previous demand sits.
We might see a small pullback before continuation, but overall momentum is shifting downward.
Wait for confirmations and protect your capital

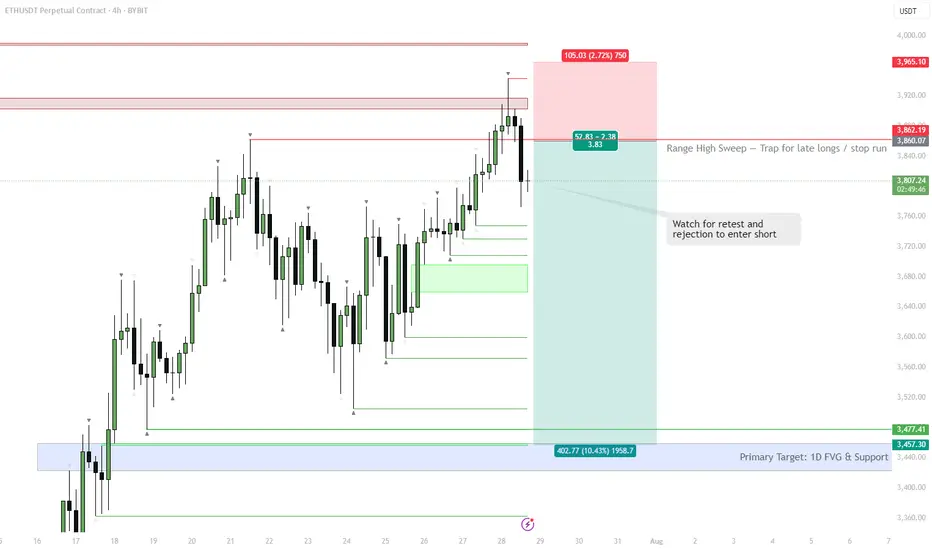
ETH | #4h #short — Range High Sweep & Short SetupScenario:
ETH swept the range high at $3,860, trapping late buyers and triggering stops. Watching for a retest of this level — if it holds as resistance and we see rejection, that’s a short trigger.
Target:
Main target is the 1D FVG at $3,457–$3,477. Possible extension: sweep of range low if selling accelerates.
Why:
Failed breakout setups are classic mean reversion triggers, especially when supported by a visible liquidity pool (FVG) below.
Plan:
Wait for a retest and rejection to confirm short. Partial TP at the FVG zone, manage risk above the sweep high.
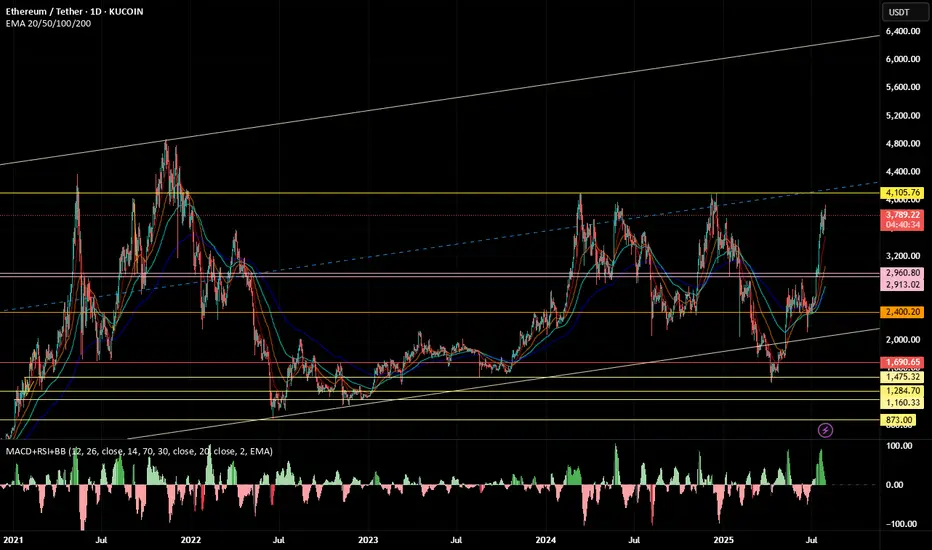
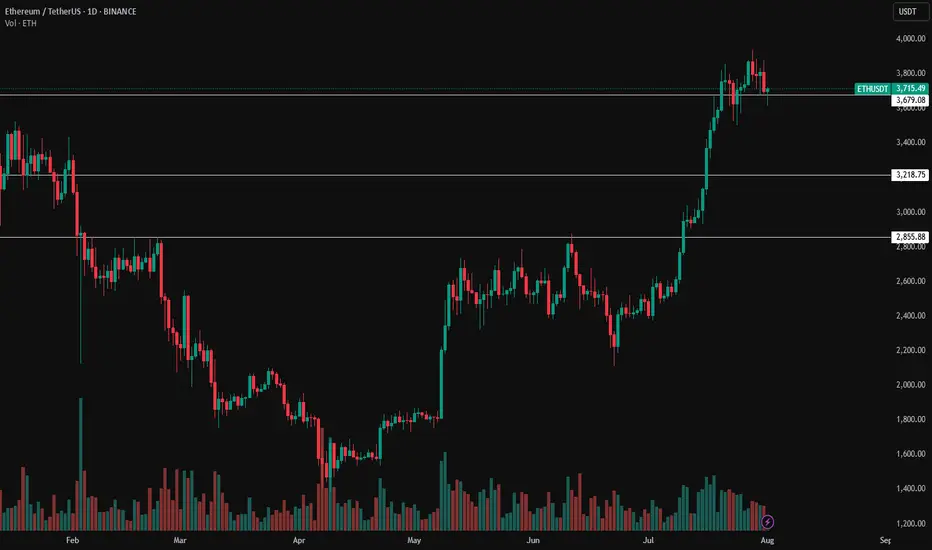
You thinking of buying ETH ? read this first
There is a saying- "Charts NEVER lie"
And here it is
ETH USDT Weekly chart, suggesting that, right now, ETH is up against resistance that has rejected it more times than it has been support.
The RSI on this chart also suggests a pull back is coming
Again, RSI has been rejected in this range more times than it found support
Conclusion -WAIT before you buy and see if it crosses that line of resistance and tests it as support before you spend your money
Just saying

ETH analysis (1H)A trendline has been broken, and a resistance zone has formed on the chart. As long as Ethereum fails to hold above the red zone, the price may experience a drop.
The green box can be considered the target.
If the price stabilizes above the red zone and a daily candle closes above the invalidation level, this analysis will be invalidated.
For risk management, please don't forget stop loss and capital management
Comment if you have any questions
Thank You
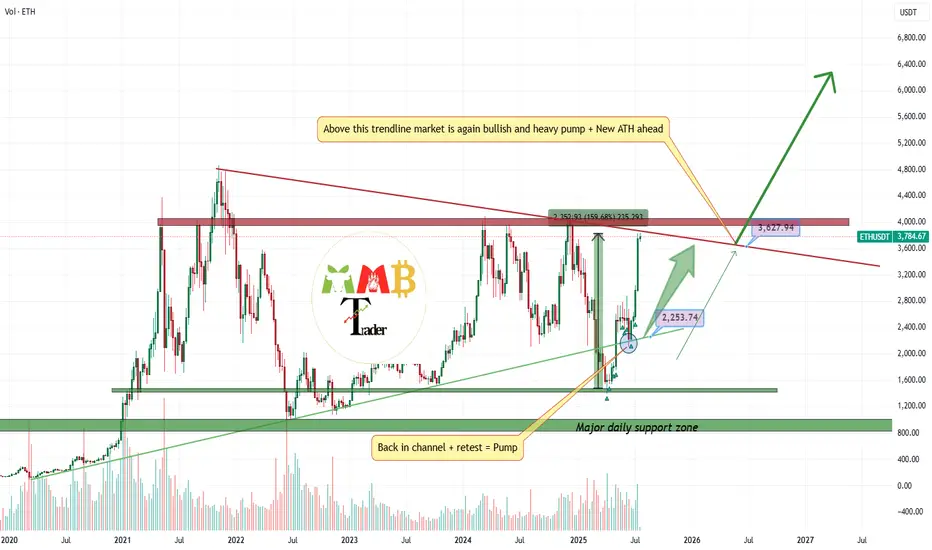
The best Buy call doesn't exists?(+160% profit on ETH)After i open long at weekly low and it almost play well until now:
\https://tradingview.sweetlogin.com/chart/ETHUSDT/BrdJLvgY-ETHUSDT-near-two-major-weekly-support-and-soon-2200/
Now i am looking for range here or without that range ASAP red trendline will break to the upside and more pump and gain also is expected and this is just the beginning.
DISCLAIMER: ((trade based on your own decision))
<<press like👍 if you enjoy💚
Ethereum Update · Minor Break Below $4,000, Nothing ChangesOk. Straight up has been confirmed but as you already know, the market never moves straight down neither straight up. It seems Ethereum is about to take a small break. This shouldn't alarm you nor be a concern, we are set for sustained long-term growth. When bullish momentum dies down, the market tends to take a break, a pause, before additional growth.
Please remember that these breaks are very tricky, they can last just a few days, say 3-6 days, just as they can go for weeks. It is very hard to predict. In fact, we don't try to predict the duration of those, we simply focus on the bigger picture and know that a new all-time high will be hit in the coming months. This new all-time high will be followed by additional growth.
The short-term can be tricky though. Ethereum will continue rising, but watch out, it can make a pause and this time can be used wisely to profit beautifully from smaller altcoins. Don't let your capital just sit around when it can grow.
Ethereum is awesome but it is also a giant. The smaller altcoins is where the true opportunities lie. The opportunity to quadruple in a matter of months. And this process can be repeated several times for the duration of the bullish cycle.
Namaste.
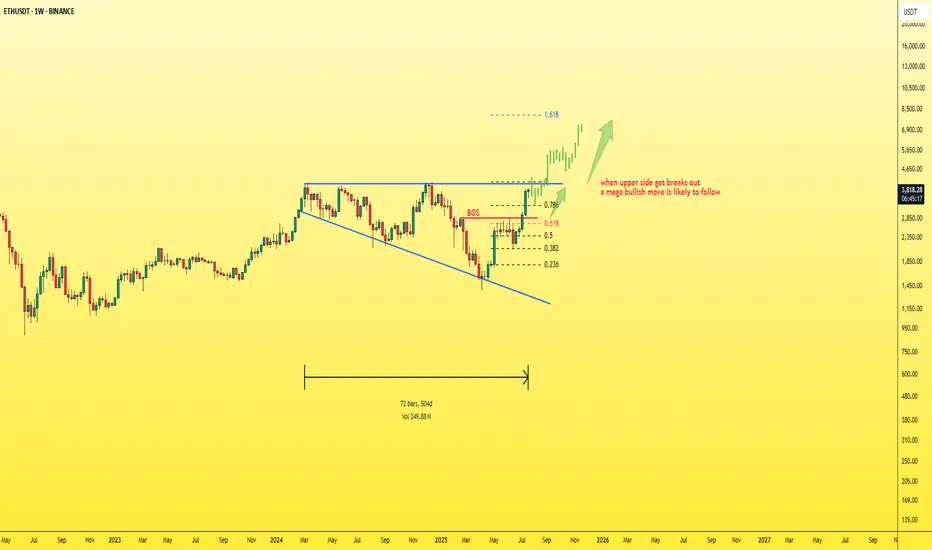
ETH - simple chart and mega moveEthereum is currently the strongest and most stable asset in the market, especially after many had lost hope in it.
Now, Ethereum is back with strength, and it’s just a few steps away from breaking out of the current pattern.
📈A breakout above the upper boundary will likely lead to a new all-time high (ATH) for ETH.
My projection: Ethereum could surpass $7,000 before the end of 2025.
Best regards:
Ceciliones🎯
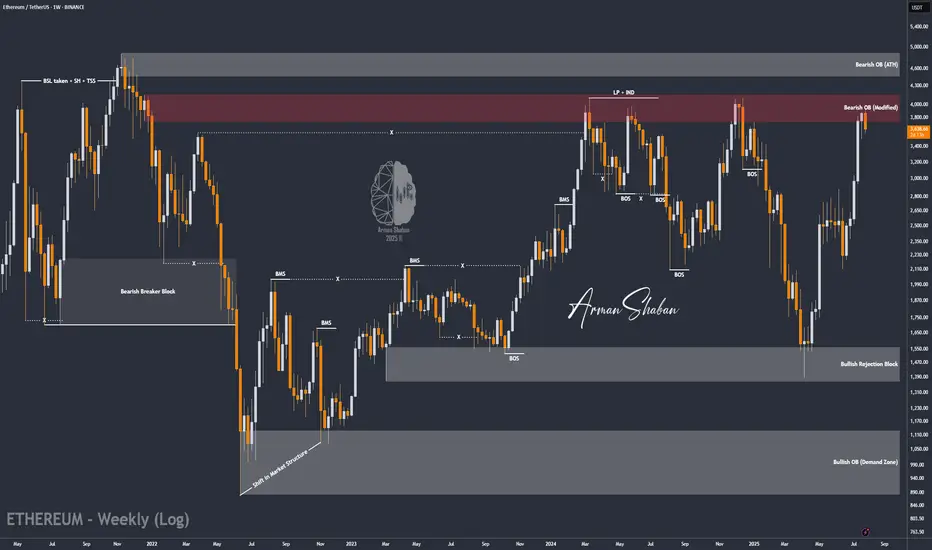
ETH/USDT | ETH Under Pressure – Watch $3500 Support!By analyzing the Ethereum chart on the weekly timeframe, we can see that after reaching the $3940 zone, ETH faced selling pressure and is now trading around $3540. If the price fails to hold the key $3500 support, a deeper decline is likely, with potential targets at $3040 first and possibly $2680 as the second bearish target.
Please support me with your likes and comments to motivate me to share more analysis with you and share your opinion about the possible trend of this chart with me !
Best Regards , Arman Shaban
ETHUSDT Classic Cup PatternEthereum is forming a textbook Cup pattern on the 1H chart, signaling a strong bullish setup. After a rounded bottom forming the “cup,” ETH is now pushing toward the neckline resistance around $3,870. A confirmed breakout above this level could lead to a powerful upward move.
Cheers
Hexa
