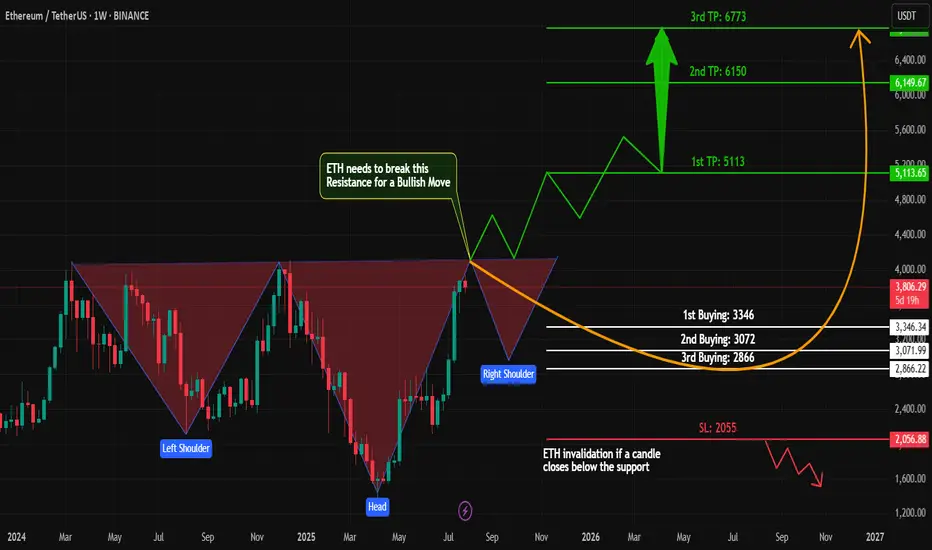
ETH Bullish – Inverse Head & Shoulders Pattern on Weekly Chart!Technical Analysis (Weekly Timeframe)
#Ethereum (ETH) is currently forming a strong bullish structure – the classic Inverse Head & Shoulders pattern – on the weekly chart.
✅ Left Shoulder ✅ Head
🟡 Now Printing the Right Shoulder...
This is a long-term spot trade setup, not for futures.
📈 Key Buy Zones:
1️⃣ First Buy: $3,346
2️⃣ Second Buy: $3,072
3️⃣ Final Support Buy: $2,866
We'll accumulate in these zones as #ETH forms its Right Shoulder.
🔓 Breakout Play:
Once #ETH breaks its All-Time High (ATH), we'll place a Buy Stop Order above the breakout level to ride the next big wave!
💬 Let me know what you think about this #ETH setup.
📌 Are you bullish on #ETH this cycle?
👍 Like, share & follow for more high-probability setups!
#ETH #Ethereum #CryptoTrading #TechnicalAnalysis #InverseHeadAndShoulders #LongTermTrade #SpotTrade #BullishCrypto #Altcoins #TradingView
ETHUSDT trade ideas
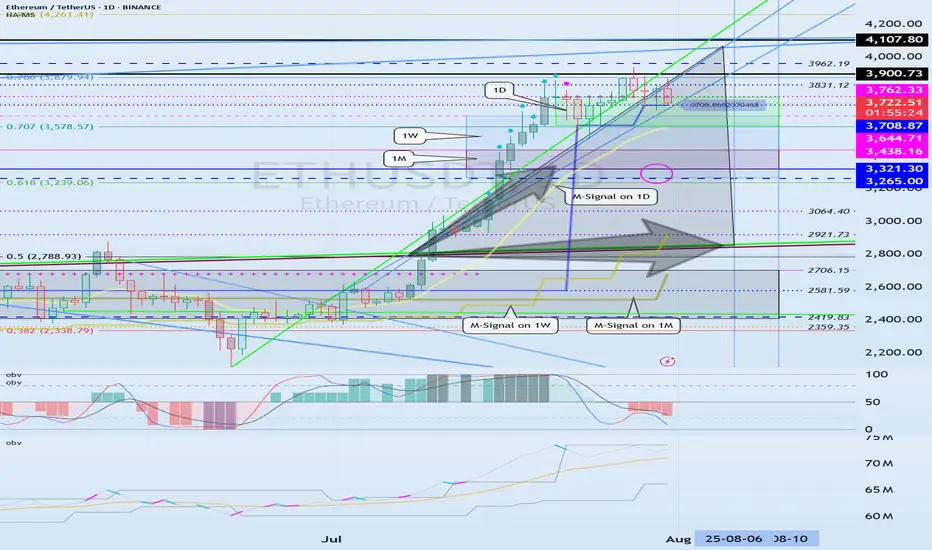
The key point to watch is whether it can rise to 3900.73-4107.80
Hello, traders. Nice to meet you.
If you "Follow," you'll always get the latest information quickly.
Have a great day.
-------------------------------------
(ETHUSDT 1D Chart)
The upward trend continues, with the M-Signal on the 1D chart > M-Signal on the 1W chart > M-Signal on the 1M chart.
Therefore, if the price holds above 3265.0-3321.30, a medium- to long-term uptrend is likely.
Currently, the HA-High ~ DOM(60) range is formed across the 3265.0-3762.33 range on the 1M, 1W, and 1D charts.
Therefore, the key question is whether support is found within the 3265.0-3762.33 range.
-
While the price is trending upward along the short-term trendline, if it falls below the short-term trendline and encounters resistance by falling below the M-Signal indicator on the 1D chart, a decline to the 3265.0-3321.30 range is likely.
ETH's volatility period is expected to last from August 6th to 10th.
The key point to watch is whether it can rise above the 3900.73-4107.80 range after this volatility period.
-
Since the StochRSI indicator has entered an oversold zone, the downside is likely to be limited.
Since the OBV indicator of the Low Line ~ High Line channel remains OBV > OBVEMA, a significant decline is unlikely.
However, since the TC (Trend Check) indicator is below zero, selling pressure is dominant.
Therefore, a decline below 3708.87 could lead to further declines. However, as previously mentioned, the decline is likely to be limited, so a significant decline is not expected.
Once the M-Signal indicator on the 1D chart is encountered, the trend is expected to re-establish itself.
-
Thank you for reading to the end.
I wish you successful trading.
--------------------------------------------------
- This is an explanation of the big picture.
(3-year bull market, 1-year bear market pattern)
I will explain in more detail when the bear market begins.
------------------------------------------------------
ETHUSDT.PIf you look at the chart, you will notice an uptrend that has somewhat lost its strength and we may not be able to hit higher highs like the next strength in the next move.
Support: 3.660 - 3.590 - 3.160
Resistance: 3.900 - 4.260
Entry: 3.700
SL: 3.500
TP: 4.240
Please control risk management.⚠️

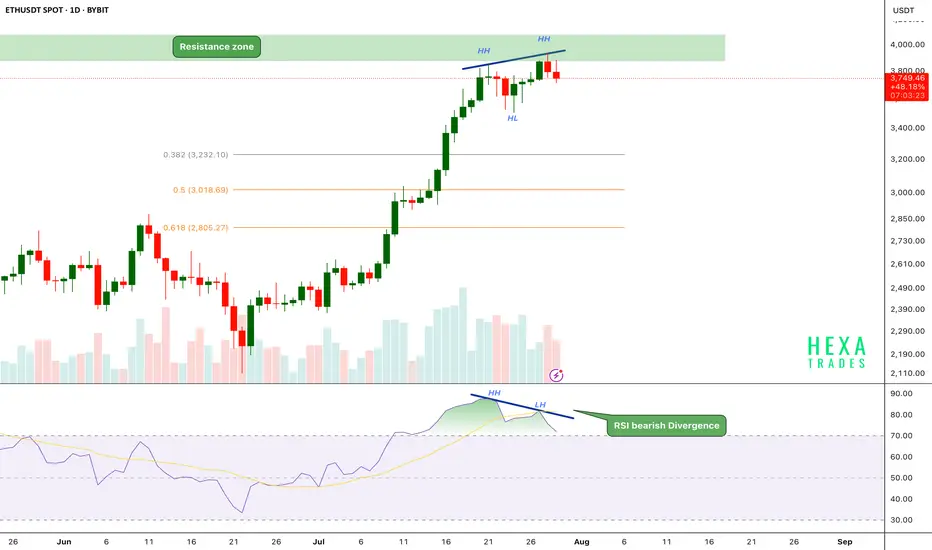
ETH Bearish Divergence!CRYPTOCAP:ETH has been in a strong uptrend, printing consistent higher highs (HH) and higher lows (HL). However, on the daily chart, the price has now reached a critical resistance zone near the $3,800–$4,000 range.
Key Points:
🔸 Bearish RSI Divergence
While price action has formed a new higher high, the RSI has printed a lower high, signaling bearish divergence.
This indicates that upward momentum is weakening even as price attempts to push higher — a common early warning of a possible short-term reversal.
🔸 Fibonacci Retracement Levels
The fib 0.382 at $3240 and 0.5 and 0.618 retracement levels are sitting around $3,000 and $2,800, respectively, potential targets if a correction follows.
🔸 Volume Profile
Volume is gradually declining as price approaches resistance, suggesting buyer exhaustion.
If the price breaks above the $4,000 psychological resistance, we could see a strong bullish move.
ETH is facing strong resistance after a powerful rally, with RSI bearish divergence and weakening momentum hinting at a possible short-term pullback. We should be cautious entering fresh longs here without confirmation.
Support: $3,200, $3,000, and $2,800
Cheers
Hexa
BINANCE:ETHUSDT BITSTAMP:ETHUSD
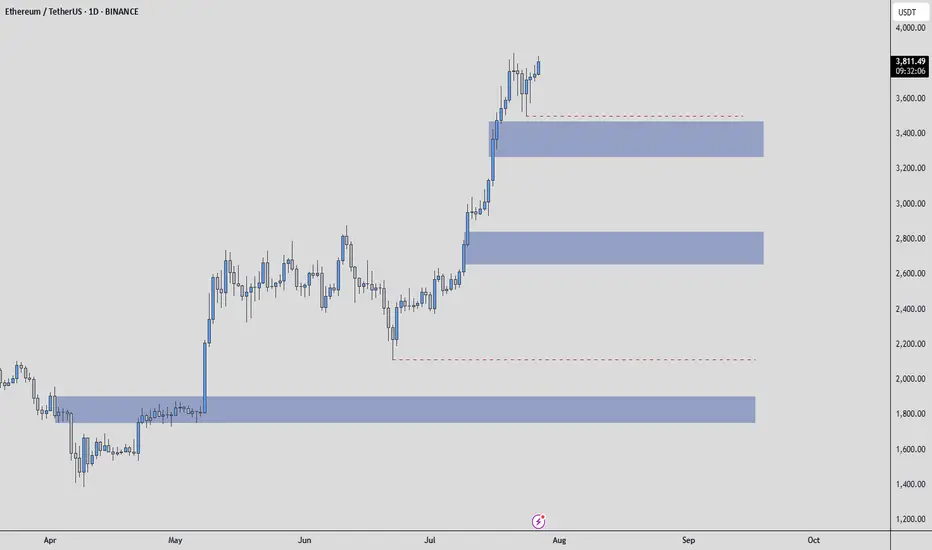
Ethereum - Possible Zones / How to use them ? Hello everyone, and special greetings to my dear friends who follow me, I hope you're happy that I helped you buy Ethereum at $2200.
Let's get to today's situation. There are many areas for Ethereum. The first blue box is the one I'd want to be the first buyer in.
I might want to be a buyer in the other blue boxes as well, but there will be increases even before these areas are reached.
I think the bottom blue box could be the one in the event of a Q3 correction.
What is a Q3 correction? All risk-on markets typically experience significant corrections in the third quarter of the year and struggle to recover from this correction until the end of the year.
The first blue box would be the first area I'd want to be in for any increases leading up to this correction.
HOW DO I GET INVOLVED!! THIS IS IMPORTANT BECAUSE SOME OF YOU LOSE MONEY WHEN BLUE BOXES ARE PULLED AWAY. THIS SHOULD NOT HAPPEN!!
When the price reaches the blue box, the transition is made to the 1-hour timeframe. Here, an upward breakout is sought, and during this breakout, the CDV is expected to be positive and rising. If these conditions are met, then RISK is taken. However, the entire amount of money isn't spent; it simply means that the conditions necessary to spend one bullet are met. One bullet is an amount that won't upset you too much; this varies for everyone.
I hope you use this analysis beneficially and profitably, because I want you to make a lot of money. Best wishes to you all, UmutTrades.
Ethereum (ETH) AnalysisEthereum (ETH), the second-largest cryptocurrency by market capitalization, continues to be a pivotal asset in the digital economy, driving the decentralized finance (DeFi), NFT, and Web3 ecosystems. Its price action is influenced by a combination of its own fundamental developments, the broader cryptocurrency market sentiment (primarily Bitcoin's movements), and macroeconomic factors.
1. Fundamental Strengths & Developments:
Ecosystem Growth: Ethereum boasts the largest and most vibrant ecosystem of decentralized applications (dApps). The majority of DeFi protocols, NFT marketplaces, and Web3 infrastructure are built on or heavily integrated with Ethereum. This network effect provides strong underlying demand for ETH as gas fees and collateral.
Scalability Progress (Ethereum 2.0 / Serenity): The ongoing transition to Ethereum 2.0 (now largely referred to as "Serenity" or simply "The Merge" and subsequent upgrades) is a critical long-term bullish factor.
The Merge (completed): The successful transition to Proof-of-Stake (PoS) in September 2022 drastically reduced Ethereum's energy consumption and introduced ETH staking rewards, making it a more environmentally friendly and yield-generating asset.
Shanghai/Capella Upgrade (completed): This enabled staked ETH withdrawals, reducing a major liquidity concern for stakers and attracting more participation in the staking mechanism.
Upcoming Upgrades (e.g., Danksharding, Proto-Danksharding): Future upgrades are focused on increasing scalability and throughput through sharding, which is crucial for lowering transaction costs (gas fees) and enhancing network capacity. Progress on these fronts generally bodes well for ETH's long-term value.
Deflationary Mechanism: EIP-1559, implemented in August 2021, introduced a mechanism to burn a portion of transaction fees. Coupled with staking, this can lead to a net deflationary supply of ETH during periods of high network activity, reducing circulating supply and potentially increasing value.
2. Price Action and Technical Considerations (General Outlook):
Correlation with Bitcoin (BTC): ETH's price often highly correlates with Bitcoin. A strong bullish trend in BTC typically pulls ETH higher, while a significant BTC correction usually leads to ETH declines. Observing BTC's technical structure (support, resistance, momentum) is crucial for predicting ETH's near-term movements.
Key Price Levels:
Support: Historically significant support levels often exist around previous highs or strong accumulation zones. These levels act as price floors where buying interest tends to emerge.
Resistance: Previous all-time highs or significant resistance zones (where selling pressure has historically been strong) act as ceilings. A decisive break above these levels, especially with high volume, can signal a continuation of an uptrend.
Market Cycles: Cryptocurrencies are highly cyclical. After periods of rapid price appreciation, consolidation or correction phases are common. These periods allow the market to digest gains, reset funding rates, and build new bases for future moves.
3. Macroeconomic and Regulatory Factors:
Interest Rates and Inflation: Higher interest rates and tighter monetary policies from central banks can reduce liquidity in financial markets, impacting risk assets like cryptocurrencies. Conversely, a more dovish stance can be supportive.
Regulatory Environment: Clarity or uncertainty from regulators (e.g., SEC in the US, MiCA in Europe) can significantly influence institutional adoption and overall market sentiment. Positive regulatory developments can instill confidence, while restrictive measures can cause FUD (Fear, Uncertainty, Doubt).
Global Economic Health: A robust global economy generally fosters a risk-on environment, which is favorable for crypto. Economic slowdowns or recessions can lead to risk aversion.
Outlook:
Ethereum remains a strong long-term investment given its foundational role in the decentralized web and its continuous technological advancements. The successful transition to PoS and ongoing scalability efforts are critical drivers.
Bullish Scenario: If the broader crypto market remains strong, Bitcoin maintains its uptrend, and Ethereum continues to deliver on its roadmap (e.g., successful sharding implementations), ETH could target new all-time highs. Increased institutional interest, ETF approvals (for ETH directly or indirectly), and sustained DeFi/NFT activity would further fuel this.
Bearish Scenario: Significant macroeconomic headwinds, a prolonged downturn in Bitcoin's price, major regulatory crackdowns, or unforeseen technical issues with Ethereum's upgrades could lead to a correction.
Conclusion:
Ethereum's value proposition is robust due to its vibrant ecosystem and relentless development. While short-term price movements will be influenced by market sentiment and macroeconomic factors, its long-term trajectory appears promising as it continues to solidify its position as the backbone of the decentralized future. Investors should closely monitor Bitcoin's price action, Ethereum's development milestones, and broader economic indicators.
ETHUSDT - SCalp your day!Small scalps, extreme targets on yellow mid targets on the green, Keep in mind that a temp spike can happen for a fall, to a great extent, maybe?

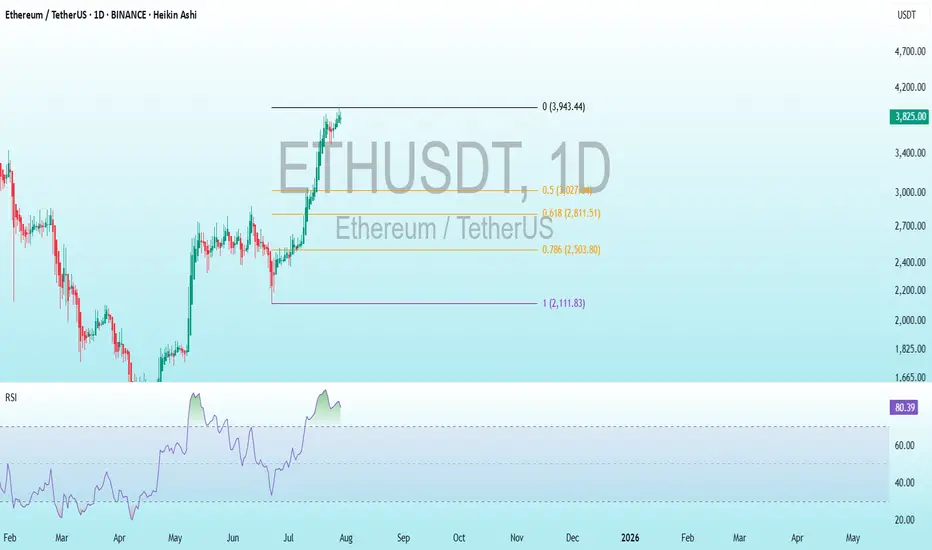
ETH Bearish DivergenceBINANCE:ETHUSDT
Rezistance Levels: 3,943.44.
Support: 2,111.83
Trade Setup:
Target 1: 3,027.64 (0.50 Fibonnaci Golden Zone).
Target 2: 2,811.51 (0.618 Fibonnaci Golden Zone).
Target 3: 2,503.80 (0.786 Fibonnaci Golden Zone).
Target 4: 2,111.83 (1 Fibonnaci).
Stop Loss: 3,943.44 (above recent high, ~25% above current price).
RSI Analysis: The RSI shows a bullish divergence (price making lower lows while RSI makes higher lows), suggesting potential upward momentum. Current RSI is around 80.39, nearing overbought territory (>70), so caution is advised.
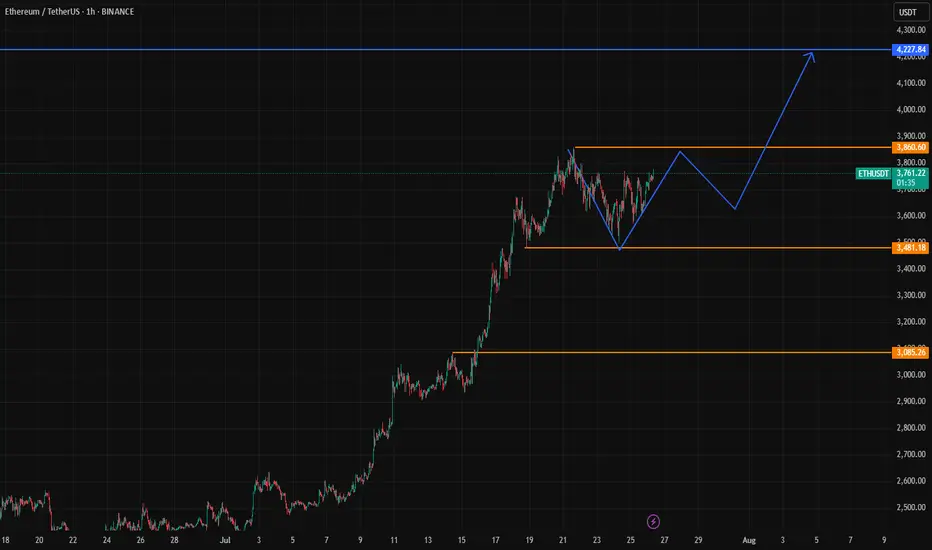
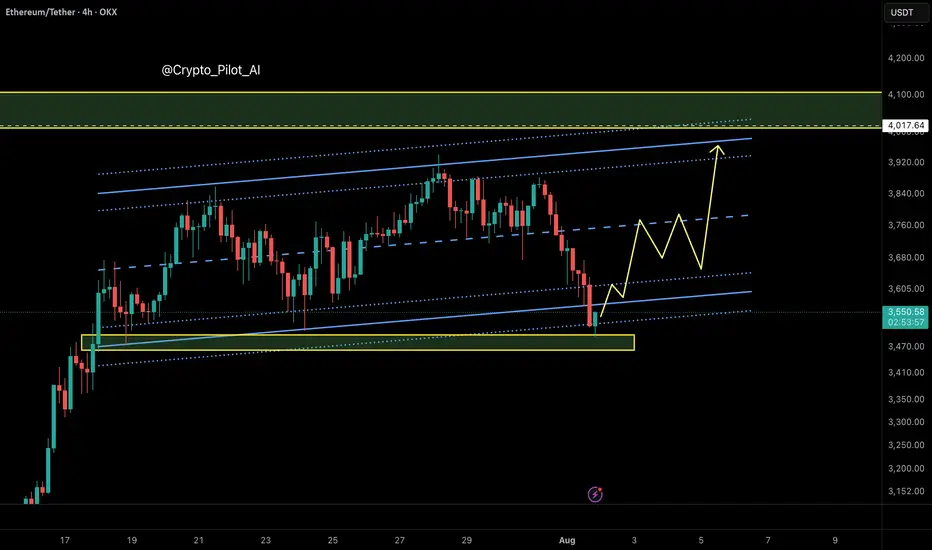
Ethereum: Smart Money Reversal After Stop Hunt?In the previous update, we warned that Ethereum might drop lower before any meaningful bounce — especially if it failed to hold the midline of the ascending channel. That scenario played out exactly as anticipated.
🟡 Price action summary:
ETH broke below the midline of the weak ascending channel, hunted the liquidity below recent lows, and tapped into the key bullish order block near $3,490 – $3,520. Price is now reacting to this zone with early signs of a reversal.
📌 Key observation:
Midlines of weak or low-momentum channels often act as liquidity traps in smart money models. Buying at these levels can be extremely risky — especially during corrective or distribution phases.
⸻
📚 Educational Note:
Never enter long positions solely at the midline of a weak ascending channel, especially when there’s a high probability of liquidity sweep below. Smart entries usually occur at order blocks formed after stop hunts.
⸻
🎯 Next steps:
Wait for confirmation (such as internal BOS or FVG closure) before entering longs. The structure suggests a potential move back toward the upper boundary of the channel if this OB holds.
⸻
🔗 Save this analysis and share it with fellow traders.
💬 Thoughts? Drop your view in the comments.
Crypto Exploded, I Missed it, What should I Buy Now?!The market suddenly exploded… green candles after green candles. Yesterday, you were hesitating to look at the chart, today everyone on social media is posting their profits. So what now? Did you miss out? It’s not too late. The main question now is: What should I buy to catch up?
If you read this analysis till the end, not only will you learn some practical TradingView tools, but you’ll also gain insight into how to act like a professional trader after big pumps not like a reactive follower.
Hello✌
Spend 3 minutes ⏰ reading this educational material.
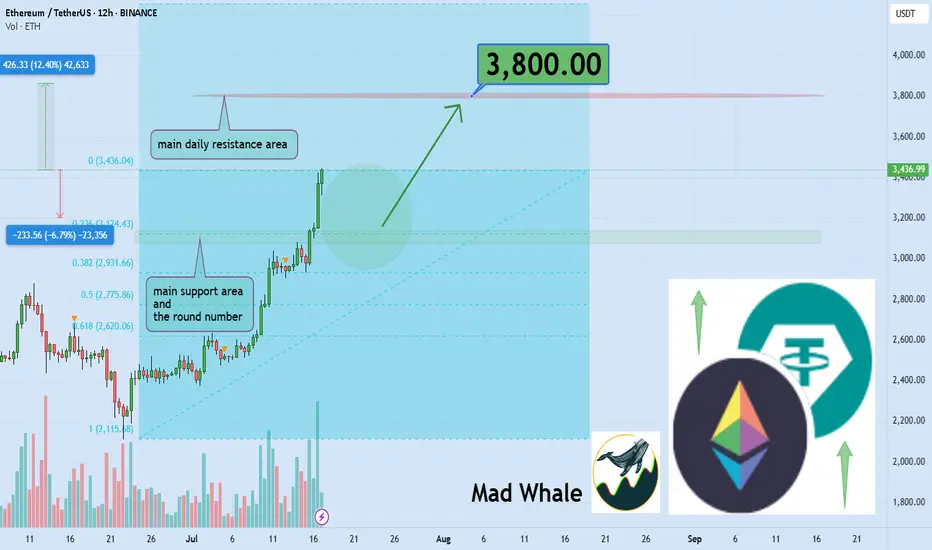
🎯 Analytical Insight on Ethereum:
BINANCE:ETHUSDT is currently holding near the daily support and the key psychological level at $3,000, which also matches the 0.23 Fibonacci retracement. A potential upside of at least 12% is expected, targeting $3,800 close to a major daily resistance zone. Keep an eye on these levels for possible trade setups 📊⚡.
Now , let's dive into the educational section,
🧠 FOMO: The Enemy That Devours Your Profits
If you feel like you missed the boat now, don’t panic. Everyone has felt that, even top traders. It’s called "FOMO." Jumping into the market without analysis and just on emotions can burn you badly. Instead of regretting, sit calmly, analyze, and wait for the right setup. The market always offers new chances you just need to know how to hunt them.
🔍 What to Buy Now? Logic Over Emotion
There are three types of coins still offering opportunity:
Coins that haven’t broken their previous highs yet
Like a compressed spring, they can jump higher with a small push.
Altcoins lagging behind Bitcoin
When BTC pumps, alts usually follow afterward.
Coins with strong upcoming fundamental news
Networks with upcoming updates or special events that generate excitement.
Don’t forget on-chain analysis. See where money is flowing.
🌟 Look for New Stars and Strong, Established Coins
After a pump, there are two ways to hunt:
🔹 New Stars
Altcoins that are just coming out of their correction phase and haven’t had their main pump yet.
🔸 Strong and Established Coins
Assets that have shown resilience, have strong fundamentals, and tend to pump again after corrections.
Balance your portfolio with both to lower risk and maximize profit potential.
🧰 TradingView Tools to Hunt Opportunities After a Pump
To avoid missing out in the second phase of the market explosion, you must use TradingView’s analytical tools correctly. Here are three key tools you should know right now:
Volume Profile
Helps you understand where most trading volume occurred. Smart money usually buys and sells heavily at these points.
RSI (Relative Strength Index)
Tells you when the market is overbought. When it drops back to the 40 to 50 range after a peak, that could be a good re-entry point.
Fibonacci Retracement
A tool to find attractive correction zones after a pump. Especially useful if you combine multiple timeframes.
⚖️ Stop Loss Is Necessary, But Take Profit Is More Important
Always place a stop loss in the market. But many forget to set a take profit in bullish markets.
Having a take profit level ensures you lock in gains when the market hits your target and avoid greed.
Key point: Even if you expect huge pumps, take some profit on time to avoid losing it all during corrections.
🪙 The Next Pump Is Just Around the Corner
Instead of jumping into a pump mid-way, focus on spotting setups just forming. Watch for consolidation candles, rising volume, and reactions to classic zones. That’s where you can enter professionally, even before everyone knows what’s coming.
🛠 Game Plan for the Trader Who Fell Behind
Pick three coins that haven’t pumped yet
Test the tools mentioned on them
Set alerts for logical entry signals
Enter with risk management, not emotion
Most importantly analyze, don’t just follow
📌 Summary and Final Advice
If you missed the market pump, don’t worry; crypto markets always offer opportunities you just need to be prepared. A combination of analysis, professional tools, and smart choices between new and established assets can help you not only catch the next pump but ride it ahead of everyone else.
✨ Need a little love!
We pour love into every post your support keeps us inspired! 💛 Don’t be shy, we’d love to hear from you on comments. Big thanks , Mad Whale 🐋
📜Please make sure to do your own research before investing, and review the disclaimer provided at the end of each post.
ETH/USDT (Monthly) – Symmetrical Triangle BreakoutPattern & Technical Setup
Ethereum (ETH/USDT) is showing a textbook symmetrical triangle pattern on the monthly chart. The pattern has been developing since the 2021 high, with lower highs converging with higher lows.
The current candle has broken out above the triangle’s upper trendline, suggesting a potential bullish continuation. This breakout is significant given the long consolidation period and strong volume profile near the breakout zone.
Trade Plan
• Entry: Around $4000 on confirmed monthly close above triangle.
• Stop Loss: Below $3,500 (safe side under breakout + previous support).
• Profit Targets:
$4,800 (measured move target based on triangle height)
⸻
Risk & Reward
• Risk: ~17% downside (stop at $2,950)
• Reward: ~253% upside to $4,800
• R/R Ratio: ~14:1 (favorable for swing trade)

Ethereum is likely to retrace before continuing its bullish moveEthereum's technicals are highly bullish, supported by strong fundamentals. According to the market structure, it may retrace to the level shown in the chart above to collect liquidity and fill orders before moving forward to All time high near 4800.

Ethereum vs SolanaIn 2025, the competition between Ethereum and Solana is no longer just a rivalry — it’s a pivotal chapter in blockchain evolution.
We are witnessing a clash of two philosophies:
Ethereum — maturity, security, and deep ecosystem
vs.
Solana — speed, efficiency, and adaptability.
📈 Price Resilience vs. Market Legacy
While Ethereum still holds the crown in market cap and institutional trust, Solana is rewriting the rules with superior transaction speed and cost-effectiveness.
The question is no longer "Who is better?"
It’s "Who is evolving faster?"
⚡ Key Drivers Shaping the Ethereum-Solana Rivalry
1️⃣ Scalability vs. Stability
Solana leads with up to 65,000 TPS, attracting high-frequency traders, NFT creators, and DeFi innovators.
Ethereum, relying on its Layer-2 solutions, tries to balance security with scalability.
2️⃣ Institutional Shifts
Funds like Galaxy Digital and Ark Invest are reallocating capital towards Solana, betting on efficiency and growth.
Ethereum, meanwhile, is waiting on ETF approvals to regain momentum.
3️⃣ Technological Innovation
Ethereum focuses on sharding and Layer-2 expansion.
Solana pushes aggressive ecosystem growth but pays the price with occasional network instability.
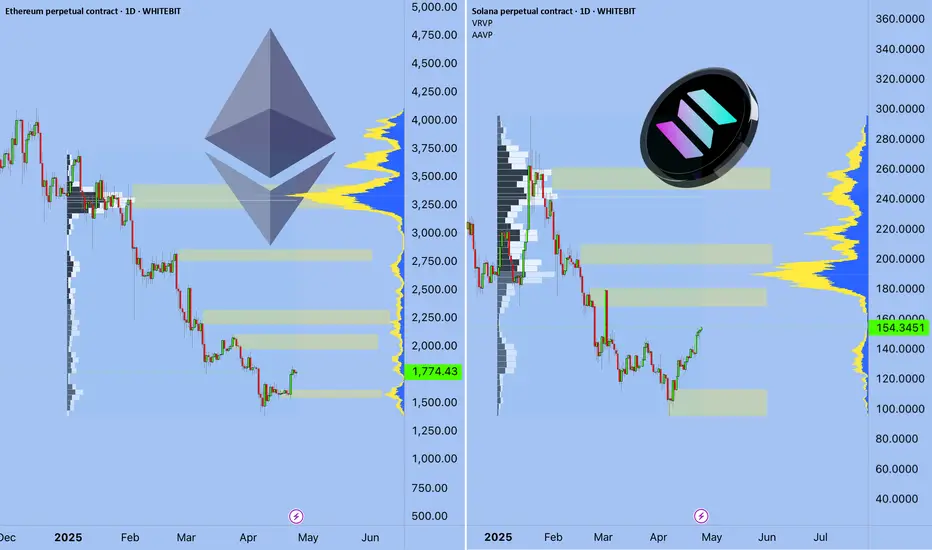
📊 Market Performance Snapshot — 2025
Ethereum: ▼ 56% YTD | ~$1,600
Solana: ▼ 40% YTD | ~$135
Solana’s DEX market share jumped to 39.6% in Q1, driven by meme coins and retail traders.
Ethereum’s dominance continues to erode under macro pressures and rising competition.
But don’t be fooled — Ethereum's foundation remains strong. Institutional adoption and infrastructure upgrades still offer potential for a rebound.
📉 ETH/BTC Looks Like a Meme
ETH/BTC:
SOL/BTC: Potential -50% in next 160 weeks ➡️
ETH/SOL:
⚡ Where Did the Liquidity Go?
The real question isn’t why ETH is dropping —
It’s why no one cares.
Layer 2 solutions — Arbitrum, Optimism, Base — have drained liquidity from Ethereum’s mainnet.
DeFi activity? → Migrated to L2
Users? → Choosing lower fees and speed
Ethereum L1? → A blockchain for whales and archives
No liquidity = No rally
No narrative = No attention
Funds are betting on Solana and L2, not Ethereum’s base layer.
🎯 When Could ETH Take Off?
Only if we see:
A strong “Liquidity Returns to L1” narrative (RWA could be a trigger)
Spot ETH ETFs launching with institutional accumulation
A new DeFi wave on L1 (unlikely with current gas fees)
Or simply — when the market decides to pump forgotten assets
For now, Ethereum is about patience.
Smart money is flowing into L2, Solana, and high-risk narratives.
🕒 But Time Will Tell...
Today, we debate ETH vs. SOL.
Tomorrow — the bull market ends, and we’ll be discussing entirely different narratives.
Are you SOL or ETH?
As always, stay one step ahead.
Best regards,
EXCAVO
______________________________
Disclosure: I am part of Trade Nation's Influencer program and receive a monthly fee for using their TradingView charts in my analysis.
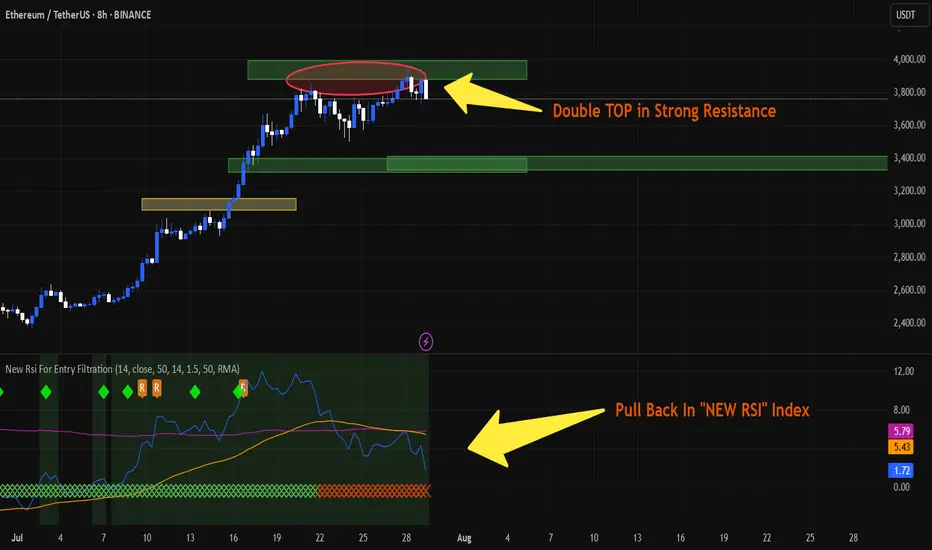
ETH is PullbackingAs I said befor, a double top has formed at around $4,000 and I guess we have a pullback to around $3,500. The "new RSI Index" is showing a pullback and strong divergence. If ETH breaks $4,000, this analysis will be rejected.
"IT is NOT a commercial advice. you may lose all your money in crypto Specially in FUTURE trading."
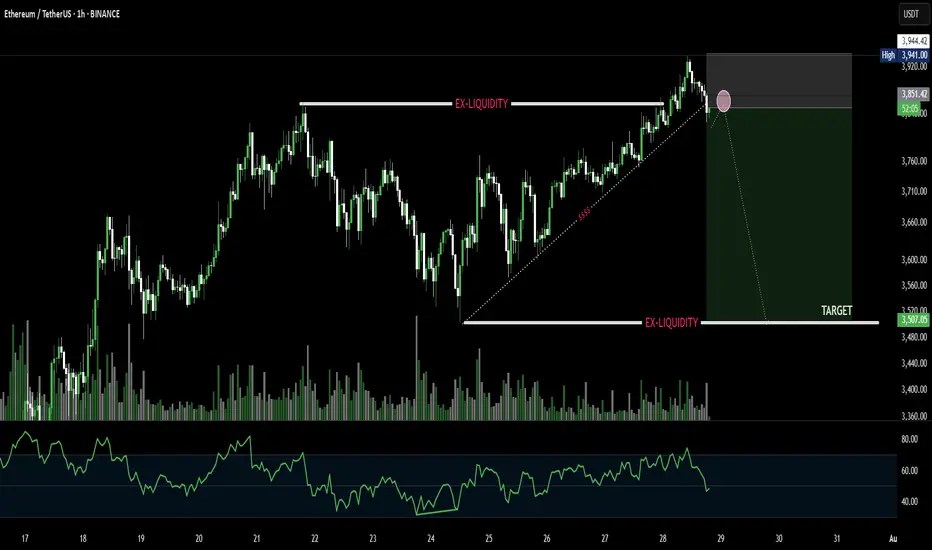
ETHUSDT short positionhi traders
🔻 Short Position Setup – Overextended at Resistance
ETH/USDT is currently trading near a major resistance zone (~$4,080–$4,330), which historically marks the top of the trading range. This level has acted as strong resistance multiple times in the past, and price is now showing signs of overextension after a sharp upward move.
📊 Technical Indicators
RSI (14): Currently overbought at 77.44, with the moving average at 81.65 — levels that have previously led to pullbacks.
Volume: Elevated during the move up, but may begin to taper as momentum slows into resistance.
🧭 Trade Strategy: Short From the Top
Entry Zone: Around current levels near $4,080–$4,330
Rationale: Shorting the top of the range with overbought RSI, expecting a retracement or range rejection
🎯 Target Zones (Take-Profit Levels)
We are monitoring multiple support levels for potential profit-taking:
TP1: $3,494
TP2: $3,133
TP3: $2,827
TP4 (max target): $2,354–$2,363
⚠️ Important Note: Although we’ve identified several potential targets, we expect to close the short position earlier — depending on how the price behaves during the retracement. We'll monitor market structure, volume, and lower timeframe signals on the way down.
🛡️ Risk Management
Stop-loss: Above the previous highs (~$4,330), to limit downside risk if the breakout is sustained
Regular monitoring is essential, as macro conditions and ETH sentiment can shift rapidly.
✅ Conclusion:
We're recommending a short trade at the top of a well-defined range, with confirmation from overbought RSI and historical rejection zones. The trade includes multiple targets, but it’s likely to be managed actively and closed partially or fully before reaching the final levels.

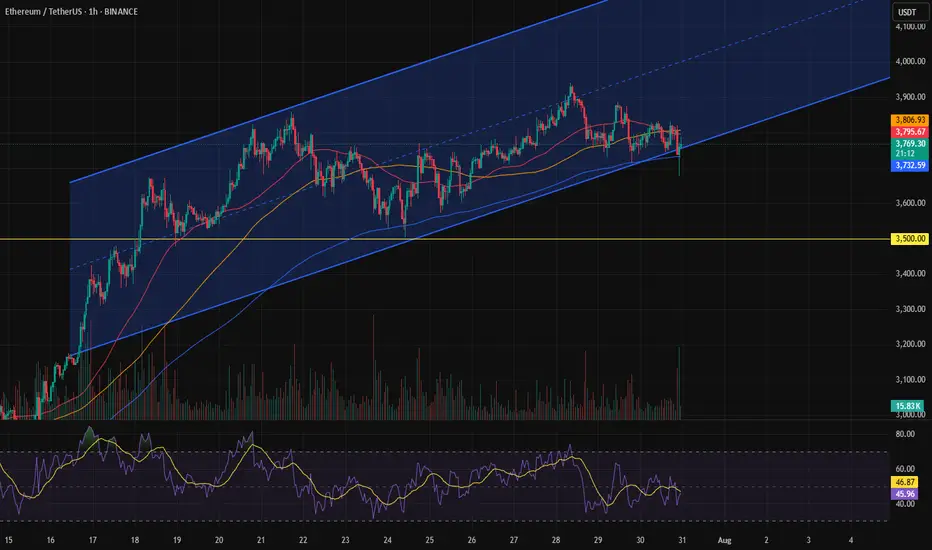
Ethereum at \$3,500 — or not?As we can see, Ethereum was moving within a channel, but toward the end, it could only reach the midline of the channel before getting rejected.
This could be a signal for a drop toward the \$3,500 area.
Otherwise, it might be a fake move, followed by a return into the channel and a move back toward the channel’s midline.
Eth Targetseth short term trade but once the market breals obver 3960 and sustain the longs will work great to 4350 level

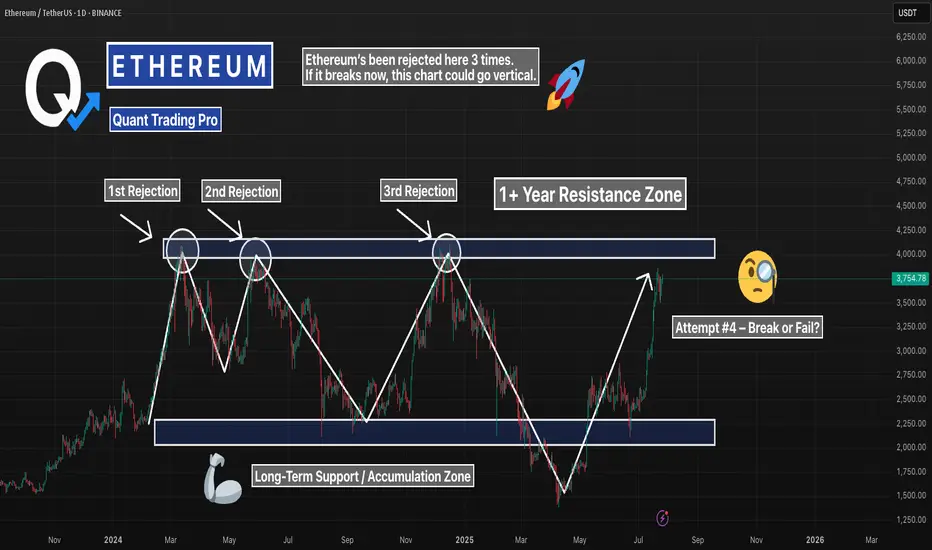
ETH Daily – Triple Rejection Zone Back in PlayEthereum’s pushing back into one of the most important resistance zones on the chart — the same level that’s caused three major rejections in the past year.
Now we’re testing it again, but this time momentum’s different. Daily structure is stronger, volume’s climbing, and bulls are showing no hesitation.
Here’s what matters:
– Triple top? If rejected again, this zone holds the trend hostage
– Break + retest? That’s the setup bulls have been waiting for
– Either way, this is a high-stakes level — and price won’t stay here long
Eyes on ETH. This zone will decide the next leg.
#ETH #Ethereum #TripleTop #ResistanceTest #CryptoTrading #DailyChart #TechnicalAnalysis #QuantTradingPro
ETH to 4095 level this week??Next major resistence if it forms a daily higher low is right into the trend Fib ex .62.
Interesting to watch where ETH goes next.

ETH at final leg of 5th WaveAre you Ready to Touch 4000$ and start BIG Drop?
ETH is in final reound of 5th wave of 5th, 5 of 5. After that I expect a BIG drop

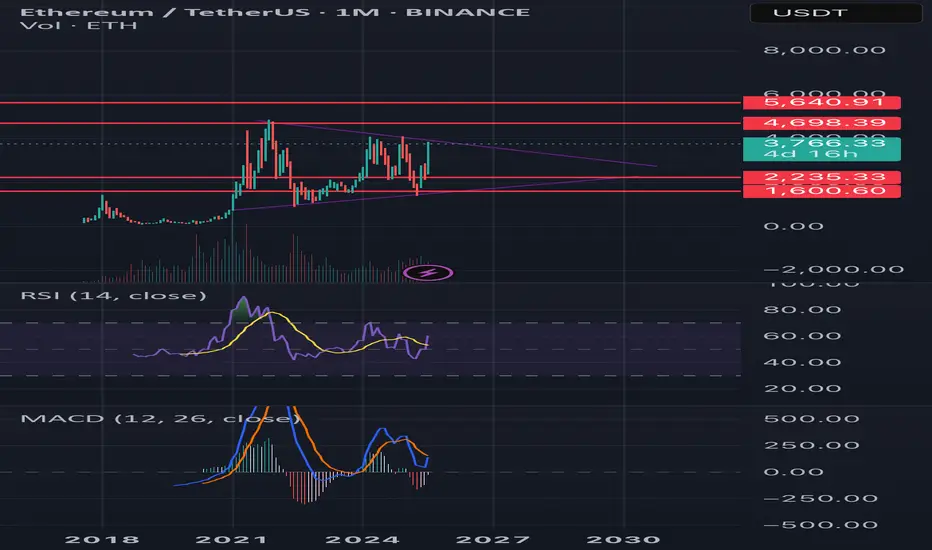
Ethereum monthly analysis Price Action & Structure:
• Ethereum is forming a symmetrical triangle, indicating a potential breakout or breakdown in the coming months.
• Key resistance levels:
• $4,698 (mid-term resistance)
• $5,640 (all-time high area)
• Key support levels:
• $2,235
• $1,600
Indicators:
• RSI (14): Currently around 50, showing neutral momentum but slightly recovering. No overbought or oversold condition.
• MACD (12,26): The blue line is attempting to cross above the orange line, a possible early bullish crossover. Histogram shows weakening bearish momentum.
• Volume: Decreasing volume inside the triangle pattern, typical before a breakout.
Outlook:
• A breakout above $4,698 with volume could target the $5,640 zone.
• A breakdown below $2,235 would open the door toward $1,600 or lower.
• Wait for a confirmed breakout from the triangle before major entries.
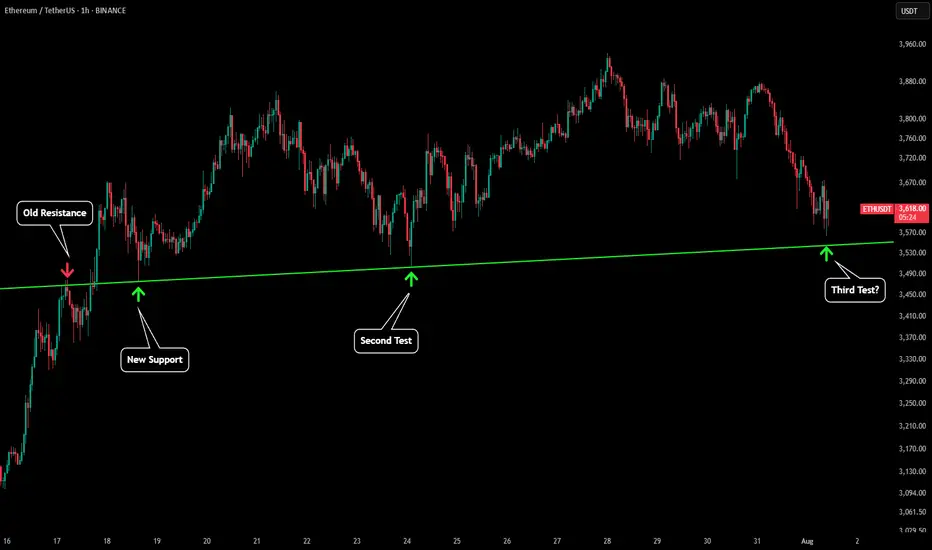
ETH - Still Respecting Important LinesPlease refer to our previous post:
Eth looks to be going for a third test of our green trendline. This would price around $3,550 which is also the 1D 21 MA. Therefore continuing to close daily candles above that price level will keep the uptrend in tact.