Ethereum will retest $3,500 ┆ HolderStatOKX:ETHUSDT bounced from $2,875 and is approaching $3,100. Breakout may target $3,250 next. Bullish structure remains.
ETHUSDT trade ideas
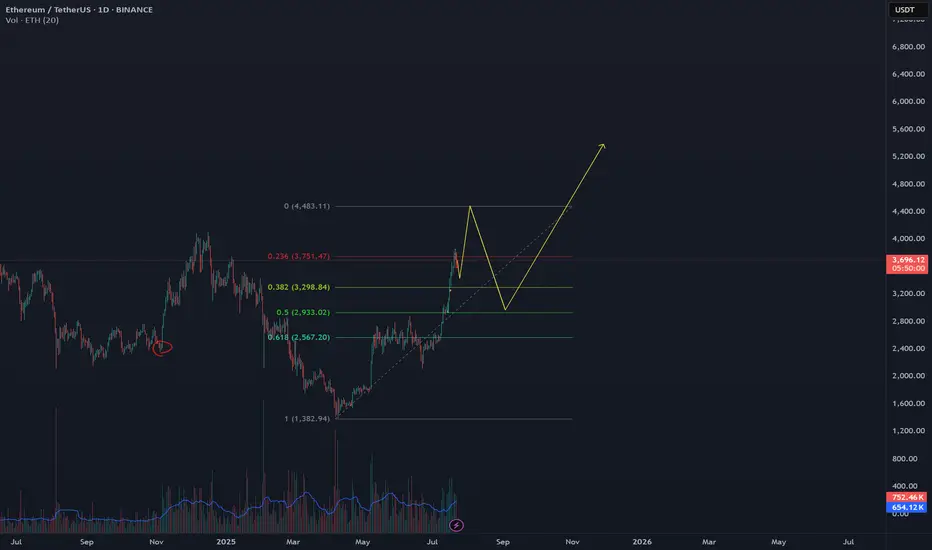
Bullish ETH Setup: $7,000, $10,000, and $13,000 TargetsHello✌
Let’s analyze Ethereum’s upcoming price potential 📈.
BINANCE:ETHUSDT , I expect a long-term upward bullish trend.
There are three main targets in this analysis: $7000, $10,000, and a final target of $13,000, which could be reached within 2 to 6 years.
The price may form parallel channels at times, which are clearly shown on the chart.
✨We put love into every post!
Your support inspires us 💛 Drop a comment we’d love to hear from you! Thanks , Mad Whale🐋
🐋Many of the points and levels shown on the chart are based on personal experience, feeling, and over 7 years of research and daily study of crypto charts.
Some of the lines, channels, and price zones are drawn to make the chart easier to understand and to help imagine possible future price movements.
I’ve also included one very big drop in price even bigger than the others because in the crypto market, it’s common for prices to suddenly fall hard and push out small investors and traders with positions.
The targets on the chart are not guaranteed; they might be reached, or they might not.📚
📜Please make sure to do your own research before investing, and review the disclaimer provided at the end of each post.

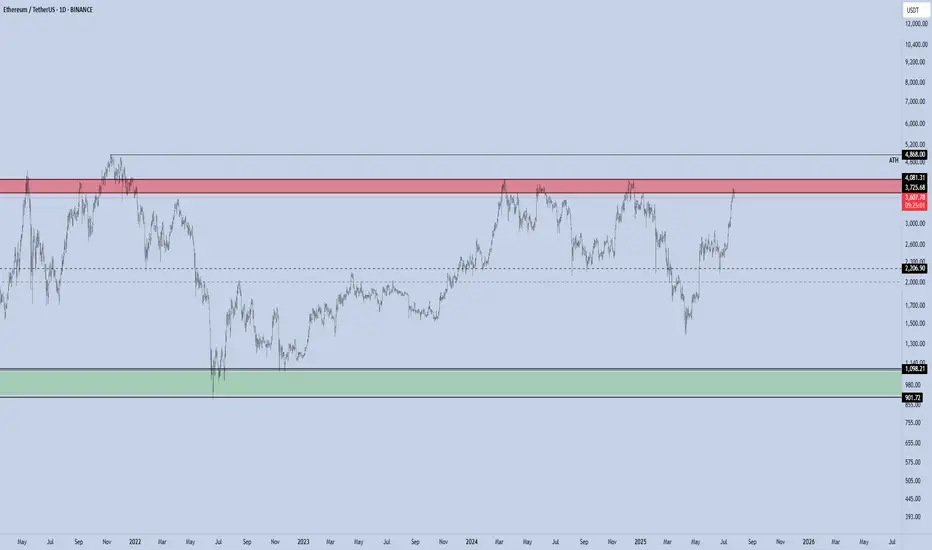
ETH - Altseason ??ETH has rallied sharply and is now entering the major resistance zone between $3,725 and $4,081, which has repeatedly acted as a local top during previous cycles.
This red zone represents a high-supply area, and historically ETH has struggled to break and hold above it without a significant catalyst.
Rejection here could lead to a pullback toward the $2,300–$2,000 range.
A clean breakout and weekly close above $4,081 would flip this resistance into support and open the path toward the all-time high (ATH) at $4,868.
If ETH reclaims this red zone and flips it to support, it will act as a major trigger for a broad Altseason.
Historically, such ETH strength is a key confirmation that capital is rotating from BTC into the altcoin market.
Currently, momentum is favoring bulls unless this red supply zone causes a strong rejection.
Ethereum Breakout Could Spark the Next Altseason!A Massive Altseason Is Brewing… 🚀
Ethereum just flashed a major monthly breakout after printing a clean Morning Star reversal right at key support.
Now it's pushing against the upper resistance zone, a structure that held it back for over two years.
If CRYPTOCAP:ETH breaks and closes above this level, it won’t just be bullish for Ethereum — it could ignite the biggest altcoin season since 2021.
Why it matters:
📌 ETH is the heart of the altcoin ecosystem.
📌Historical breakouts like this led to 1500%+ moves.
📌The pattern and price action are lining up perfectly again.
Once Ethereum breaks cleanly above $4,000, expect altcoins to explode across the board — Layer 2s, DeFi, AI tokens, and even the meme coins could all start flying.
Keep your eyes on ETH. Its breakout is the spark… the altseason fire is coming.
DYOR | Not Financial Advice

Check if HA-High indicator is forming at 3587.13
Hello, traders.
If you "Follow", you can always get the latest information quickly.
Have a nice day today.
-------------------------------------
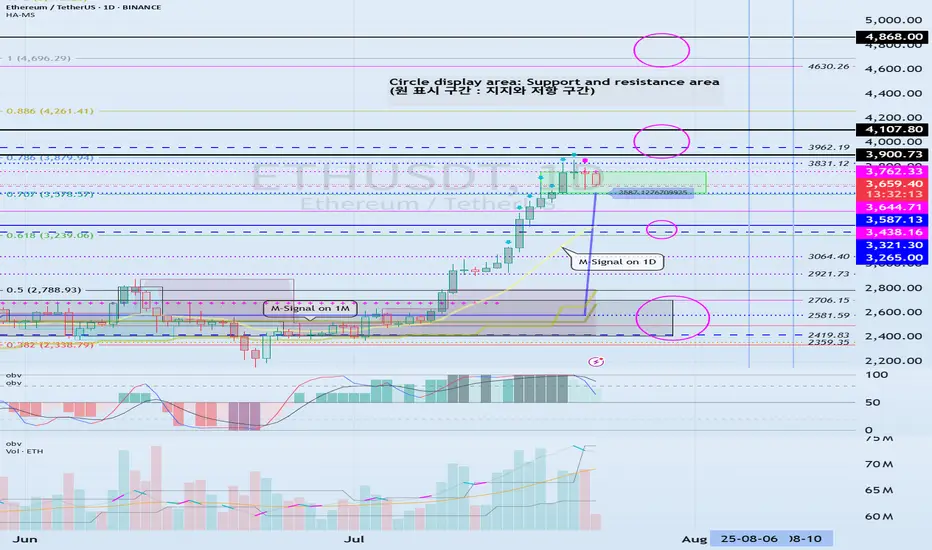
(ETHUSDT 1D chart)
HA-High indicator is showing that it is about to form at 3587.13.
Accordingly, if the HA-High indicator is newly created, the support in the 3587.13-3762.33 section is an important issue.
If it falls below 3587.13, it is likely to touch the M-Signal indicator on the 1D chart.
Therefore, we should check whether it touches the area around 3265.0-3321.30 and rises.
-
This can be seen as a time to test whether it will continue the first step-up trend while rising in the important section of 2419.83-2706.15.
ETH's volatility period is around August 6-10, but we should check what kind of movement it shows after passing the volatility period of BTC.
-
Thank you for reading to the end.
I hope you have a successful transaction.
--------------------------------------------------
- This is an explanation of the big picture.
(3-year bull market, 1-year bear market pattern)
I will explain more details when the bear market starts.
------------------------------------------------------
gold vs ethIf we follow this fractal, we should top around $4k and then a pullback to $3k followed by news highs in Q4
HolderStat┆ETHUSD approaching $4kOKX:ETHUSDT continues its move after breaking above $2,900. Next resistance sits around $3,500. Uptrend remains intact while above $2,875.

ETH — Perfect Long Play: Pullback & 1W Breaker Reclaim
After the strong move, price is likely to retrace as longs get trapped and late buyers take profit.
Best scenario: ETH pulls back to the 1W breaker zone ($3,141–$3,456), which previously acted as resistance and could now flip into support.
Watch for bullish reaction and confirmation in the 1W breaker zone.
If support holds, enter long — targeting a return to the range high and then the liquidity zone ($4,108+).
Invalidation if ETH closes below the 1W breaker or loses range low ($2,876) support.
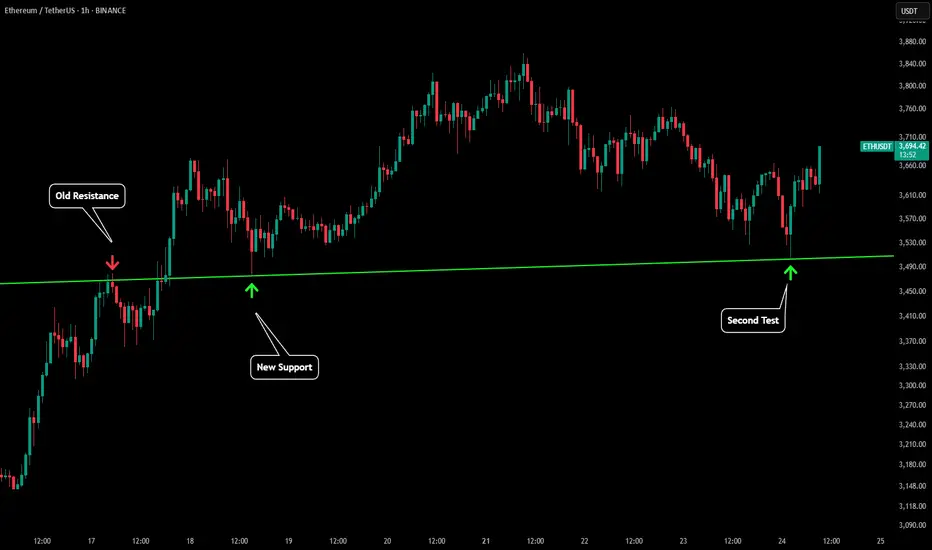
ETH has rallied hard. After such a move, it’s normal for price to pull back and test old resistance as new support. The ideal long is on confirmation of a bounce from the 1W breaker zone, which keeps risk controlled and sets up for a continuation move higher. This approach avoids FOMO and protects against reversal if the breakout fails.

ATH FOR Ethereum!!!Hello friends🙌
As you know, Ethereum has been on an upward trend these days and we can say that buyers have entered, but not completely...👀
🔊Now, considering the resistance that Ethereum is facing, namely the number 3900 to 4100, we need to see what reaction the price will see this time when the price reaches this resistance for the 4th time?
✔We will most likely make a small correction and this time this major resistance will be broken again and we will witness a higher ceiling.
✔Otherwise, I have an important and key support that we have identified for you and if the price drops, this support is a good area to buy again.
And finally, observe risk and capital management⚠
🔥Follow us for more signals🔥
*Trade safely with us*

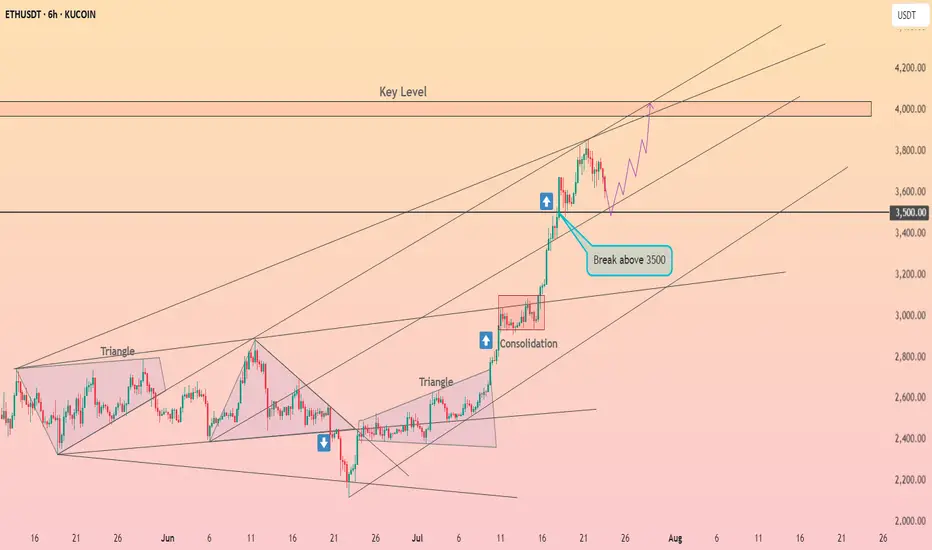
Ethereum’s $4,000 Target Alive as Historic Rally Signs EmergeBINANCE:ETHUSDT is currently trading at $3,680, just 9% away from the critical $4,000 resistance that many investors have been waiting for over the past seven months. The altcoin is expected to continue its upward momentum despite the recent consolidation, with the potential to breach the $4,000 mark soon.
Looking at broader technical indicators, the NUPL (Net Unrealized Profit/Loss) suggests that BINANCE:ETHUSDT is poised for a significant rally . The NUPL indicator, when reaching a threshold of 0.5, traditionally signals a pause in the uptrend, followed by a sharp rally.
$ BINANCE:ETHUSDT is currently nearing this threshold , which, in the past, has marked the beginning of powerful upward price action.
As long as BINANCE:ETHUSDT remains above its key support levels, the price is likely to surge toward $4,000 . If Ethereum can maintain its momentum, a breach of $4,000 could act as a catalyst for further gains.
However, should unforeseen selling pressure arise, $BINANCE:ETHUSDTprice could slip below the $3,530 support level. In such a scenario, Ethereum may fall to $3,131, invalidating the current bullish outlook. The key will be maintaining support and capitalizing on the retail-driven surge.

Ethereum - Time to buy again!Exactly, based on previous analyses, the price is rapidly approaching $4,000. But we need to be cautious because whenever it hits round numbers, something big usually happens!!!
previous analysis
Best regards CobraVanguard.💚

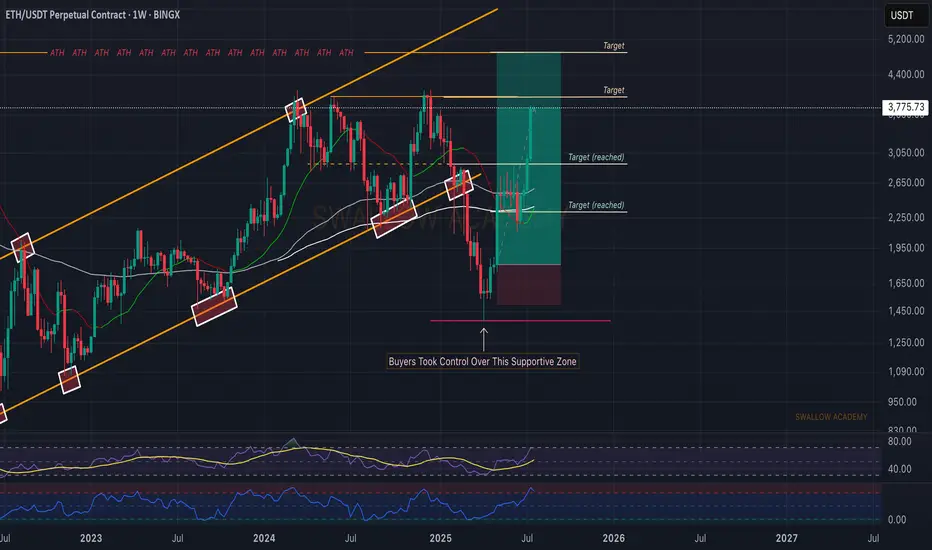
Ethereum (ETH): 2/4 Targets Reached | $4000 Incoming Ethereum has been outperforming BTC in every way; since our entry on this trade, we have had 112% movement, and soon our third target is going to be hit.
As mentioned, $4000 is our next target, where we are expecting to see some kind of strong rejection due to the round number, where usually a lot of liquidity is sitting.
So currently we are aiming for $4K and once we are there, we will be monitoring the markets to see if we will expand further or go into a smaller correction!
Swallow Academy
ETH - Perfect Test & BounceTo fully understand this post you will need to refer to our 3 previous posts. Here is the play by play of chart analytic mastery.
In this first post we made almost 2 weeks ago we outline "ETH'S CRAZY IMPORTANT LINES". In this post there were a lot of lines drawn and what we were saying was ETH was about to have a 20%+ rally to test the green trendline that we labeled "WATCH TRENDLINE".
Then we made an updated post titled "ETH - CHARTS DONT LIE" once price had teleported to our green trendline. This was establishing our green trendline as a very key level.
Once price had broken above the green trendline we made a post titled "ETH - PULLBACK INCOMING". What we said was ETH was likely to have a pull back that would bring us back to the green trendline marked "first support".
Fast forward 3 days and to the exact dollar price tested the green trendline and has seen a solid bounce so far! Hope you have been able to follow the incredible technical provided in real time by Viaquant!
ETH Just Lost Key Support — Next Stop: $2,879?Ethereum (ETH) appears to be losing steam on the 4-hour chart as it fails to sustain above the critical $3,860 resistance level. After a strong rally, the price structure has started showing signs of exhaustion — the previous bullish momentum has clearly stalled, and ETH is now forming lower highs and lower lows. This breakdown marks a potential shift in trend, especially considering the clean rejection from $3,860 with several upper-wick rejections signaling aggressive selling pressure.
The green ascending trendline, which supported ETH throughout its recent rally, has been breached. Price has broken below the trendline and is now moving in a declining structure highlighted by the recent bearish wave. Sellers have stepped in, and the most recent candles indicate a bearish continuation setup forming just below a failed support-turned-resistance near $3,533.
There’s a visible trade setup taking shape:
• Entry: $3,530–$3,550 (post-retest of broken trend support)
• Stop-loss: $3,650 (above recent local highs)
• Target 1: $3,200 (key support level)
• Target 2: $2,879
• Target 3 (extended): $2,635 if downside pressure intensifies
This short setup offers a solid risk-reward ratio, especially if momentum accelerates below $3,500. The sell signal seen earlier aligns with this potential reversal zone, and unless ETH reclaims $3,650 with volume, the bears look likely to stay in control.
In summary, ETH on the 4H timeframe is now trading below major support, with a bearish structure, trendline breakdown, and rejection at resistance — all aligning for a short-biased move in the coming sessions. Any bullish invalidation would require ETH to push and close above $3,650 convincingly. Until then, the path of least resistance appears downward.

ETHUSDT LongThis is not a financial advice. I don't sell signals or tips. It's just for educational purposes.
$ETH | Ready to fly (Inverted head and shoulders)BINANCE:ETHUSDT.P
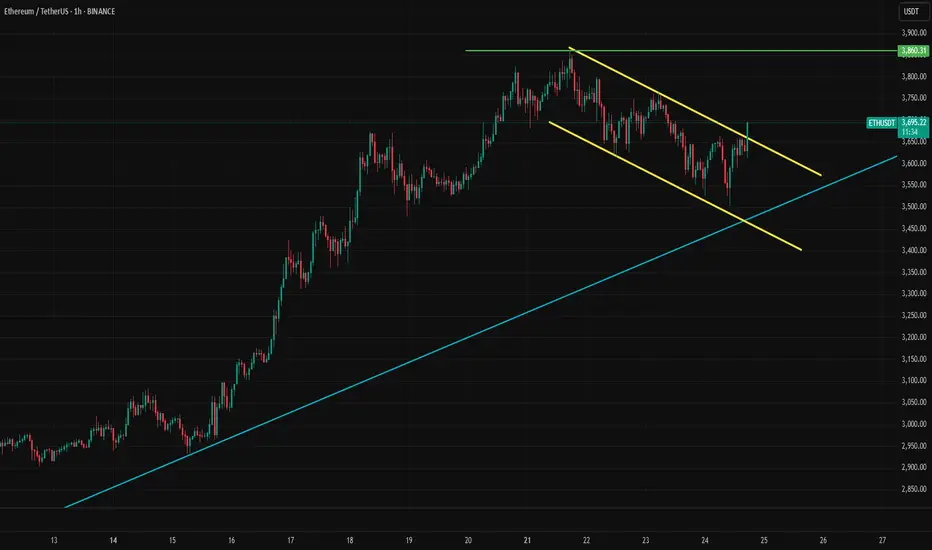
On 1H TF, the price is forming inverted head and shoulders pattern, which is a strong bullish pattern.
The price has retested the trendline support and bounced back.
Expecting it to breakout above yellow line soon.
A breakout above the yellow line will be a bullish and pattern confirmation.
We can initiate a long entry from here.
Please do proper risk management and must use stop loss.
NFA, DYOR

Sell opportunity?If the trendline breaks in the lower timeframe, a short position can be taken down to the bottom of the channel.**
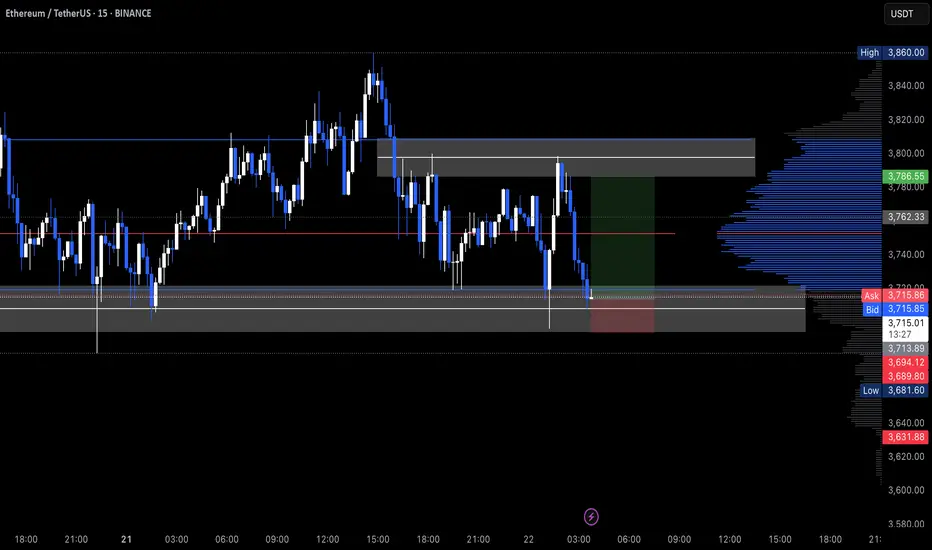
SELL ETH 25.7.2025Reversal trade order: SELL at H1~M15
Type of entry: Limit order
Reason:
- Candle creates reverse number 1 model
- The bottom hasn't touched any peak yet (meaning it hasn't reached a strong reversal zone)
Note:
- Management of money carefully at the price of bottom of M5 (3,716)
Set up entry:
- Entry sell at 3,751
- SL at 3,776
- TP1: 3,716
- TP2: 3,670
Trading Method: Price action (No indicator, only trend and candles)

Ether is About to Break the FlagETH is making an attept to break flag formation. 3860 top could be the short term target for upward moves. Over the medium term, 4100 could be the main target. Our bull cycle top target is 6830 for the moment. This was a quick update,please check our earlier post for details.
ETH – Potential liquidity sweep before major continuation?While I remain long-term bullish on ETH, I’m currently eyeing a potential short-term sweep of liquidity before continuation.
Price has formed a rounded top structure and is approaching a key 12h/1d liquidation zone near 3680–3700. I expect a potential fakeout to the upside, triggering stop-losses and short liquidations, before a reversal targeting the 3500–3400 area completing the rounded top structure, which also comfortably re-tests a bunch of unmitigated bullish FVGs, and also the 0.382 level since the major rally.
This is how I imagine the next leg up.
🔁 Trade Plan: small position size with 10x leverage on futures only. This is a counter-trend play against my main spot ETH position, which remains strongly bullish.
🚨 Not financial advice. Just sharing the setup I’m watching. Let’s see how it plays out.

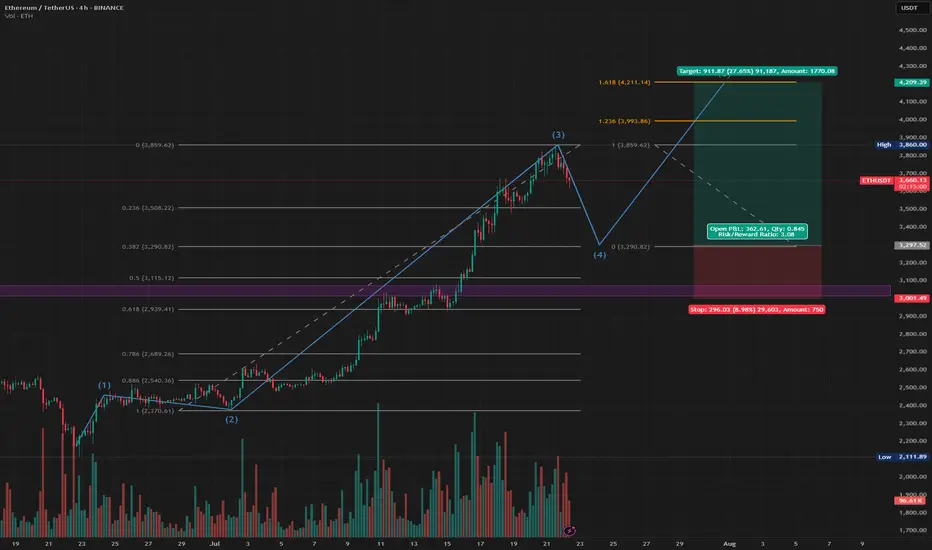
ETH Long Closing July 2025 - Elliot Waves 4-5Elliot Wave setup on the ETH 4h chart. We're now in wave 4, which should be steep since wave 2 was shallow. so targeting the .382 fib for a long entry at $3290 (most likely) - but could go down to the .5 fib for a lower entry ($3115). SL just lower than the DOL on the weekly HTF (end of Nov). Wave 5 should run to $3993 or $4211 (TP at both).
If you're feeling brave, you could also short the rest of wave 4, but be aware this is going against the market upwards momentum and BOS in BTC dominance.
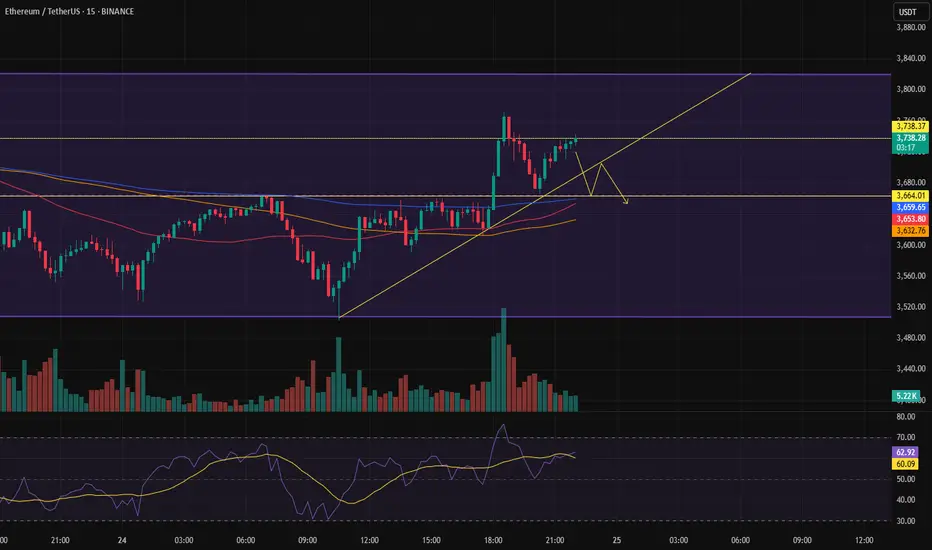
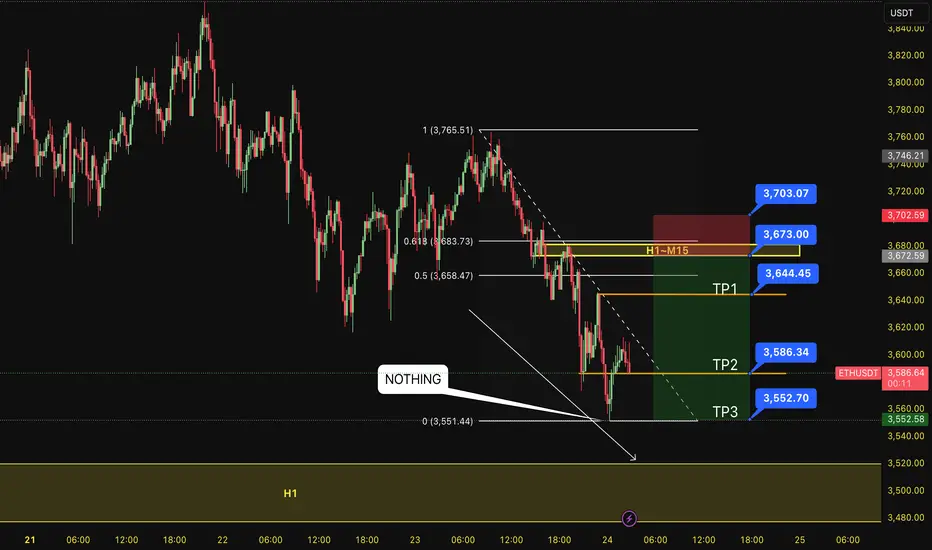
SELL ETH 24.7.2025Confluence trade order: SELL at H1~M15
Type of entry: Limit order
Reason:
- The bottom doesn't touch anything. It is expected to continue to decline into H1.
- Keylevel H1~M15~FIB 0,5-0,618
Note:
- Management of money carefully at the price of bottom (3,644)
Set up entry:
- Entry sell at 3,673
- SL at 3,703
- TP1: 3,644
- TP2: 3,586
- TP3: 3,552
Trading Method: Price action (No indicator, only trend and candles)
ETH risk of further downside moves 1HR chartIf ETH breaks $3539, could see a further drop to next support. This is short time frame, the bigger Macro trends are still in tact.
