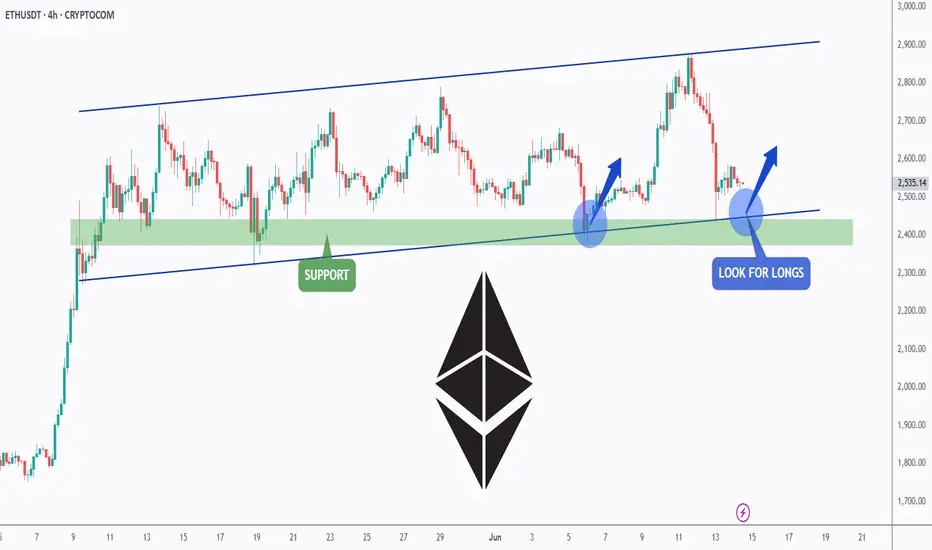
ETH is doing it AGAIN!Hello TradingView Family / Fellow Traders. This is Richard, also known as theSignalyst.
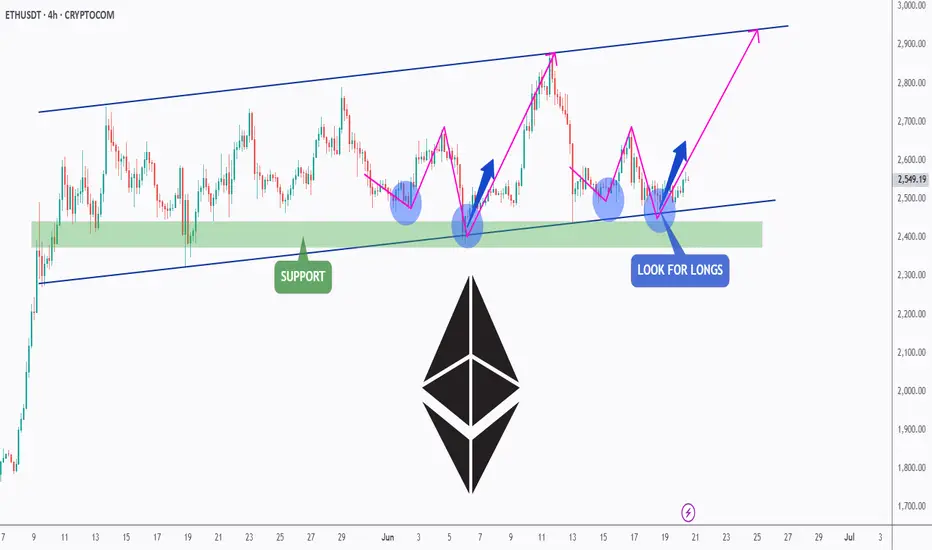
📈ETH has been overall bullish trading within the flat rising channels marked in blue.
Moreover, the green zone is a strong support zone!
🏹 Thus, the highlighted blue circle is a strong area to look for buy
Related pairs
Bitcoin Or Gold? Real Safe Haven In Middle East tension When the world shakes, where does money go— Bitcoin or gold ?
You may think crypto is the ultimate safe haven… but data tells a different story.
This breakdown compares digital dreams vs. physical trust —with charts, tools, and the psychology behind every move.
Hello✌
Spend 3 minutes ⏰ reading t

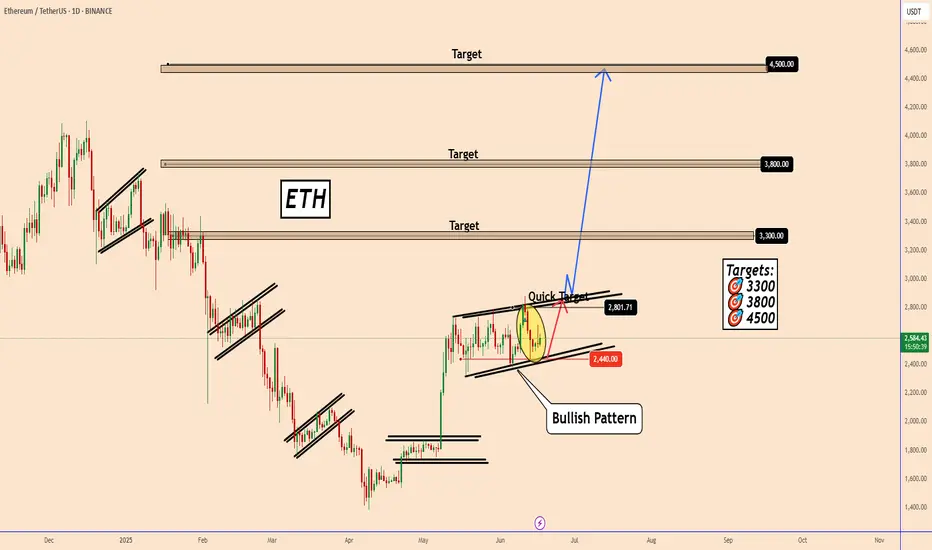
Ethereum: Is a Major Bullish Wave Coming?Ethereum: Is a Major Bullish Wave Coming?
Following our previous analysis, ETH dropped from $2,770 to $2,440, aligning with one of the anticipated price scenarios.
The support zone near $2,440 once again demonstrated its strength, pushing the price back up to $2,660. Given the strong accumulation
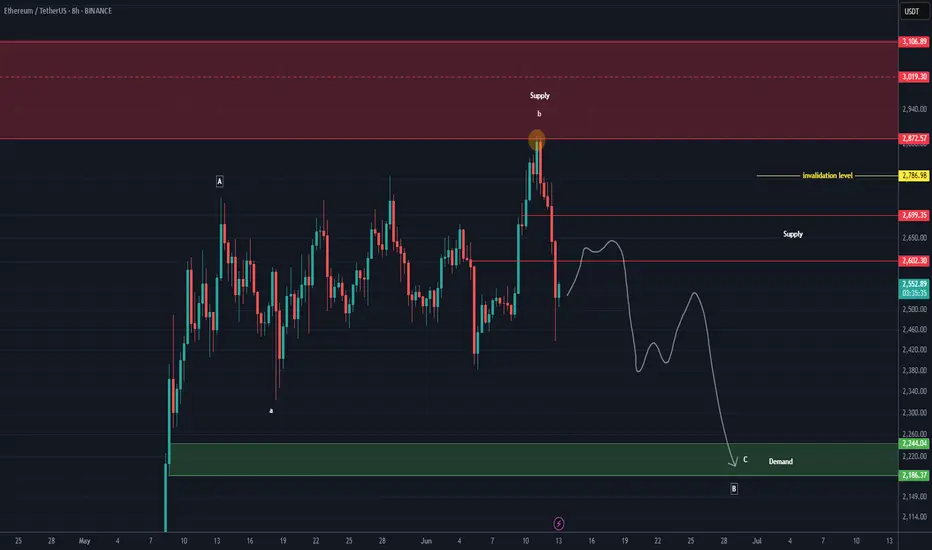
ETH NEW UPDATE (8H)This analysis is an update of the analysis you see in the "Related publications" section
After the pump and hitting the red zone, it got rejected.
It's better not to open a short position on Ethereum, as its dominance appears bullish | which means it might be resilient against a potential drop.
T
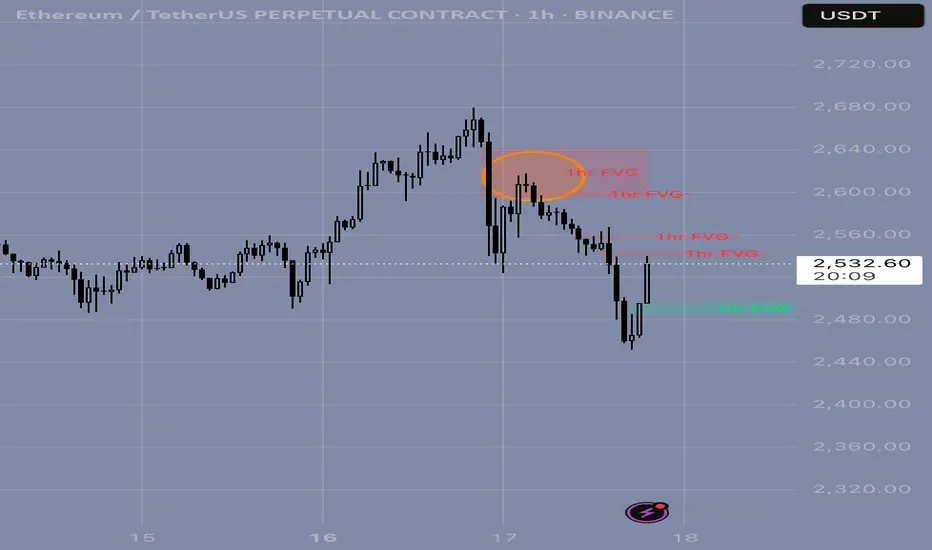
ETH Short – Smart Money Setup | 17.06 🔍 Context:
After a strong dump on ETH, clearly visible on the 1H chart (left side of image), I waited for a retrace into the Fair Value Gap (FVG) zone — typical Smart Money behavior. That’s where I started looking for a short setup.
🎯 Entry Logic:
Now here's the part I’d love to discuss with you.
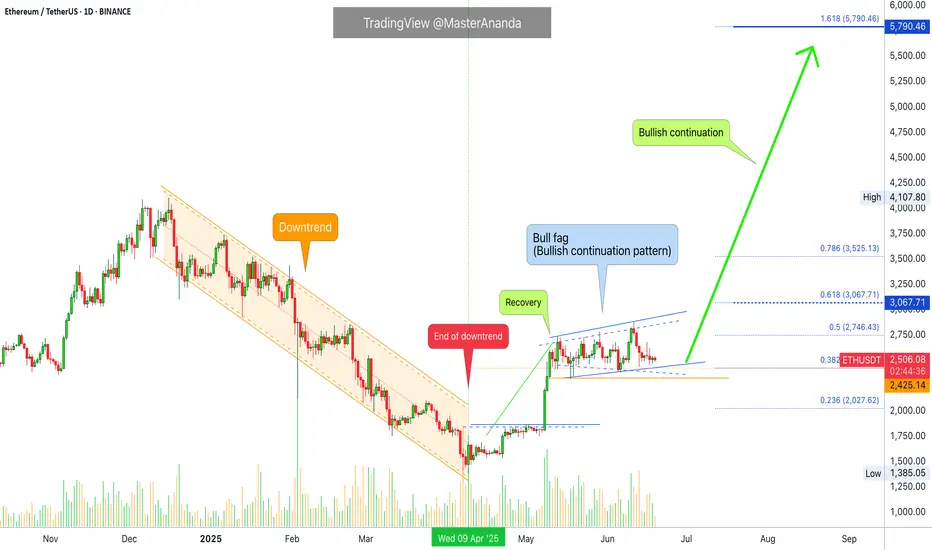
Ethereum, Bullish Breakout Expected Any Moment Now!Look at this, the first peak for Ethereum happened 13-May after the start of the recovery and the end of the downtrend. The lowest point happened five days later on 18-May and there has been no new lows since. Ethereum has been in a bullish consolidation pattern, a classic bullish flag.
This kind o
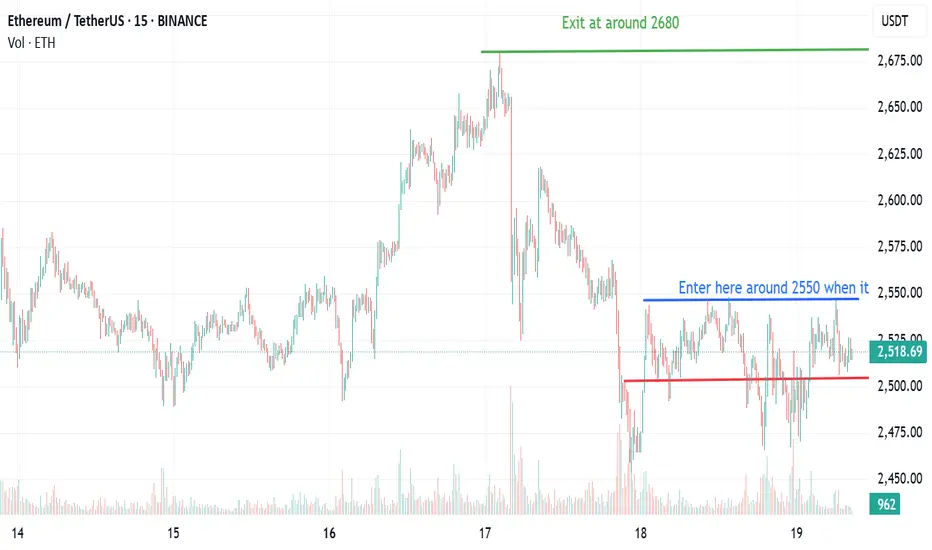
Ethereum Long Setup- BlackRock added ~$500M of ETH, while whales accumulated $221M post-dip
- On close analysis we can see that ETH chart is mimicking 2017 pattern
- The 2440 support has been tested multiple times now so we wait for the upper boundary of 2550 to be breached with volume spike and then we can enter for
ETH ~Expansion done.Based on 3marketphase.
(contraction-expansion-trend, I learned this concept from dayya trading post)
ETH is at the box range.
(triangle-2024 August to October)
Plus, there is throwing-over with double-top (1week candle scale).
This means ethereum is at the end of contraction phase and it has h

ETH - Medium-Term Bulls Confirmed Control!Hello TradingView Family / Fellow Traders. This is Richard, also known as theSignalyst.
📈 As per our previous ETH analysis (shown on the chart), ETH rejected the green support zone and pushed higher, reaching our target near $2,750.
What’s next?
After breaking above the $2,750 structure marked

ETH - Do you Notice a Pattern here? I DO...Hello TradingView Family / Fellow Traders. This is Richard, also known as theSignalyst.
📈I find ETH 4h chart as it looks like history repeating itself.
Previously in 1 to 5 June, it formed a slight lower low before starting the next big bullish impulse leading towards the upper bound of the channe
See all ideas
Summarizing what the indicators are suggesting.
Oscillators
Neutral
SellBuy
Strong sellStrong buy
Strong sellSellNeutralBuyStrong buy
Oscillators
Neutral
SellBuy
Strong sellStrong buy
Strong sellSellNeutralBuyStrong buy
Summary
Neutral
SellBuy
Strong sellStrong buy
Strong sellSellNeutralBuyStrong buy
Summary
Neutral
SellBuy
Strong sellStrong buy
Strong sellSellNeutralBuyStrong buy
Summary
Neutral
SellBuy
Strong sellStrong buy
Strong sellSellNeutralBuyStrong buy
Moving Averages
Neutral
SellBuy
Strong sellStrong buy
Strong sellSellNeutralBuyStrong buy
Moving Averages
Neutral
SellBuy
Strong sellStrong buy
Strong sellSellNeutralBuyStrong buy
Displays a symbol's price movements over previous years to identify recurring trends.
Frequently Asked Questions
The current price of Ethereum / UST (ETH) is 2,440.40000000 USDT — it has fallen −4.82% in the past 24 hours. Try placing this info into the context by checking out what coins are also gaining and losing at the moment and seeing ETH price chart.
Ethereum / UST price has fallen by −9.22% over the last week, its month performance shows a −4.93% decrease, and as for the last year, Ethereum / UST has decreased by −30.55%. See more dynamics on ETH price chart.
Keep track of coins' changes with our Crypto Coins Heatmap.
Keep track of coins' changes with our Crypto Coins Heatmap.
Ethereum / UST (ETH) reached its highest price on Nov 10, 2021 — it amounted to 4,868.30000000 USDT. Find more insights on the ETH price chart.
See the list of crypto gainers and choose what best fits your strategy.
See the list of crypto gainers and choose what best fits your strategy.
Ethereum / UST (ETH) reached the lowest price of 88.58900000 USDT on Mar 13, 2020. View more Ethereum / UST dynamics on the price chart.
See the list of crypto losers to find unexpected opportunities.
See the list of crypto losers to find unexpected opportunities.
The safest choice when buying ETH is to go to a well-known crypto exchange. Some of the popular names are Binance, Coinbase, Kraken. But you'll have to find a reliable broker and create an account first. You can trade ETH right from TradingView charts — just choose a broker and connect to your account.
Crypto markets are famous for their volatility, so one should study all the available stats before adding crypto assets to their portfolio. Very often it's technical analysis that comes in handy. We prepared technical ratings for Ethereum / UST (ETH): today its technical analysis shows the sell signal, and according to the 1 week rating ETH shows the sell signal. And you'd better dig deeper and study 1 month rating too — it's sell. Find inspiration in Ethereum / UST trading ideas and keep track of what's moving crypto markets with our crypto news feed.
Ethereum / UST (ETH) is just as reliable as any other crypto asset — this corner of the world market is highly volatile. Today, for instance, Ethereum / UST is estimated as 2.12% volatile. The only thing it means is that you must prepare and examine all available information before making a decision. And if you're not sure about Ethereum / UST, you can find more inspiration in our curated watchlists.
You can discuss Ethereum / UST (ETH) with other users in our public chats, Minds or in the comments to Ideas.