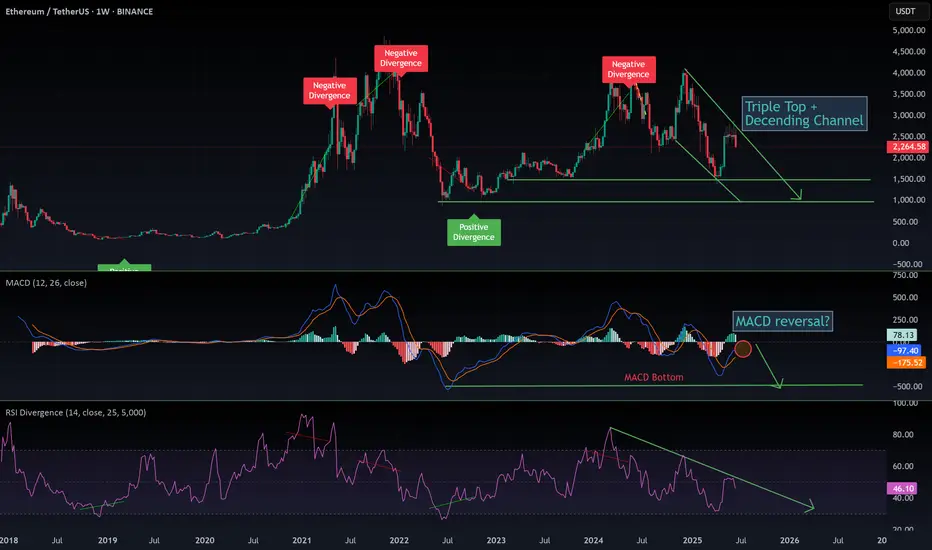
$ETH: The 1-week chart is an absolute disaster!Once again, I want to make it clear: I’m naturally a bull. But I live in Thailand, far from the noise of influencers shouting "buy, buy, buy!" I’ve learned my lesson—when they scream buy, you get rekt. That’s why I rely solely on the charts.
Charts are just mathematics—they don’t lie. So here’s my
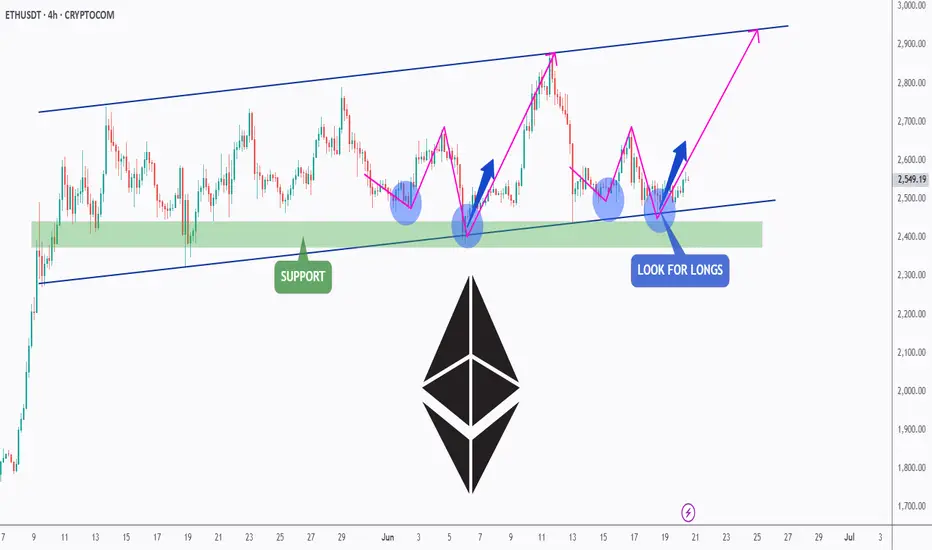
ETH - Do you Notice a Pattern here? I DO...Hello TradingView Family / Fellow Traders. This is Richard, also known as theSignalyst.
📈I find ETH 4h chart as it looks like history repeating itself.
Previously in 1 to 5 June, it formed a slight lower low before starting the next big bullish impulse leading towards the upper bound of the channe
#ETHUSDT: Currently On The Way Towards Filling The FVG?ETCUSDT is currently experiencing a significant correction as the price approaches a pivotal juncture where a substantial bullish price reversal is anticipated, potentially propelling it to new all-time highs or even surpassing them. It is imperative to exercise meticulous risk management and conduc

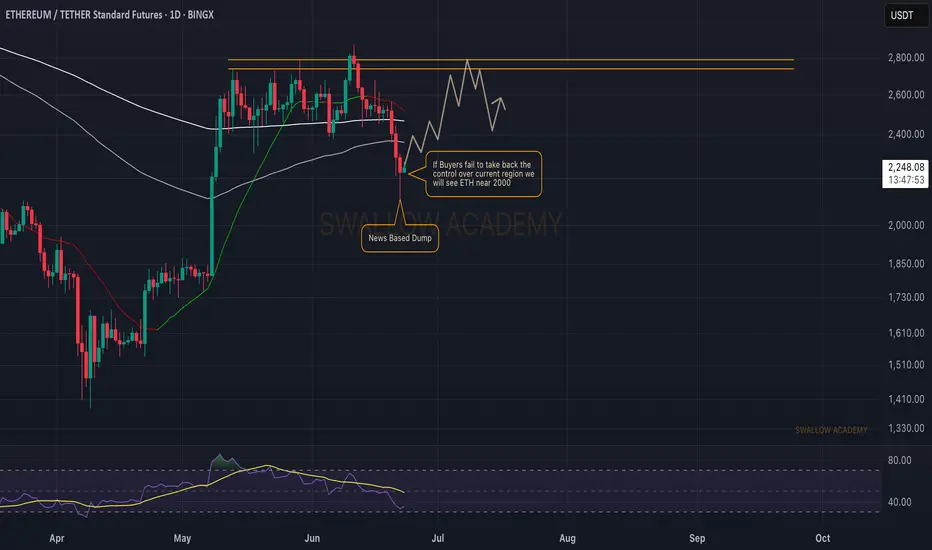
Ethereum (ETH): Buyers Taking Back Control!Ethereum had a nasty fall both on Sunday and Saturday where price dipped from $2500 to $2100.
Despite that movement took place during the weekends it was harsh one and we are expecting osme kidn of re-test to happen towards the local broken area (near 200EMA).
Swallow Academy
ETH | BULLISH Pattern | $3K NEXT ??Ethereum has established a clear bullish pattern in the daily as we're seeing an inverse H&S:
The war issues across the globe must also be considered. So far, it's been bullish for crypto but this can also change overnight since it's a very volatile situation - and crypto being a very volatile ass

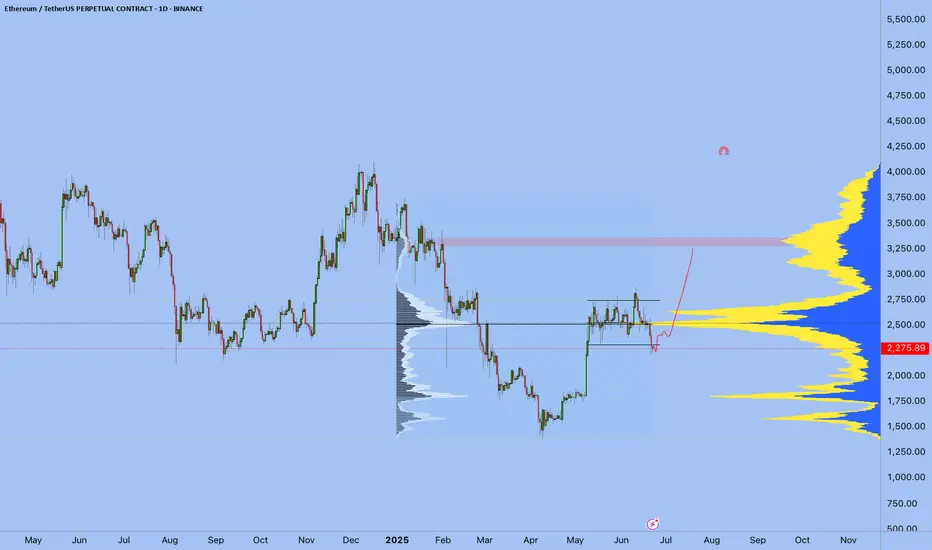
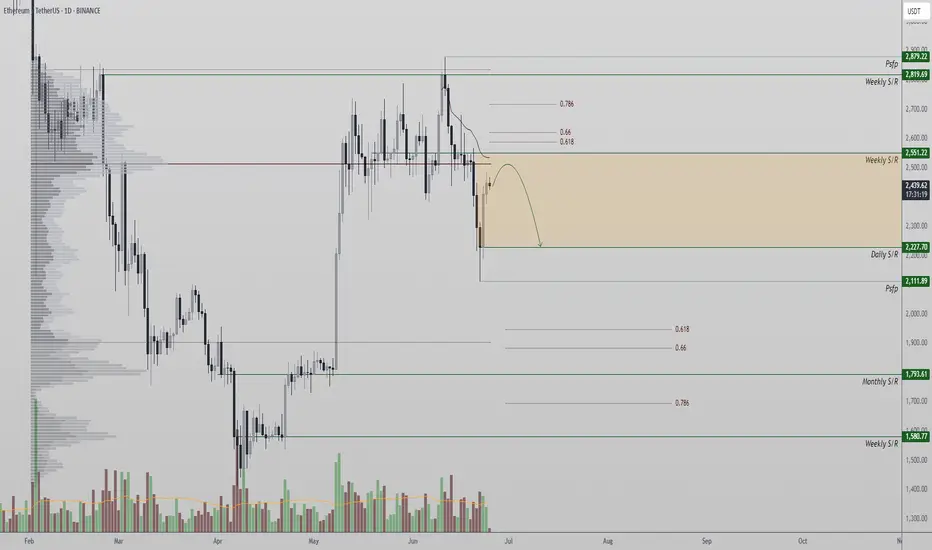
Ethereum at Key Resistance After Short Squeeze BounceEthereum recently found a local bottom at $2,111, triggering a sharp bounce that resembles a short squeeze. However, the rally has met a significant resistance zone—a former support level now flipped into resistance. This zone is technically loaded with multiple confluences: the point of control, th
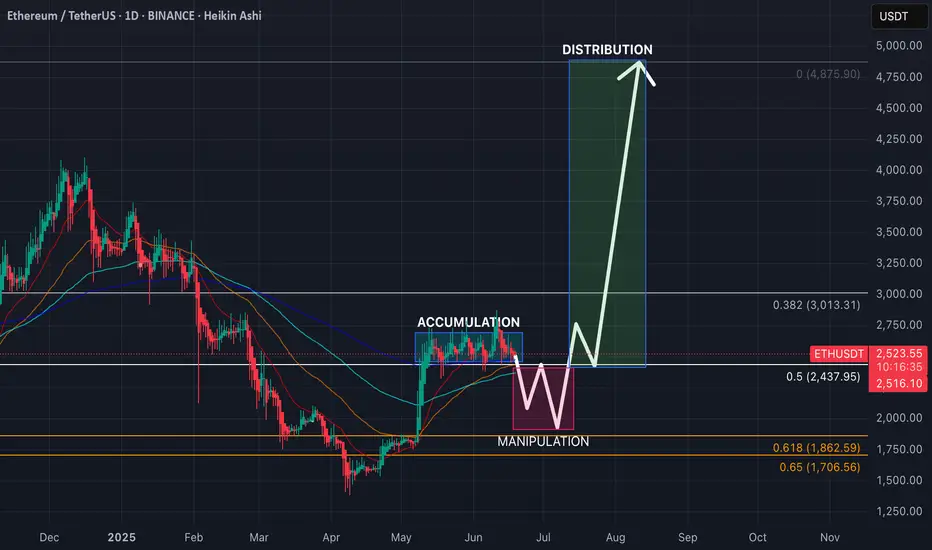
ETH: 6th consolidation week, AMD!?Ethereum is super slow these days, ranging tightly between $2430 and $2800 for weeks after a recovery. Current price action shows signs of preparation for the next BIG move, but in what side!?!!
Let’s break this down using the AMD model:
🔸 Accumulation
We saw ETH bottoming out in April after a dee
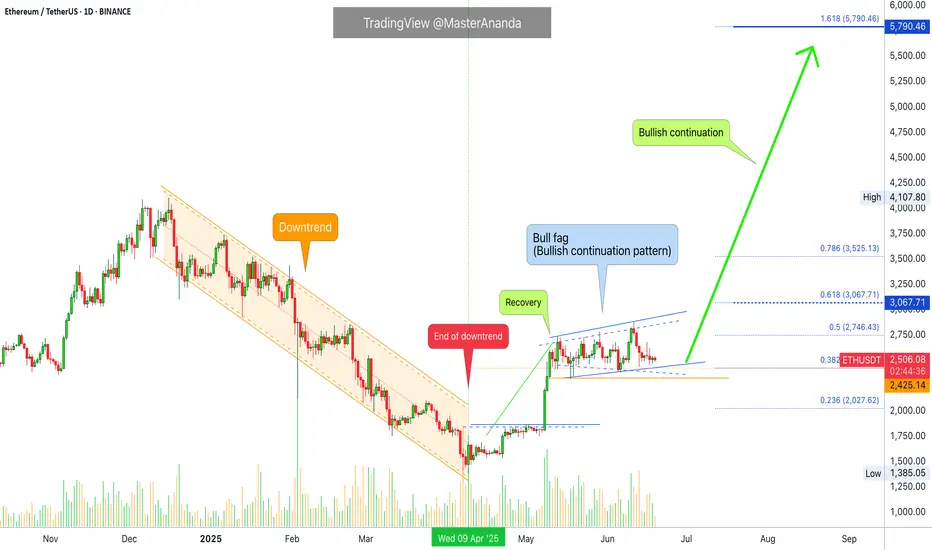
Ethereum, Bullish Breakout Expected Any Moment Now!Look at this, the first peak for Ethereum happened 13-May after the start of the recovery and the end of the downtrend. The lowest point happened five days later on 18-May and there has been no new lows since. Ethereum has been in a bullish consolidation pattern, a classic bullish flag.
This kind o
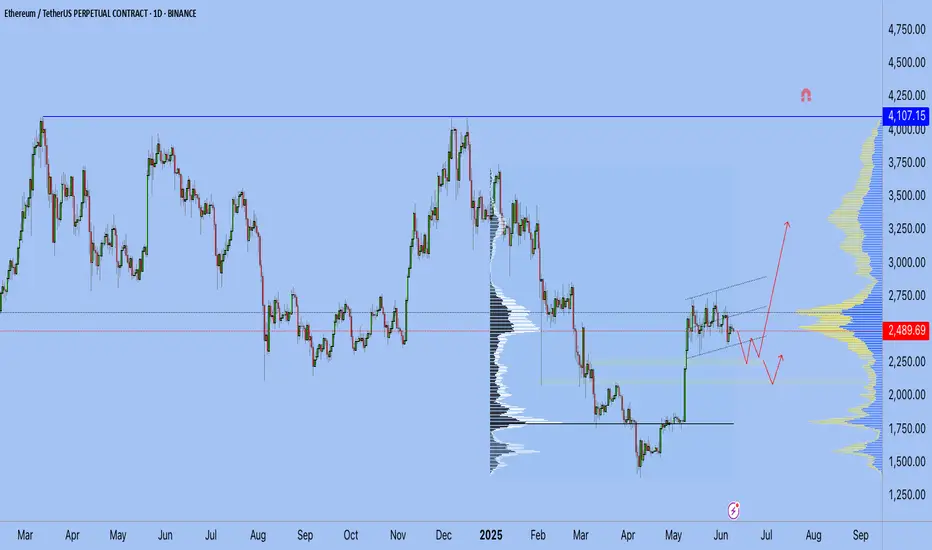
ETH update 9.06.2025Hello everyone, many of you asked me to publish my vision for ETH.
Here you go!
I believe that the previous impulse movement was only the first upward movement, and now we are in a sideways correction movement — call it what you will, but the fact is that the exit from this flat will be upward.
1.
See all ideas
Summarizing what the indicators are suggesting.
Oscillators
Neutral
SellBuy
Strong sellStrong buy
Strong sellSellNeutralBuyStrong buy
Oscillators
Neutral
SellBuy
Strong sellStrong buy
Strong sellSellNeutralBuyStrong buy
Summary
Neutral
SellBuy
Strong sellStrong buy
Strong sellSellNeutralBuyStrong buy
Summary
Neutral
SellBuy
Strong sellStrong buy
Strong sellSellNeutralBuyStrong buy
Summary
Neutral
SellBuy
Strong sellStrong buy
Strong sellSellNeutralBuyStrong buy
Moving Averages
Neutral
SellBuy
Strong sellStrong buy
Strong sellSellNeutralBuyStrong buy
Moving Averages
Neutral
SellBuy
Strong sellStrong buy
Strong sellSellNeutralBuyStrong buy
Displays a symbol's price movements over previous years to identify recurring trends.