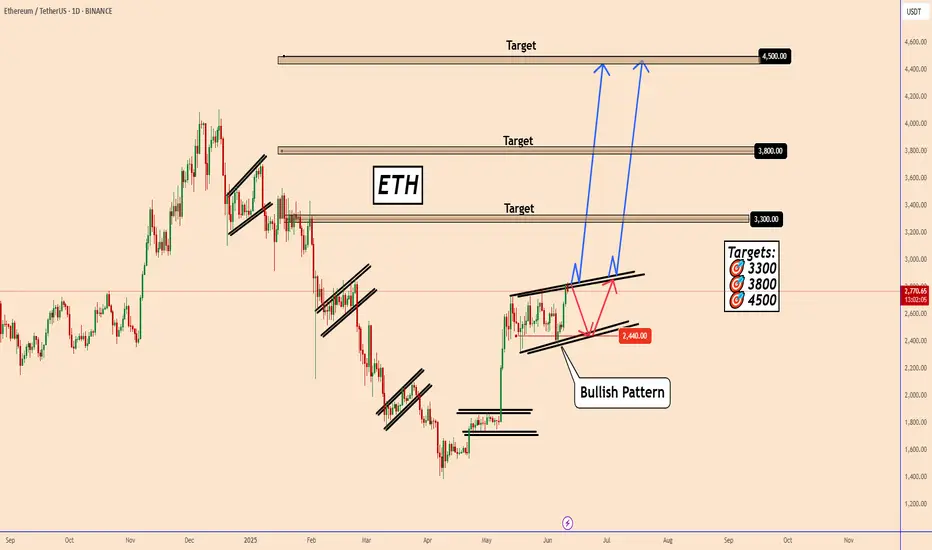
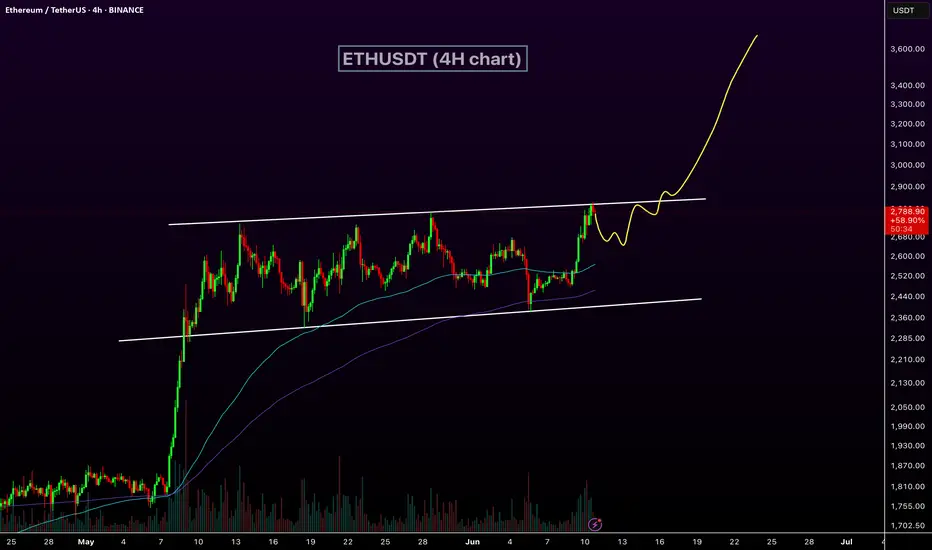
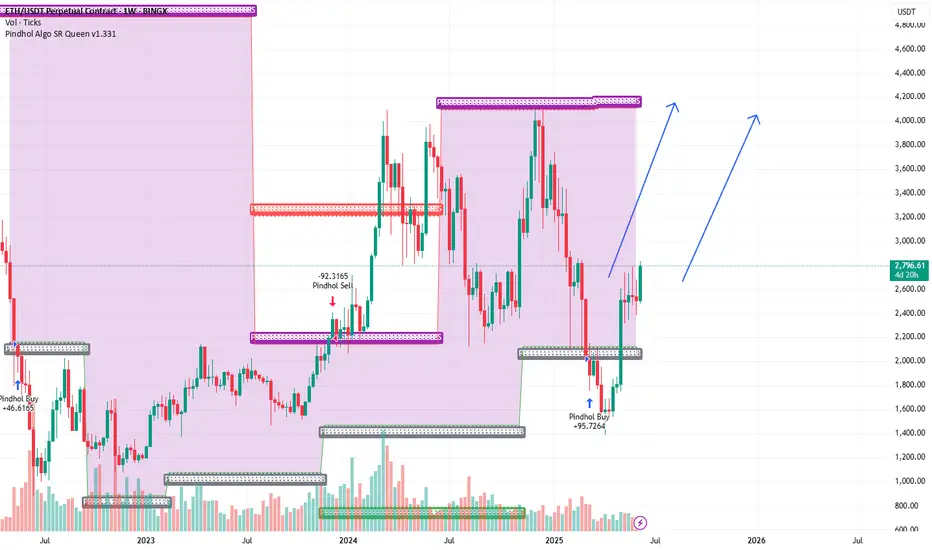
ETH: Bullish Momentum Emerging on the Daily ChartETH: Bullish Momentum Emerging on the Daily Chart
Since May 9, ETH has been consolidating for about a month, forming a bullish pattern. The price continues to fluctuate within the 2330 - 2800 range.
While the pattern appears bullish, it remains unclear whether it has fully completed. Without a decisive breakout accompanied by strong bullish volume, ETH could retreat to 2440, potentially forming a larger structure before resuming its upward move.
The broader outlook still suggests bullish momentum, but the market is not yet ready to initiate the next leg up.
Today's U.S.-China agreement and U.S. CPI data will be key events to watch.
Key Target Zones: 🎯 3300 🎯 3800 🎯
You may find more details in the chart!
Thank you and Good Luck!
❤️PS: Please support with a like or comment if you find this analysis useful for your trading day❤️
ETHUST.P trade ideas
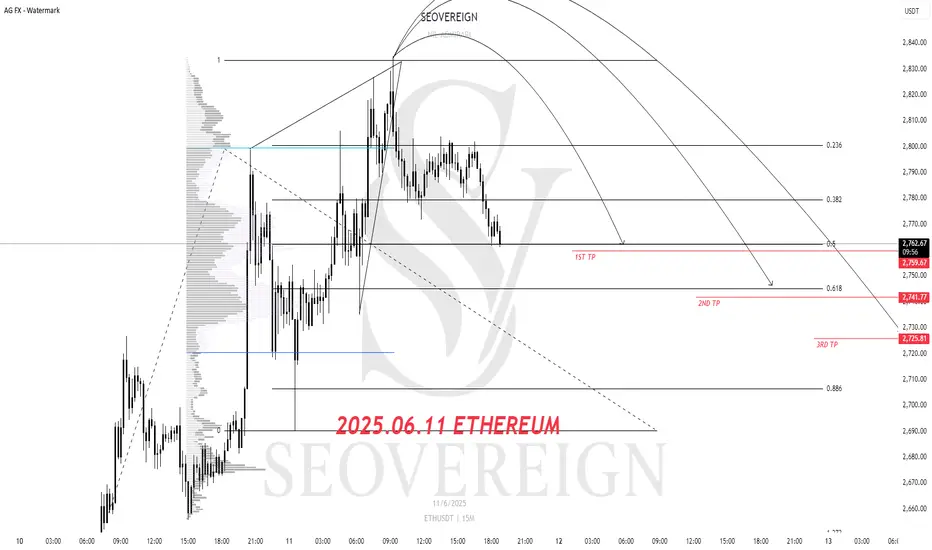
ETHEREUM Short Position Update – June 11, 2025We are the SeoVereign Trading Team.
With sharp insight and precise analysis, we regularly share trading ideas on Bitcoin and other major assets—always guided by structure, sentiment, and momentum.
🔔 Follow us to never miss a market update.
🚀 Boosts provide strong motivation and drive to the SeoVereign team.
--------------------------------------------------------------------------------------------------------
Ethereum downside perspective shared.
Recently, Ethereum has been continuously setting new highs, showing strong upward momentum. However, from a technical analysis standpoint, a breakdown below the lower trendline and an exit from a converging wedge pattern have been observed.
This suggests the potential for a short-term cooling-off phase, prompting the sharing of a bearish idea.
The first target is set at 2,771.
While Ethereum and the broader market continue to reach new highs, I personally believe a corrective phase may be approaching.
Detailed ratio analysis and further reasoning will be shared through an idea update once the first target is reached.
Flexible response according to market conditions is essential.
ETHEREUM Potential Bullish BreakoutEthereum price seems to exhibit signs of overall potential Bullish momentum if the price action forms a prominent Higher High with multiple confluences through key Fibonacci and Support levels which presents us with a potential long opportunity.
Trade Plan:
Entry : 2950
Stop Loss : 2200
TP 1 : 3700

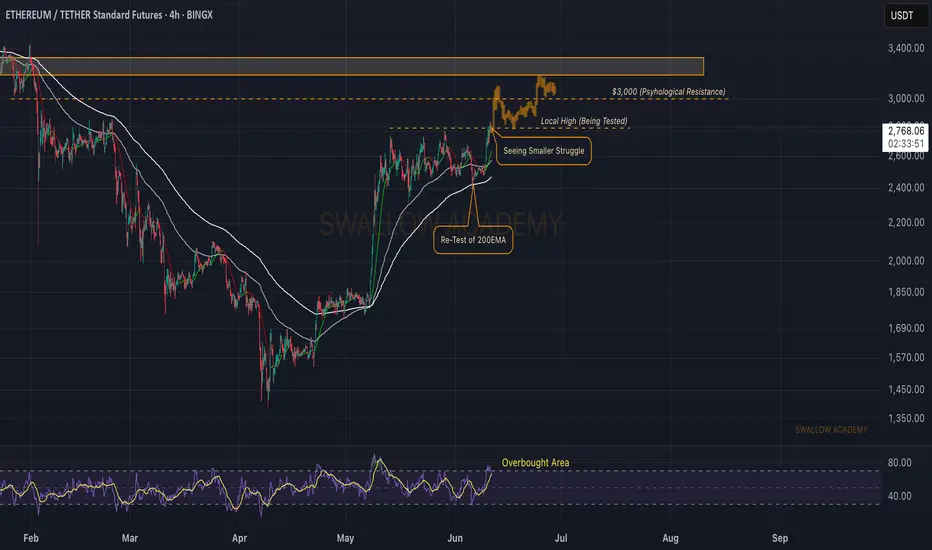
Ethereum (ETH): Targeting $3,000-$3,300Ethereum is still pushy near the local high area, where we are looking for a breakout to happen. Meanwhile, nothing much has changed since yesterday, but what we see is that pressure is pretty big (from bulls), so $3,000-$3,300 can be reached easily if we keep the same momentum on!
Swallow Academy
eth 4h
eth is in the distribution zone and the price is expected to move in the direction it broke out of the box. I have shown the levels it can go to in the graph in which direction it breaks the box. Lots of profits.
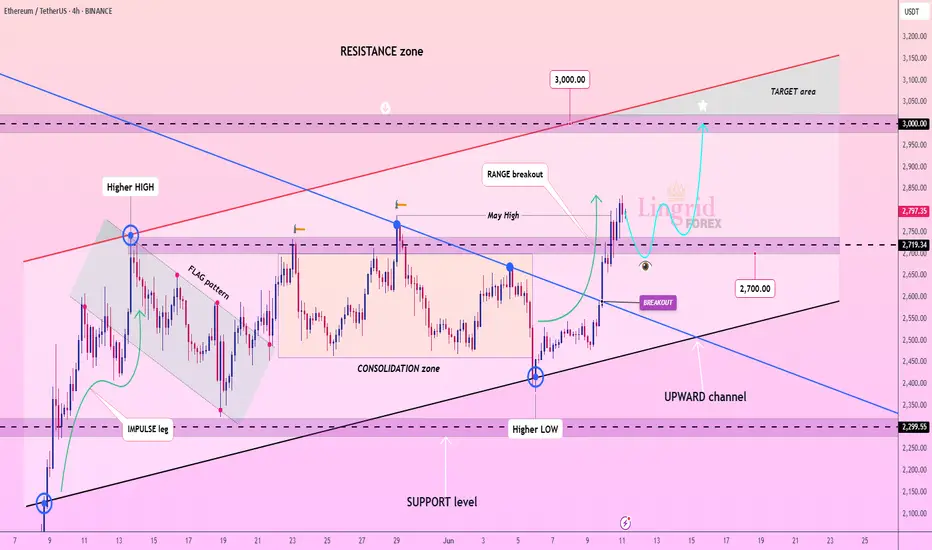
Lingrid | ETHUSDT May High Test - Continuation SetupThe price perfectly fulfilled my last idea . BINANCE:ETHUSDT has broken out of a long-standing consolidation zone and is now retesting the breakout area near 2719, which aligns with the May high and the downward trendline. Price is maintaining its position above the upward channel, showing a bullish structure with potential for continuation. A successful retest here may launch the next leg toward the 3000 resistance.
📈 Key Levels
Buy zone: 2680–2720
Buy trigger: bounce from 2719 with bullish engulfing
Target: 3000
Sell trigger: drop back below 2680
💡 Risks
Failure to hold the breakout could trap longs
Low volume during retest increases breakdown chances
3000 psychological resistance may cause premature rejection
Traders, if you liked this idea or if you have your own opinion about it, write in the comments. I will be glad 👩💻
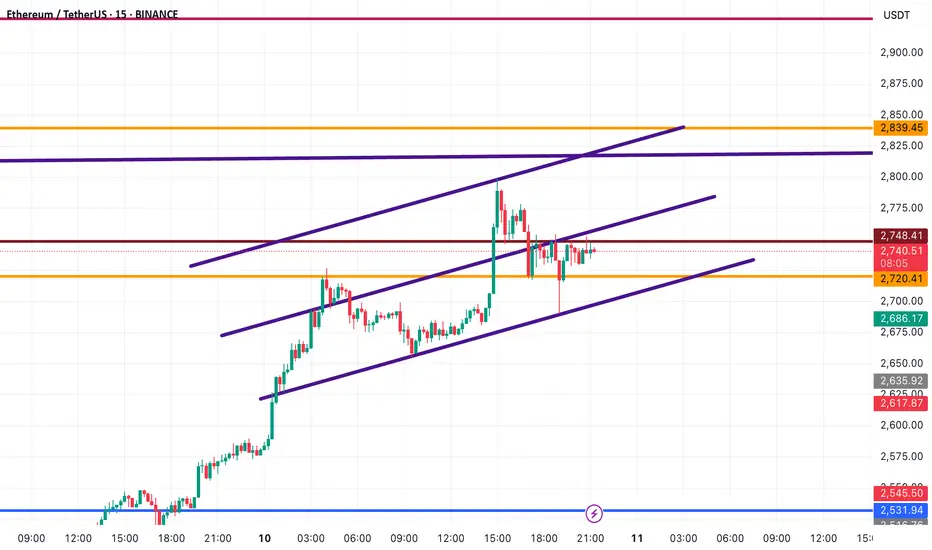
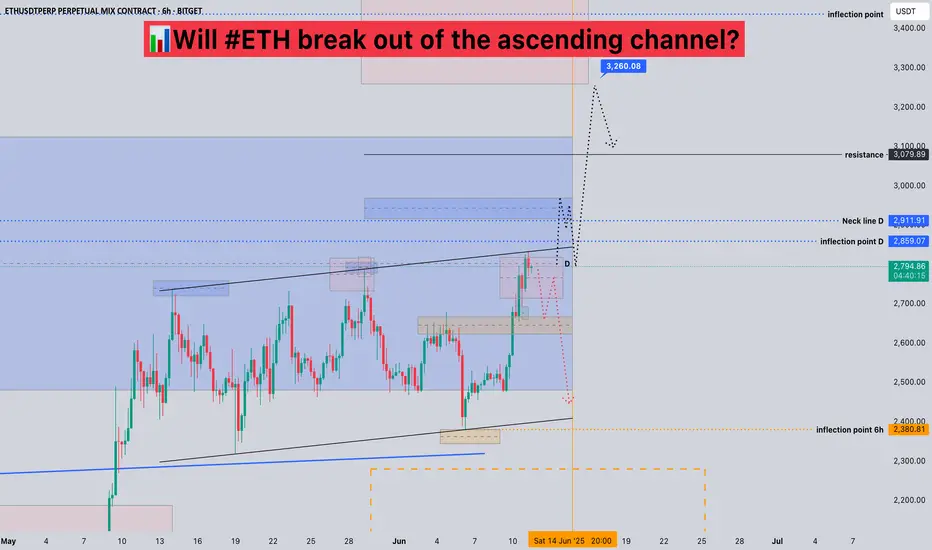
Will #ETH break out of the ascending channel?📊Will #ETH break out of the ascending channel?
🧠From a structural perspective, we are currently in the resistance zone at the daily level, so we have digested the selling pressure here by sideways consolidation. Because the selling pressure here is large, we still need to remain cautious.
➡️From a graphical perspective, we are currently blocked at the upper edge of the ascending channel, so we need to be vigilant about the risk of a pullback at any time. If we continue to break upward, then we need to pay attention to trading opportunities after the support and resistance conversion.
⚠️Even if it breaks upward, the nearby 2911 is also resistance. If it breaks upward again, then the resistance worth our attention is around 3300.
Let's see 👀
🤜If you like my analysis, please like 💖 and share 💬 BITGET:ETHUSDT.P
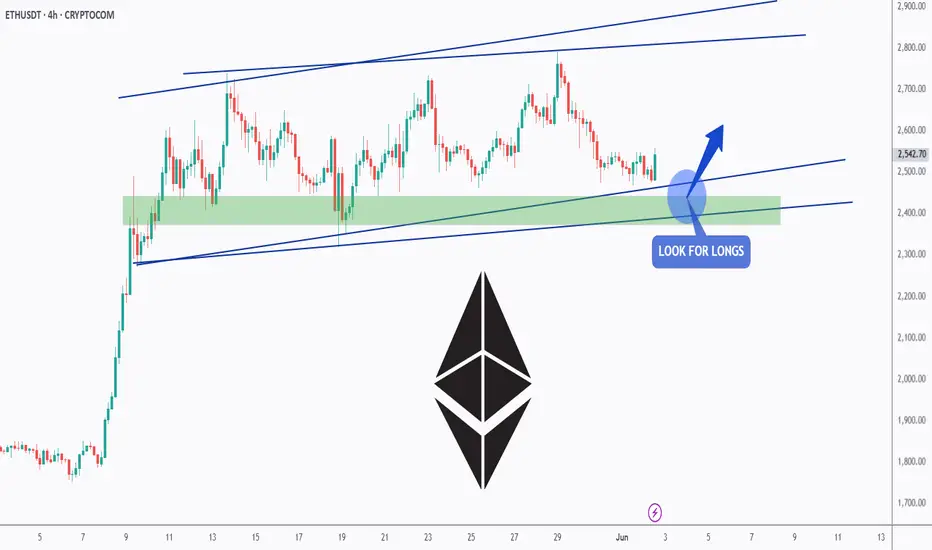
Ethereum Set for a Massive Pump!ETHUSDT Technical analysis update
ETH price has been trading within a channel pattern for the past 30 days, with the 100 and 200 EMA acting as strong support on the 4H chart. Therefore, the likelihood of the price dropping below the 100 and 200 EMA on the 4H chart is very low. Once the price breaks above the channel resistance, we can expect a strong bullish move in CRYPTOCAP:ETH
BITSTAMP:ETHUSD

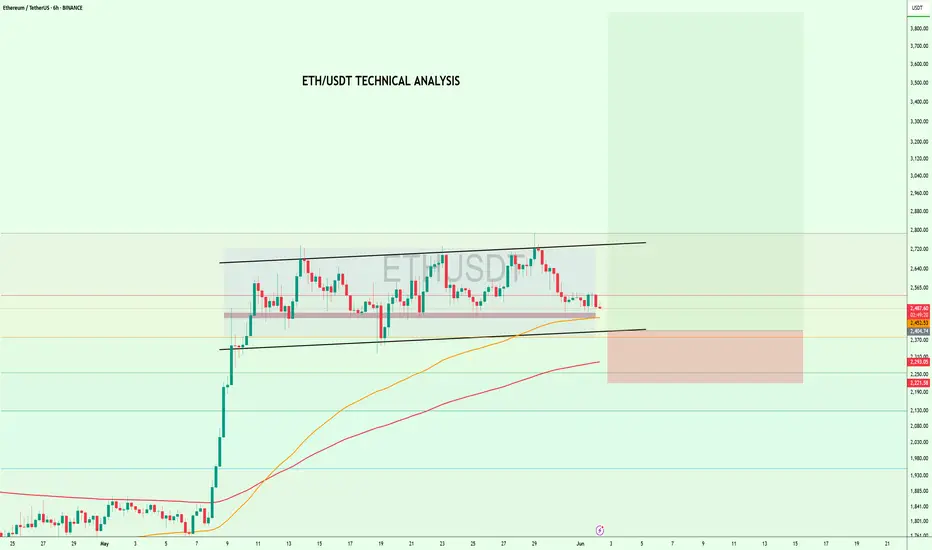
Ethereum Testing Channel Support – Big Move Loading#Ethereum Update
CRYPTOCAP:ETH is still moving inside a rising channel and currently testing the support zone around $2,480–$2,500, aligned with the 50 EMA.
If this level holds, Ethereum may bounce back toward the upper channel, with the potential to retest $2,720+.
Accumulation in these levels 2540, 2403, 2388 with stop loss of $2,220
This zone is critical.
Price action here will decide the next big move. 👀
ETH - Finally Support!Hello TradingView Family / Fellow Traders. This is Richard, also known as theSignalyst.
📈ETH has been overall bullish trading within the flat rising channels marked in blue.
Moreover, the green zone is a strong support zone!
🏹 Thus, the highlighted blue circle is a strong area to look for buy setups as it is the intersection of support and lower blue trendlines acting as non-horizontal support.
📚 As per my trading style:
As #ETH approaches the blue circle zone, I will be looking for bullish reversal setups (like a double bottom pattern, trendline break , and so on...)
📚 Always follow your trading plan regarding entry, risk management, and trade management.
Good luck!
All Strategies Are Good; If Managed Properly!
~Rich
ETH/USDT 4HOUR CHART UPDATE !!ETH/USDT – 4H Chart Update
Ethereum is trading near an ascending channel's upper boundary, around the $2,790–$2,800 area. This level has historically acted as strong resistance, and we are seeing early signs of price hesitation.
ETH is testing the top of the channel. Rejection from this area could lead to a reversal towards the lower channel trendline near $2,450–2,500.
First Support: $2,600–2,620 (25MA and 100MA area).
Deep Support: $2,450 (Channel Bottom).
Strong Demand Area Below: $2,050–$2,150 (highlighted yellow box).
Moving Averages:
The 25MA (black) and 100MA (purple) are currently bullishly aligned.
Thanks for your support!
DYOR. NFA

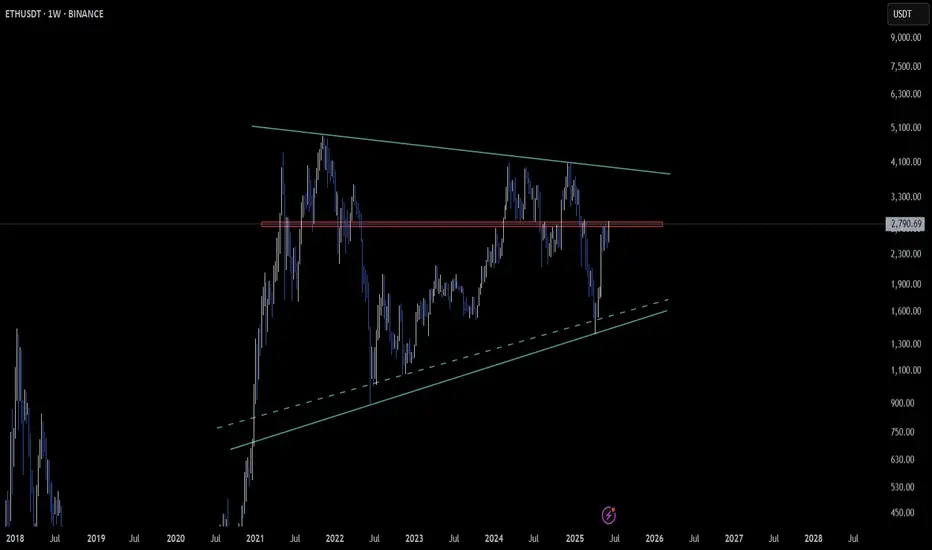
ETH Building a Bullish Base – Weekly Pennant in Play
CRYPTOCAP:ETH is sculpting a bullish pennant on the weekly timeframe 📈, gathering strength for what could be a fresh surge.
Price is consolidating just below the $2800–$2820 zone — a critical area to watch for a breakout and confirmation of a bullish shift.
A decisive move above this zone could open the door for a new wave of upside momentum 🔥.
For now, patience is key: let this weekly structure reveal its true intentions! 🌟
ETHUSDT – 5-Month Bullish Boom Incoming🚀 ETHUSDT – 5-Month Bullish Boom Incoming! | Ethereum Price Prediction
📈 Chart: ETHUSDT | Timeframe: 1D | Outlook: Bullish
🔍 Overview
Ethereum (ETHUSDT) is setting up for a major breakout and could rally significantly in the next 5 months (June to October 2025). With strong technical support, improving on-chain metrics, and bullish macro sentiment, Ethereum might be preparing for a massive upward move.
📊 Technical Analysis
✅ EMA Support:
ETH is currently holding strong above the 200-day EMA, confirming a bullish long-term trend.
✅ Ascending Triangle Formation:
We’re seeing a clean ascending triangle forming on the daily chart, with resistance around $3500. A breakout could target $4000–$5,200 levels.
✅ Volume Spike + RSI Confirmation:
Recent buy-side volume spikes combined with an RSI above 60 suggest renewed momentum. We may see continuation once ETH breaks above resistance.
🧠 Fundamental Factors
💡 Ethereum 2.0 and Scaling Improvements:
Continued upgrades to the Ethereum network (like Danksharding) could boost confidence and drive new adoption.
💡 Institutional Interest:
BlackRock, Fidelity, and other major players are increasing their exposure to Ethereum-based ETFs and DeFi projects.
💡 Altcoin Season Rotation:
As BTC dominance slows, capital may rotate into ETH, pushing price upward aggressively in the coming months.
🎯 Price Targets
Target Price Level Timeline
TP1 $3,500 July 2025
TP2 $4,200 August–September 2025
TP3 $5,100 December 2025
🛑 Invalidation Level
A daily close below $3,100 would invalidate this bullish thesis and suggest reevaluation.
🗣️ Conclusion
Ethereum is coiling up and looks ready for a powerful move to the upside. If it breaks the $4K level with strong volume, expect ETH to fly. Keep an eye on macro factors and network upgrades.
💬 Let me know your thoughts! Do you think ETH can hit $6K by October? Drop a comment and don’t forget to like if you agree!
#ETH #ETHUSDT #Ethereum #CryptoAnalysis #Altcoins #Bullish #Crypto2025 #EthereumPricePrediction #TradingViewIdeas
ETHUSDT UPDATELooking at the ETH daily chart, we see a flag formation. If it breaks, it could take us to 3500.

ETHUSD I Weekly CLS I Model 1 I Target CLS LowHey, Market Warriors, here is another outlook on this ETH , Im already in at 2647.73, lets go !!
If you’ve been following me, you already know every setup you see is built around a CLS Footprint, a Key Level, Liquidity and a specific execution model.
If you haven't followed me yet, start now.
My trading system is completely mechanical — designed to remove emotions, opinions, and impulsive decisions. No messy diagonal lines. No random drawings. Just clarity, structure, and execution.
🧩 What is CLS?
CLS is real smart money — the combined power of major investment banks and central banks moving over 6.5 trillion dollars a day. Understanding their operations is key to markets.
✅ Understanding the behavior of CLS allows you to position yourself with the giants during the market manipulations — leading to buying lows and selling highs - cleaner entries, clearer exits, and consistent profits.
📍 Model 1
is right after the manipulation of the CLS candle when CIOD occurs, and we are targeting 50% of the CLS range. H4 CLS ranges supported by HTF go straight to the opposing range.
"Adapt what is useful, reject what is useless, and add what is specifically your own."
— David Perk aka Dave FX Hunter ⚔️
👍 Hit like if you find this analysis helpful, and don't hesitate to comment with your opinions, charts or any questions.

ETH BULLISH SETUPEthereum has recently broken out bullishly on higher timeframes, signaling a potential move toward the key resistance zone around $3,460. This level holds significant technical importance. The breakout above the hourly flag pattern confirms bullish momentum. As long as price holds above $2,300, the setup remains valid. A drop below this level would invalidate the current bullish outlook.
ETH Daily Close Signals Entry
On the daily, ETH is closing above both the 200MA and the previous tops. PSAR on the original system has flipped, though the free-to-use version hasn’t yet.
This is a trading idea. If you choose to allocate real capital, be prepared for the possibility of loss. But if you trust the system enough to allocate capital, trust that the PSAR has flipped and today’s close marks the entry.
It’s exactly how the system defines a valid setup:
Daily close above the 200MA, with MLR > SMA > BB center.
The 12H timeframe acts as confirmation from the lower TF, and the 4H is already green and ripping.
So buckle up—this could be a ride worth taking.
Always take profits and manage risk.
Interaction is welcome.
ETH – System Trigger Hit
ETH on the 12H has just reclaimed the green line: resistance from the previous tops.
This level sits roughly midway between the 0.5 and 0.382 Fib levels, with \$3000 now looking closer than \$2500.
PSAR has just flipped above the last tops, and price is now above MLR > SMA > BB center > 200MA.
All system conditions are met for a long entry on this timeframe.
This also comes as confirmation of the daily signal entry at today closing
Always take profits and manage risk.
Interaction is welcome.

$ETH - Top DownBYBIT:ETHUSDT.P Top Down (10/06/25)
V-Levels Bias
Weekly = Bullish
Daily - Bullish
10-Hour = Bullish
1-Hour = Bullish
V-Levels Momentum
Weekly = Bearish FA
Daily = Neutral
10-Hour = Neutral
1-Hour = IB Range (Neutral)
DeCode Market Breakdown
Macro Context
Weekly Chart
Strong bullish MS, printing clean HHs and HLs.
Price has rejected from the same V-Level multiple times.
Rejections are paired with high relative volume and aggressive selling footprints → indicates strong passive interest above.
This area is not ideal for aggressive long entries.
Daily Chart
Still in bullish structure, holding above key POCs and range lows.
The Failed Auction at IB lows has added fuel for upside momentum.
However, we’re trading right into a potential liquidity pocket just below resistance.
Context calls for a wait-and-see approach: either clear breakout or rejection confirmation.
Intraday Picture (10H & 1H)
10H Chart
Still within an Inside Bar (IB) range.
FA at range lows suggests momentum continues upward — but we are at the top of the range.
Key risk: trap above range highs → ideal area for shorts if we get absorption and selling imbalance.
1H Chart
Market is rotating inside the current IB range.
No breakout confirmed yet.
Best short setup: Rejection from IB Highs + Absorption on CVD / Footprint charts.
Breakdown scenario: Short on range low breakdown with volume confirmation.
Longs: Only valid if HTFs confirm breakout → then look for bullish retest or mid-retest entries.
⸻
Summary & Trade Plan
Big Picture: Still bullish, but this isn’t the area to long blindly.
Short Setup 1: Rejection from IB Highs with clear absorption + imbalance.
Short Setup 2: Breakdown below IB Range Lows with volume follow-through.
Long Setup: Wait for HTF confirmation of breakout. If confirmed → retest of prior resistance as support.
Final Notes
This is where traders get chopped. HTF resistance meets LTF momentum.
Let price prove itself. Let volume confirm the move.
No breakout = no long. No trap = no short.
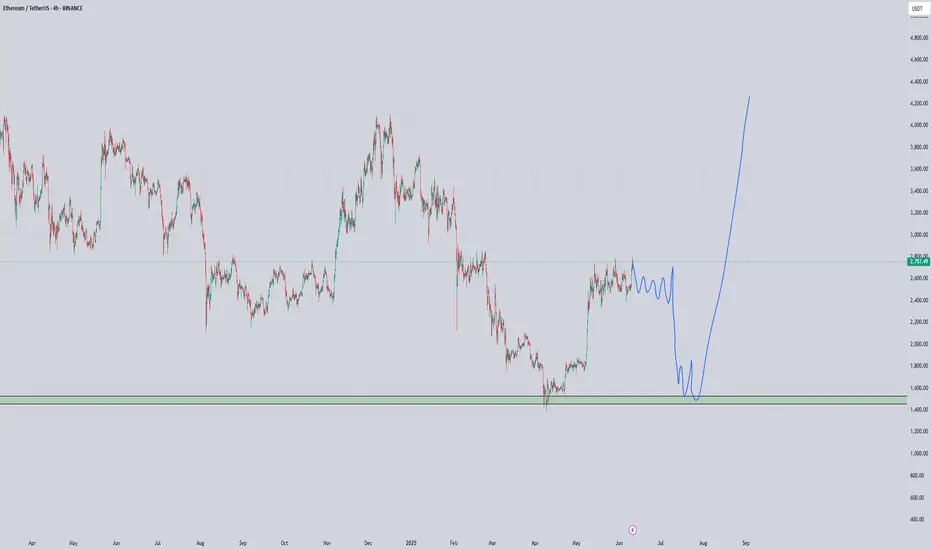
ETH - mega dump and mega ultra pumpI found a fractal for Bitcoin, and Ethereum is currently similar to it. If we want to see a truly strong upward movement, then there is a high probability of such a helicopter, as similar situations have already occurred before the strongest growth.
ETH Midline Break Could Be Key!🚨 ETH Midline Break Could Be Key!
Keep a close eye on this channel and its midline — they’ve been highly respected by price action.
If Ethereum breaks above the midline, we could see momentum push price toward the upper boundary of the channel.
This setup could offer great risk-reward opportunities for smart entries.
Don’t trade blind — watch the levels that matter!