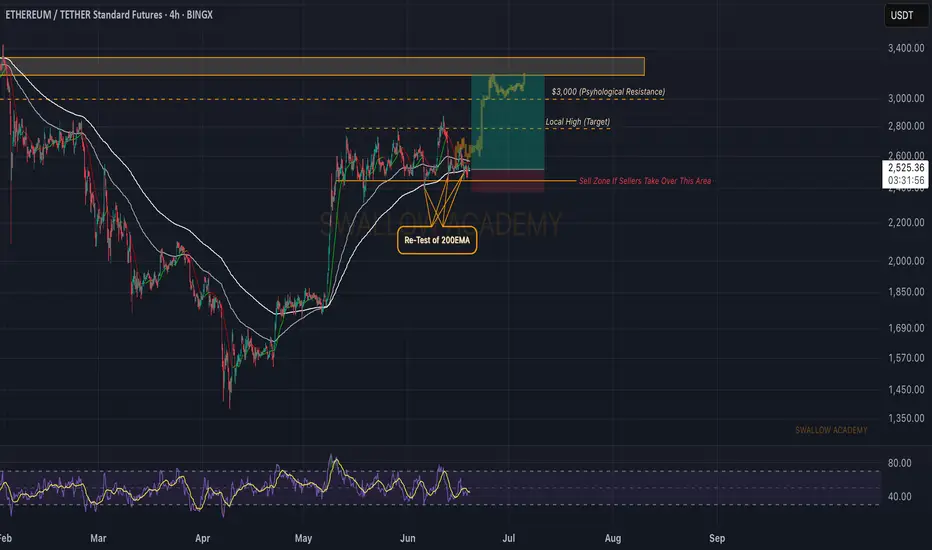
Ethereum (ETH): Buyers Dominating | Going For $3000Ethereum is pushing, and we are back near EMAs and possibly going for another breakout attempt from here.
We are looking for a proper breakout, which would then trigger for us an opportunity for a long position towards the $3000.
Swallow Academy
ETHUST.P trade ideas
Ethereum (ETH): Lost Control Over 200EMA Ethereum has lost control over the 200EMA, where we had a strong sell-side movement due to the US news.
As this was the movement during the weekends, now we are looking for recovery to happen at least a couple of days from now on, which would mean that buyers will take back the control over the 200EMA.
This line will decide the next major trend area for the coin!
Swallow Academy
ETH Bearish Retest – Heading to $900?Description:
On the weekly chart, ETH has once again failed to break back above the long-term ascending trendline that started in 2020. After losing this trendline support earlier, price is now treating it as resistance — a textbook bearish retest.
The market reaction suggests weakness, and the lack of strong volume on the upside raises concerns about buying momentum. If this structure holds, we might be looking at a broader correction in play.
📉 Key Observations:
• Bearish rejection from the multi-year trendline.
• Structure resembles a lower high formation.
• Weak volume on bounces, showing hesitation from bulls.
🔍 I’m personally watching the $1,000 zone as a potential magnet if downside pressure builds. Some may even expect a retest of the $900 range — not a prediction, just a scenario.
💬 What do you think? Are we headed for a deeper flush or is this just a trap before a breakout? Drop your thoughts ⬇️
#Ethereum #ETH #CryptoWeekly #TechnicalAnalysis #Trendline #BearishSetup

DeGRAM | ETHUSD rebound from the support line📊 Technical Analysis
● Bounce off the purple up-trend and 2 320 support printed a bullish engulfing, maintaining the sequence of higher-lows that has guided price since April.
● Price is squeezing into an ascending triangle under 2 700-2 730, where the former wedge cap meets horizontal supply; a break projects to the 3 040 macro fib / channel roof.
💡 Fundamental Analysis
● Net-staking deposits keep rising while, per FXStreet (25 Jun), whales add ETH ahead of the SEC’s spot-ETF S-1 verdict, underpinning demand.
✨ Summary
Long >2 320; triangle breakout above 2 730 targets 3 040. Thesis void on a 16 h close below 2 200.
-------------------
Share your opinion in the comments and support the idea with like. Thanks for your support!

Still in the range(box of triangle)Keep an eye on candle pattern.
Especially, week candle.
( Hint🤫, No lower shadow(wick) usually makes price action. But there is high probability to make one more dip )
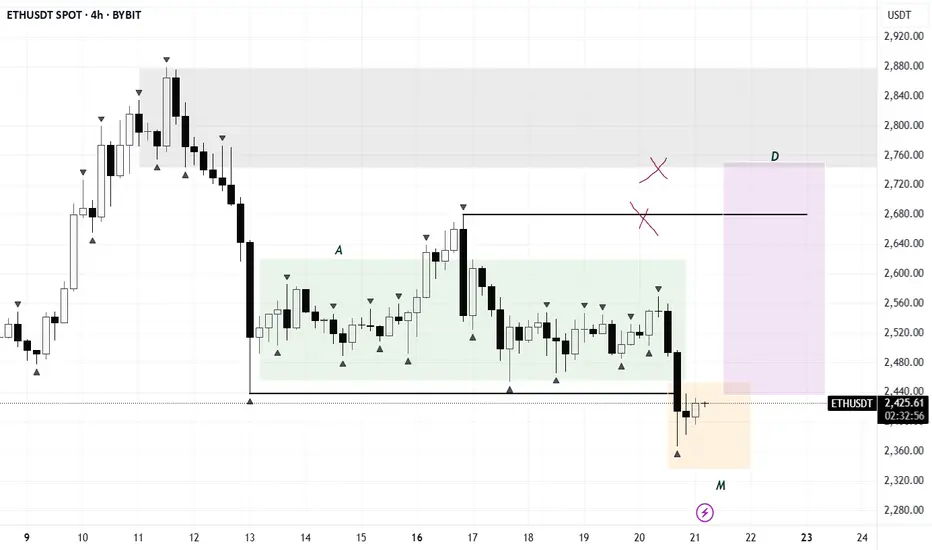
ETH/USDTFollowing the consolidation phase, we’ve seen a clear manipulation move — the structure closely resembles an AMD setup. As long as the pattern holds, upside targets are in the $2700–$3000 range.
Ethereum:Daily signalhello guys👋
According to the drop we had, you can see that buyers came in and the price had a good growth, and after that a trading range was made in which the price got stuck.
Now, considering that the price is in the trading range and it seems that the buyers have shown their support, it is possible to step into the specified support areas with risk and capital management and move up to the set goals.
🔥Follow us for more signals🔥
*Trade safely with us*
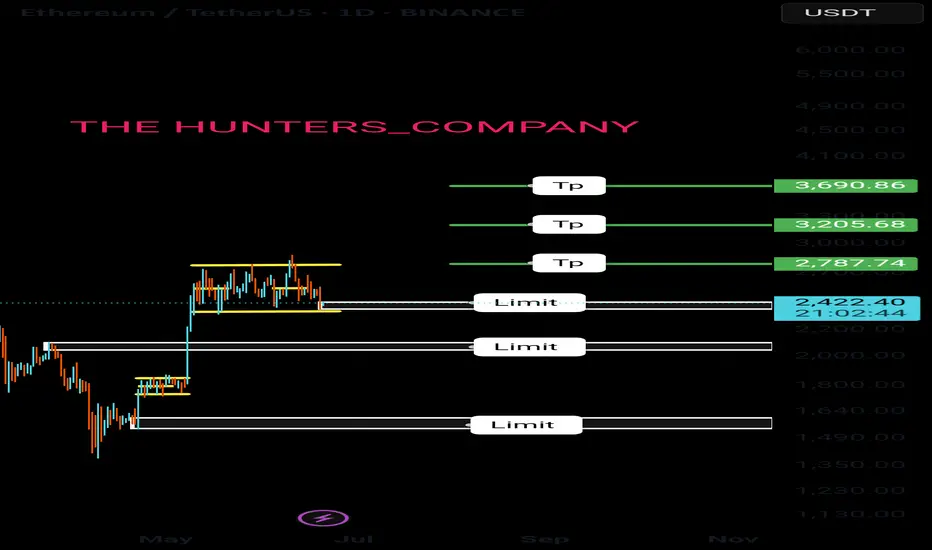
ETH Update: A Possible Rebound!ETH Weekly Update
ETH has formed a support trendline in the $1500–$1600 range and previously rebounded from it with a 90% gain. After a retest, it’s once again showing signs of a potential rebound from the $2100 level.
If this rebound holds, it could bring relief to price momentum, and we may see ETH retesting the $3500 zone. The RSI still has plenty of room to expand, suggesting further bullish potential.
Strategy:
~ Entry: $2100 to Current Market Price (CMP)
~ Accumulation Range: $1500–$1600
~ Trade Type: Spot
~ Holding Period: Q4 2025
~ Target: $3500
Note: Always do your own research and analysis before making any decisions. This is not financial advice.
Regards,
Dexter
Lingrid | ETHUSDT potential Bullish Trade from the ConfluenceBINANCE:ETHUSDT is retesting a key support area near 2500 following a deep pullback from the 2765 rejection zone, while holding above a multi-week ascending trendline. The recent bounce has not yet invalidated the bullish structure, and the confluence with the downward breakout level adds significance to this zone. A higher low above 2480 could trigger a sharp reversal back toward the 2765 resistance.
📈 Key Levels
Buy zone: 2475–2520
Sell trigger: breakdown below 2450
Target: 2765
Buy trigger: breakout above 2620
💡 Risks
A breakdown below 2475 would cancel the bullish setup
Lack of volume on bounce attempts may signal weakness
Macro events or BTC drop could drag ETH lower regardless of setup
Traders, if you liked this idea or if you have your own opinion about it, write in the comments. I will be glad 👩💻
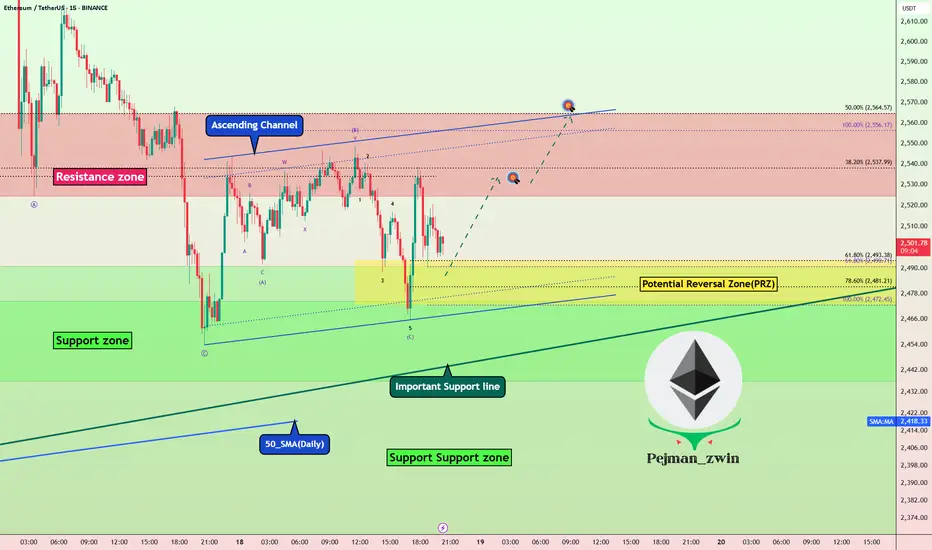
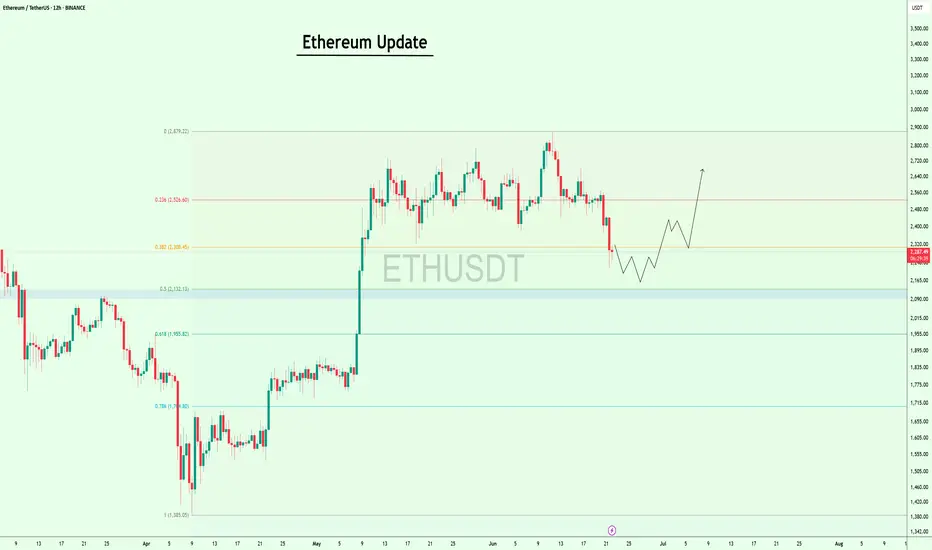
Ethereum at PRZ: Bullish Setup _ Short termEthereum ( BINANCE:ETHUSDT ) reacted from the Potential Reversal Zone (PRZ) around the confluence of key Fibonacci levels , the Important Support line and 50_SMA(Daily) .
From an Elliott Wave point of view , we can identify a Expanding Flat (ABC/3-3-5) structure ending right above the Support zone ($2,474-2,437) .
The structure also hints at the formation of a new upward leg , potentially leading ETH toward the Resistance zone ($2,564-$2,524) and the upper line of the Ascending Channel .
I expect Ethereum to test the 38.2%($2,531=First Target) - 50%($2,561) Fibonacci retracement levels on the way to a potential retest of the previous swing highs .
Note: Stop Loss (SL) = $2,451= Worst Stop Loss(SL)
Please respect each other's ideas and express them politely if you agree or disagree.
Ethereum Analyze (ETHUSDT), 15-minute time frame.
Be sure to follow the updated ideas.
Do not forget to put a Stop loss for your positions (For every position you want to open).
Please follow your strategy and updates; this is just my Idea, and I will gladly see your ideas in this post.
Please do not forget the ✅' like '✅ button 🙏😊 & Share it with your friends; thanks, and Trade safe.
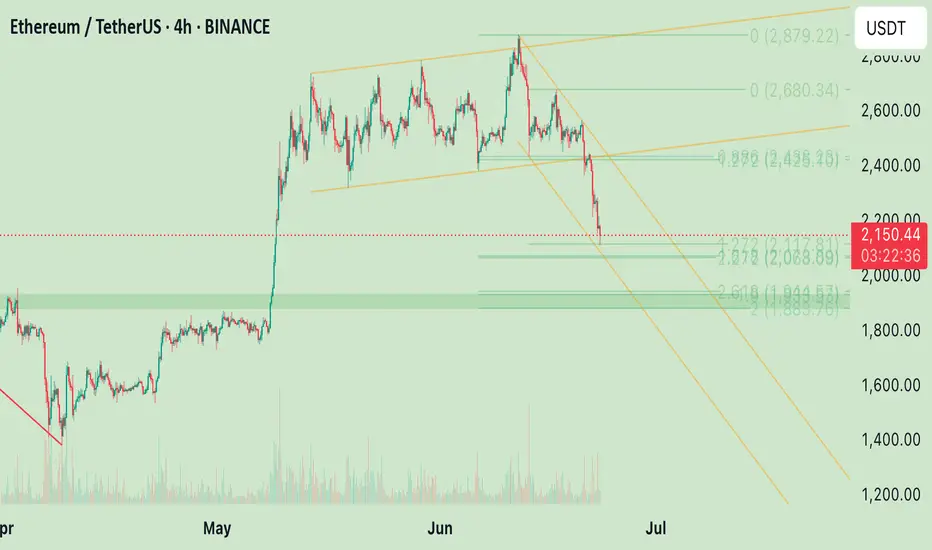
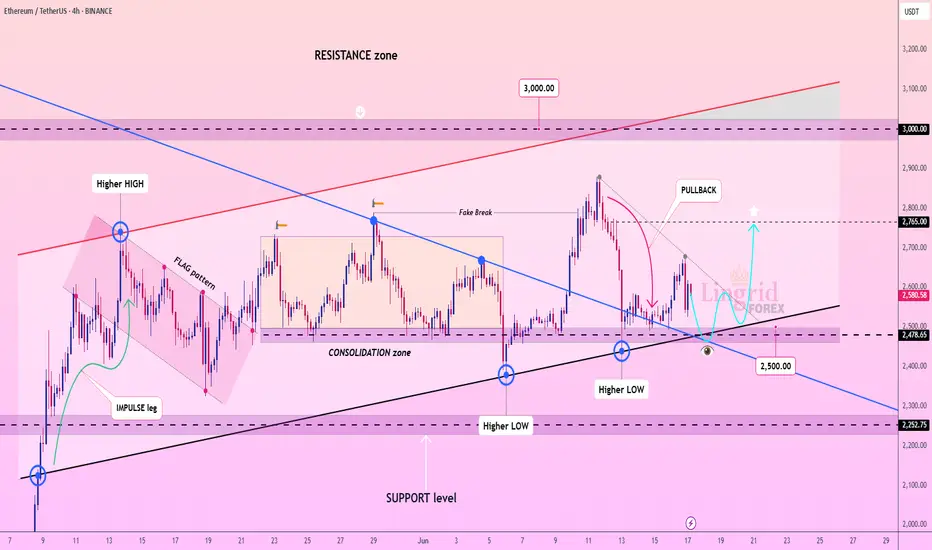
Will ETH be able to return to the key level of $2,500?⚡️ Hello, everyone!
Over the weekend, Bitcoin and the entire market fell sharply due to geopolitical instability. ETH reached $2,120! And now it is trading at $2,440. However, as long as the price remains below the psychological level of $2,500, this is definitely a bearish signal.
❓ And the main question arises: will ETH be able to return to the $2,500 level and above, continuing its growth? Let's figure it out:
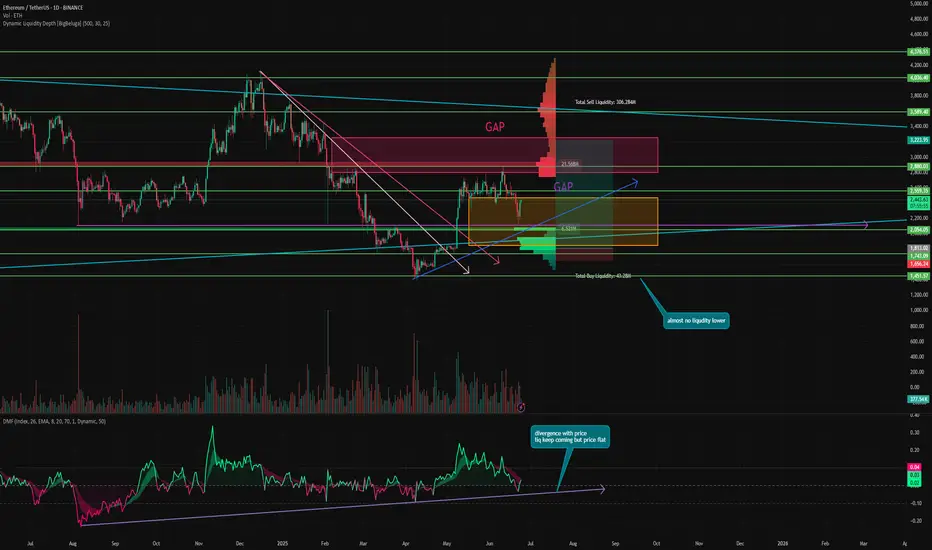
As I said in my previous review, ETH began to close the GAP from below at the levels of $2,470 - $1,855. However, there is also a GAP from above at the levels of $2,807 - $3,260. And after closing the current one, the next target will be this one. After all, as we know, 99% of GAPs close sooner or later.
📊 The price is in a flag pattern, and the first squeeze of the sloping support of the figure led to a price increase from $1,390 to $2,880 at its peak. However, the next test is unlikely to go so low, and therefore will not have the same effect. Therefore, the ETH price will likely continue to squeeze until it breaks one of the slopes, setting the direction.
⚙️ Metrics and indicators:
Money Flow - fresh liquidity has been flowing into ETH for almost a year now! Even despite the correction, the inflow has only been increasing since August 2024.
Liquidity Depth - as we know, the price moves from one liquidity zone to another. And now, there is significantly more liquidity concentrated at the top than at the bottom. This means that it is much easier to move the price up.
📌 Conclusion:
I'm not trying to say that ETH will skyrocket right now. But it's definitely not where it should be. And when it goes up, it will go up a lot, and we need to be ready for that.
I don't think we'll see levels of $1,500 and below again. But $1,800 at the end of summer or beginning of fall is quite realistic.
So be patient, we'll definitely get our chance!
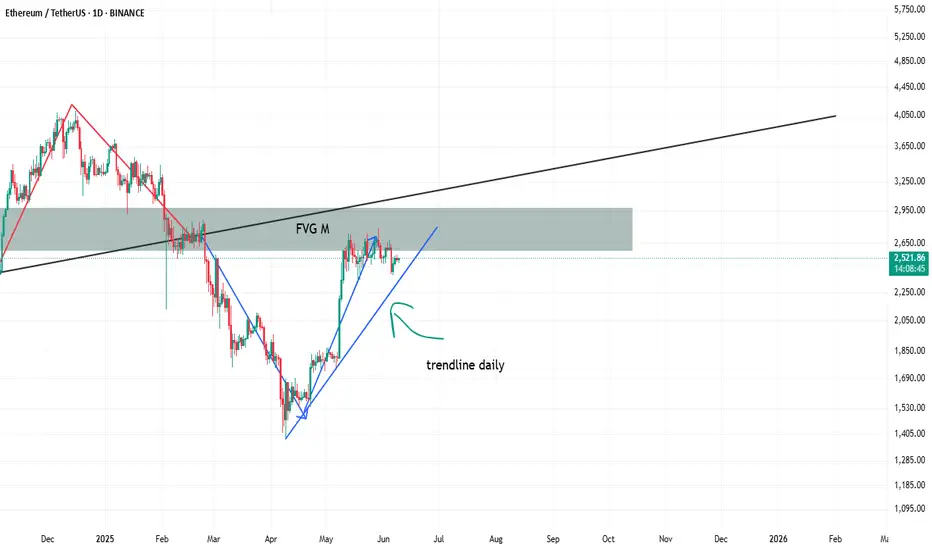
Should i start panicking ?
Man, I really wish I didn’t look at this chart right before bed—this thing looks like it’s straight out of a horror movie.
From what I can tell, we’ve got a monthly bearish inverted FVG lining up perfectly with daily resistance. There’s also a broken trendline on the daily, and right after it snapped, we got that sharp V-shape move, which looks like a classic retest—either of the broken support or the trendline that flipped to resistance.
To add to the bearish vibes, there’s a pretty obvious divergence on the daily chart. That’s not exactly comforting.
Honestly, I’m struggling to find anything bullish here. The only tiny hope is that the price doesn’t break below that daily trendline (the one marked in blue). If it holds, maybe—just maybe—we can reclaim the broken main trendline and turn that resistance back into support.
If anyone out there is deep into crypto and has thoughts on how to approach this kind of setup, I’d really appreciate your take. Could use another perspective right about now.
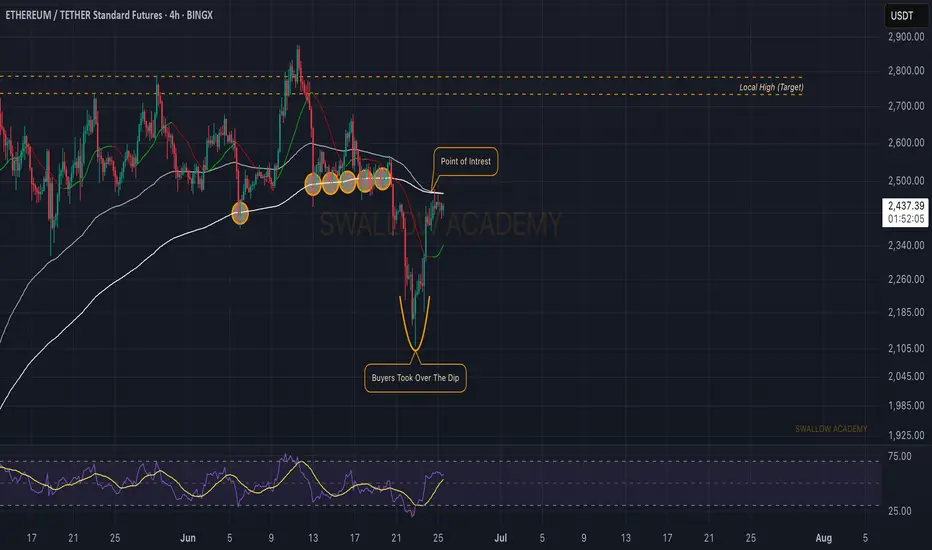
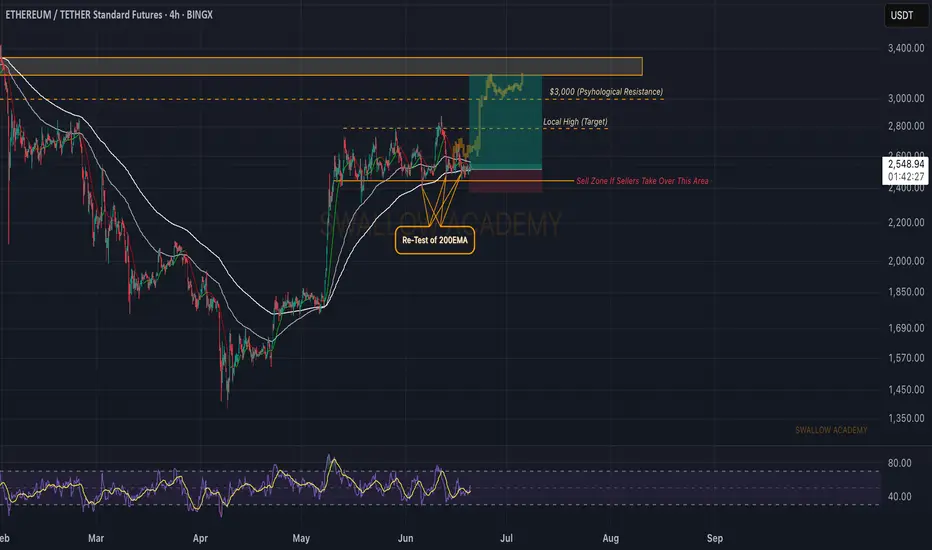
Ethereum (ETH): Seeing Bounce From 200EMA | Buyers AccumilateEthereum is showing some signs of recovery, where buyers might be into something here. If we keep same volume momentum until the end of the day, we might see another attempt to go for the $3000, which is our major target as of now.
Swallow Academy
ETH READY TO GO 3000$ ???🔍 ETH/USDT Analysis – Daily Timeframe
ETH is currently trading at $2,427, holding above the key support zone around $2,370 - $2,390, which is aligned with the 100 EMA. This zone has acted as a strong accumulation area.
📈 Market Structure:
Price is consolidating inside a horizontal range. A confirmed breakout above the resistance zone ($2,650 - $2,700) could lead to a bullish continuation towards the major resistance at $2,861.
📊 Technical Outlook:
Trend: Sideways range (accumulation phase)
100 EMA: Acting as dynamic support
Breakout Potential: Bullish continuation expected on breakout and retest
📌 Trade Plan (Not Financial Advice):
Entry Idea: Break and close above $2,700 zone
Target: $2,861 and higher
Invalidation: Daily candle close below $2,370
ETH is building strength above its 100 EMA. A breakout from this range can trigger a fresh bullish leg.
🔁 Like & share your opinion! Always DYOR before trading.

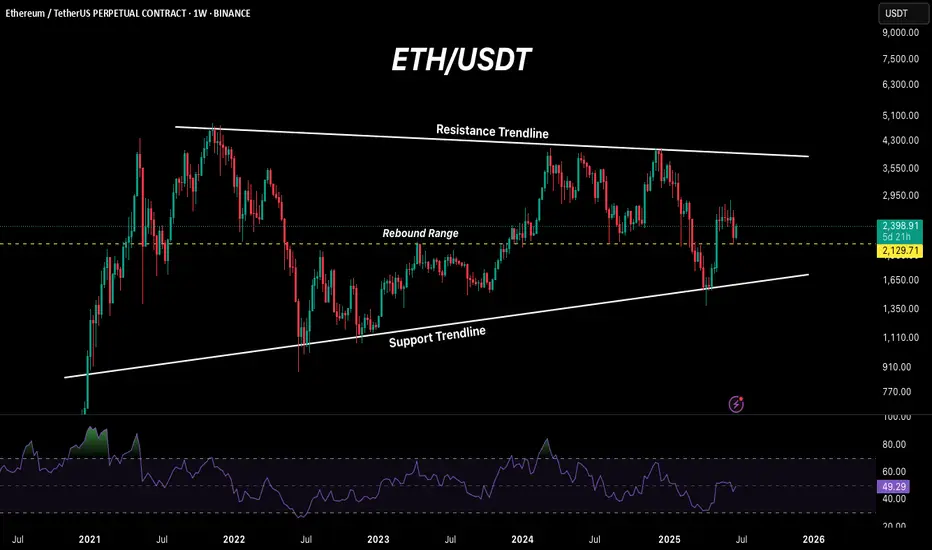
ETH/USD Weekly | The Full Breakdown – Structure, Spring, and Set
This is my full Ethereum weekly chart analysis — not just what I think might happen, but a walk-through of everything I’ve mapped and labelled, based on how price has behaved since the 2021 top.
Every structure you see here is there for a reason — from the symmetrical triangle and wedge, to the Wyckoff schematics, Elliott wave flow, Spring, and more. What we’re seeing now, in my opinion, is the end of a three-year macro compression. The move that follows could define the rest of this cycle.
Let me take you through it.
After the all-time high in late 2021, Ethereum entered a structured, controlled decline. Not a crash — but a step-by-step transition through market phases. Price dropped and bottomed into a clear accumulation phase — that’s the first box on this chart, labelled as “Accumulation (cause)”. This is where smart money started taking positions, confirmed by the Spring down to 0 and the base of the move at point 2. From there, price consolidated, gained strength, and then jumped the creek — a clear breakout above the accumulation range, which gave us the confirmation for markup.
The markup phase took us from that Spring up into a five-wave impulsive move, peaking around the distribution zone. You can see it clearly — labelled Distribution, and boxed off between points A, B, C and the final wave 5. This rally failed to make new all-time highs, stalled, and was rejected cleanly. From there, we rolled over and started losing structure — and this is where it gets important.
Right after distribution, we got a breakdown I’ve labelled “Break The Ice”. This wasn’t just another dip. It was the moment we lost all structure from the markup — the line that had held the previous lows snapped, and volume stepped in. This is often the first real signal that we’ve entered the markdown phase. From a Wyckoff perspective, this breakdown is what separates Phase D from the start of a new accumulation cycle. It’s aggressive, deliberate, and clears out late longs — and that’s exactly what it did here.
Following that breakdown, we formed a new falling wedge — drawn from the top of the markdown all the way to the most recent lows. Price was making lower highs and lower lows, but with less aggression and momentum weakening. This wedge sits inside the larger symmetrical triangle, which has been developing ever since the 2021 top. The apex of this triangle, marked around $2,496, is where I believe everything will come to a head. Break that with conviction — and we could start a whole new macro leg.
But before we get there, something happened worth pointing out. That final breakdown inside the wedge? The one that dipped below and quickly reclaimed? That, for me, was the Spring. It’s labelled in yellow as “Spring” under point D. And it matches the Wyckoff schematic almost perfectly. Volume dried up on the move down. RSI and CCI both showed divergence. Then price bounced hard, reclaimed structure, and we’ve held ever since. This doesn’t look like continuation — it looks like a trap.
If that Spring holds, then we’re now in the Sign of Strength (SOS) phase. This is the moment where price reclaims its mid-structure levels, consolidates, and prepares for the breakout. We haven’t broken out yet — but the groundwork is in place.
My Elliott count also lines up. We had a 5-wave impulse from the Spring to the failed rally, followed by an ABC correction. What we may now be seeing is the completion of another Wave 2, setting up for a possible Wave 3 — the strongest wave of the cycle, if confirmed.
Now let’s talk entries. I’ve got my eye on the $2,130–$2,030 region. That’s where I’m placing my DCA bids. It’s the area just above the Spring reclaim zone, where price should react again if we retest. If we lose $1,690, I consider the Spring invalidated and will reassess. That’s my clean risk level.
Break and hold above $2,496, and the breakout is confirmed. That level is not just the wedge and triangle resistance — it’s also the psychological midpoint of this whole macro structure.
Everything’s mapped. Structure is clean. Volume is drying up. Momentum is shifting. And price is compressing right into the apex.
This isn’t a moment to chase. It’s a moment to plan.
If we break out, I’m ready to scale in. If we reject, I’ll be watching the DCA zone and the Spring level closely. Either way, I know what I’m looking for — and I know what invalidates the setup.
Let’s see what price does next.

#Ethereum Update!!CRYPTOCAP:ETH has broken below the $2,308 resistance zone and is now trading lower.
Price is approaching a key demand area around $2,132–$2,000, where we’ve seen strong buyer reactions in the past.
IMO, if bulls step up and defend this zone, we could see a recovery bounce aiming for $2,526, the next major resistance ahead.
I’ll keep you updated as things develop.
If you find my updates helpful, don’t forget to like and follow for more! DYOR, NFA
Ethereum vs Small Cap. & The 2025-26 Cryptocurrency Bull MarketThe last three days ended up being a very nice flush, a strong one but the action quickly recovered above the 18-May low.
Ethereum was trading above $2,300 since mid-May and always stayed above this level. It broke suddenly below, out of nowhere, but the action is bullish again. We can say that this was a stop-loss hunt event, a bear-trap and nothing more or else we would see a continuation of the bearish action rather than a strong inverse reaction, a bullish jump.
It is not only Ethereum of course that is experiencing this type of bullish action, some altcoins are going nuts. Really crazy right now producing so much momentum that people are still wondering if the market is going down... Or is it going up?
It is obviously up, just look at the 7-April low.
Ethereum hit a low of $1,385 on 7-April. The higher low yesterday ended at $2,111.
You see what I mean?
The market is ultra-bullish because the last low is so far away. It is impossible that it will be tested even less possible for it to break. Ok, so a market shakeout we agree but now that the shakeout is complete what is supposed to happen next?
Watch the smaller altcoins.
Thank you for reading.
Namaste.
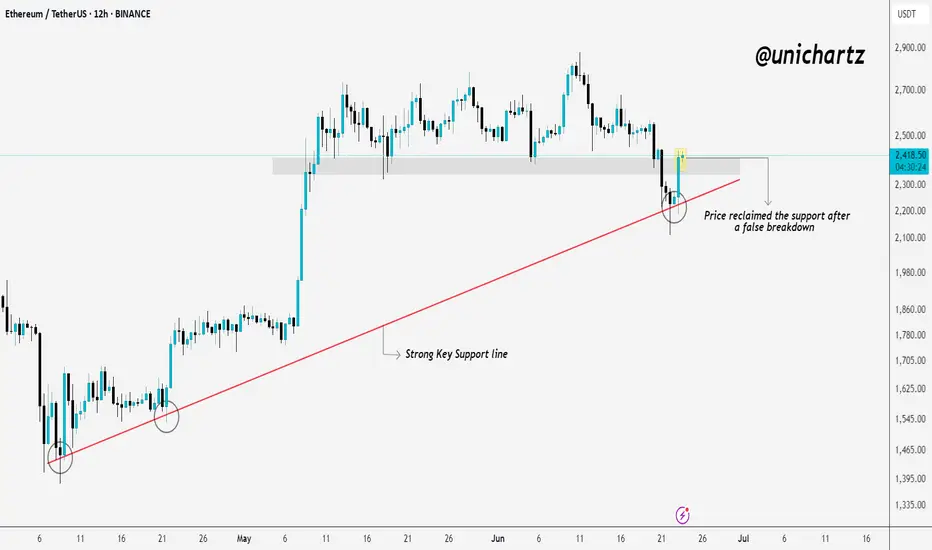
False Breakdown on ETH – Bulls Back in Control?CRYPTOCAP:ETH just pulled a classic fakeout move — breaking below a key support and rising trendline, only to snap right back above it.
This false breakdown caught the bears off guard, and now price has reclaimed the support zone with strength.
As long as ETH holds above this reclaimed level, we could see a short-term push higher. Watch for follow-through, bulls need to keep the momentum alive.
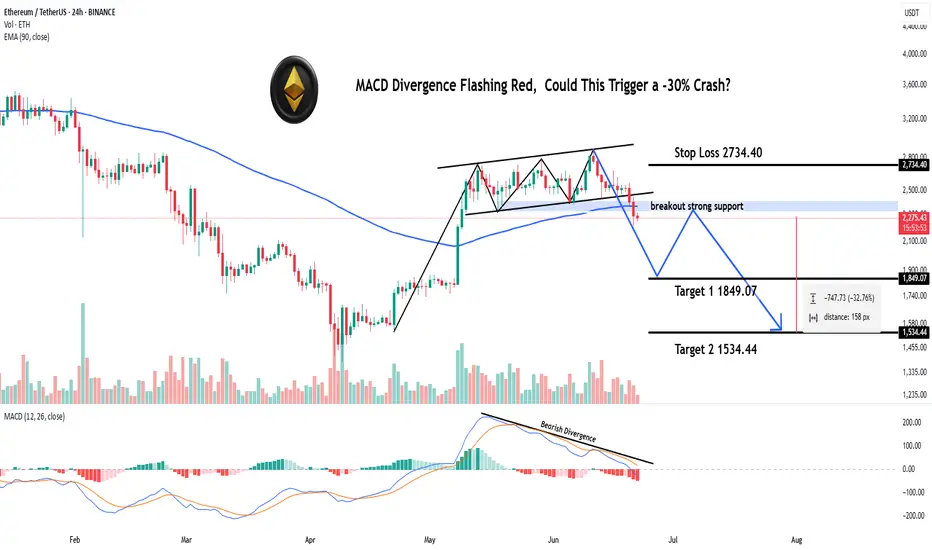
MACD Divergence Flashing Red, Could This Trigger a -30% Crash?Hey Realistic Traders!
Bearish Reversal Signal Flashing on BINANCE:ETHUSDT , Is the Bull Run Over?
Let’s Break It Down..
On the daily timeframe, Solana (SOL) has formed an ascending broadening wedge, which has now broken to the downside through both the lower trendline and a major support zone, indicating a shift in market structure.
Price action has also remained consistently below the 200-day EMA, signaling a potential transition from a bullish to a bearish trend.
A bearish divergence has appeared on the MACD indicator, where price makes higher highs while the MACD forms lower highs. This divergence indicates that buying momentum is weakening, even as the price pushes higher. Such a pattern often precedes a trend reversal and supports the expectation that the price may continue to move lower.
Given these technical signals, the price is likely to continue moving lower toward the first target at 1849.07, with a possible extension to the second target at 1534.44.
This bearish outlook remains valid as long as the price stays below the stop-loss level, currently marked at 2734.40. A move above this level would invalidate the bearish setup.
Support the channel by engaging with the content, using the rocket button, and sharing your opinions in the comments below.
Disclaimer: "Please note that this analysis is solely for educational purposes and should not be considered a recommendation to take a long or short position on ETHUSDT.
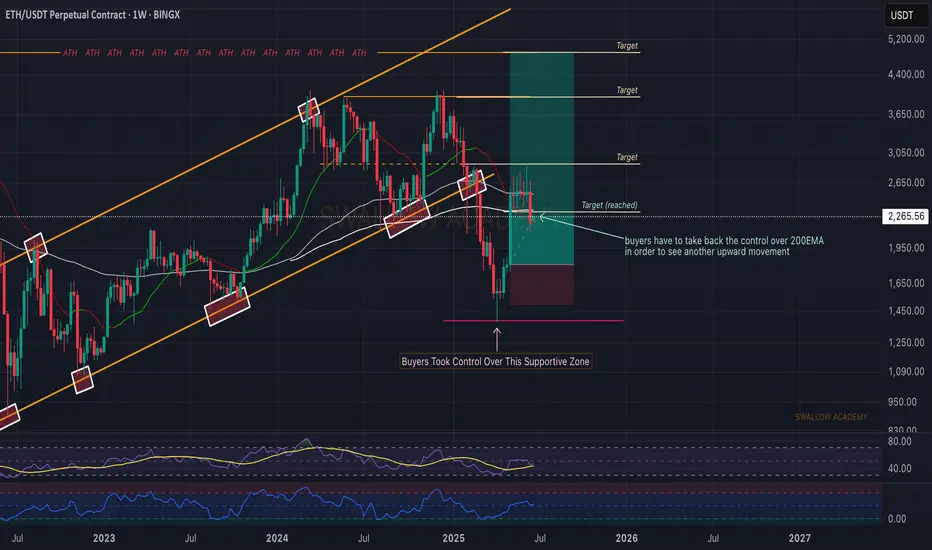
Ethereum (ETH): Golden Buy Zone | Buyers Taking ControlBuyers are taking control near the 200EMA, which could give us a really good bounce to upper zones from here on.
We see whales accumulating the ETH, which confirms our saying that Ethereum has not yet reached its potential.
The key zone is the 200EMA as of now.
Swallow Academy
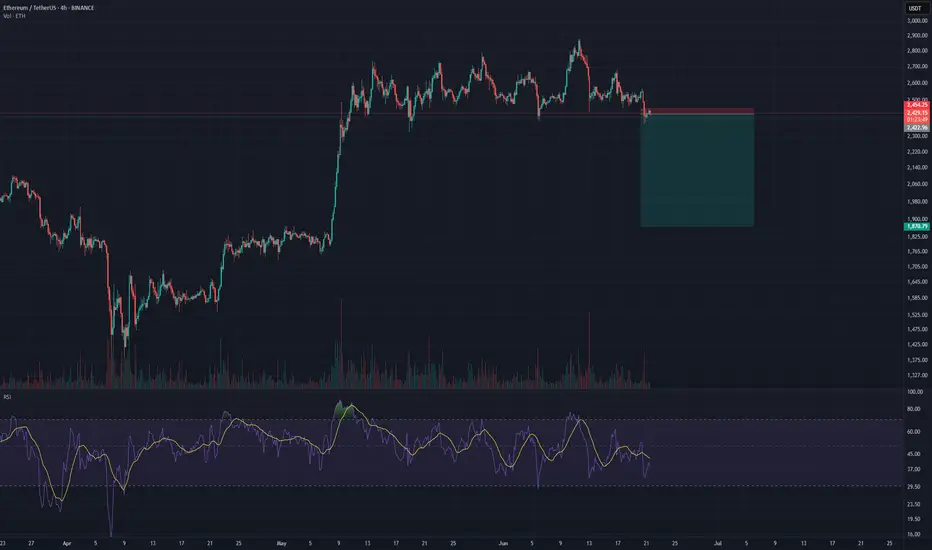
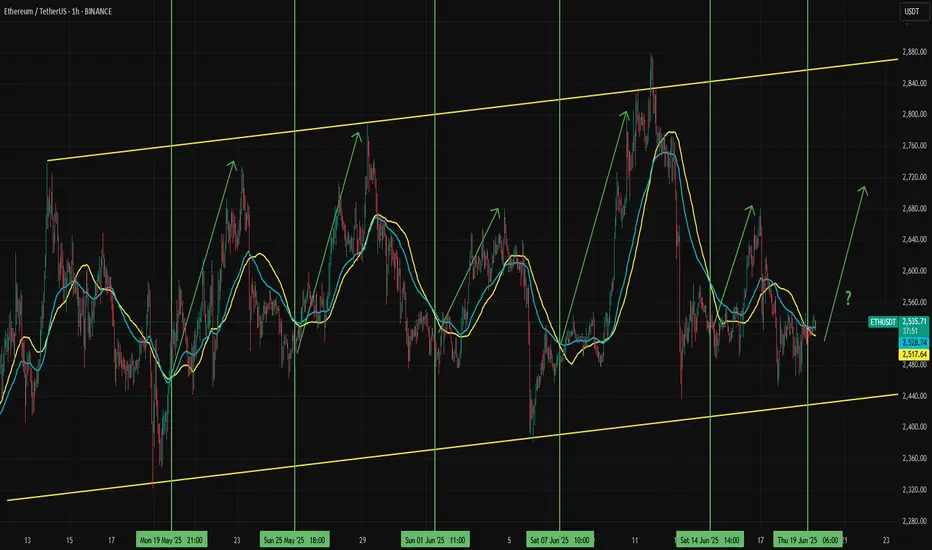
Potential Long Setup for EthereumEther stabilized in a slightly positive trend after breaking the previous uptrend. Since mid-May, this flattish trend channel has continued, offering some trading opportunities within it.
When Ethereum approaches the lower line and the 50 EMA crosses above the 50 SMA, an ETHUSDT surge has followed each time since the channel formed. Traders could expect a similar move again. However, the key risk is potential negative pressure on stock markets due to geopolitical concerns and the correlation effect on the crypto market and a break of the channel.
ETH - SHORT SET-UPBINANCE:ETHUSDT
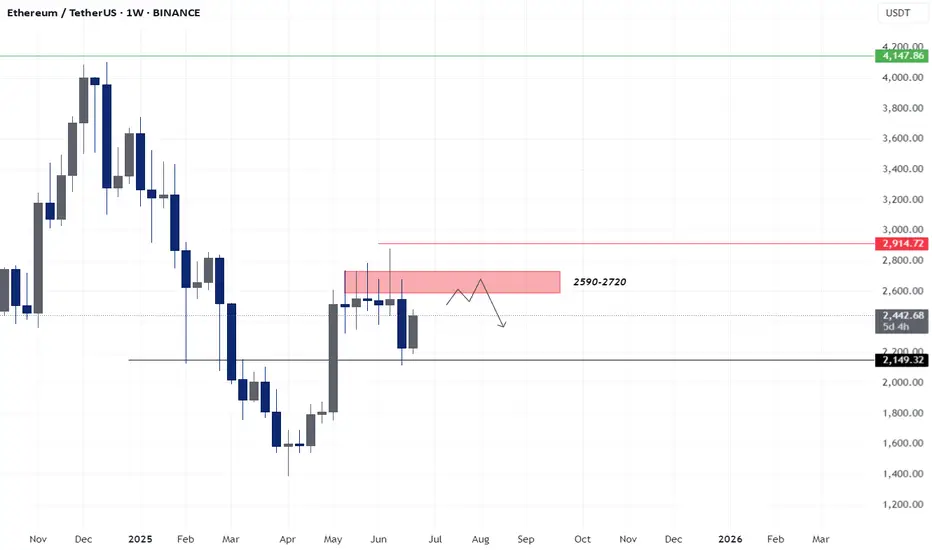
Short Setup Summary (ETH/USDT Weekly):
Resistance Zone: $2,590–$2,720
View: Expect rejection from this zone
Target: $2,150
Stop-loss: Above $2,914
Setup Type: Supply zone rejection (bearish setup)
Confirmation: Watch for reversal candles in the zone