ETHEREUM is having a bearish retest?#ethereum price has been moving in a distribution zone and needs to breakout at least 3000$ to be optimistic and 3300$ to be bullish. #eth price is now having a bearish retest where broke the former support zone and now testing the current resistance zone. 4H ichimoku cloud must be broken out. A heavy declination from this zone may cause heavier dumps.
ETHUST.P trade ideas
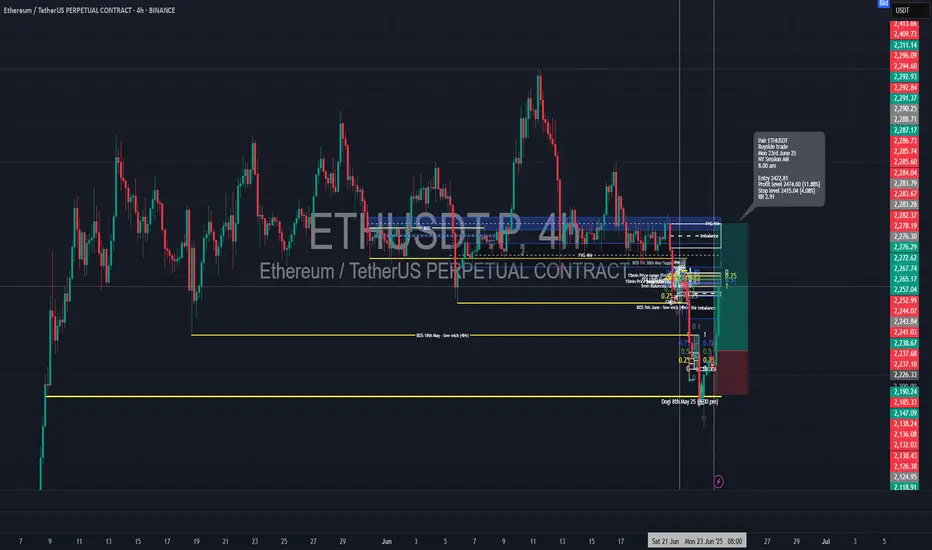
Long trade
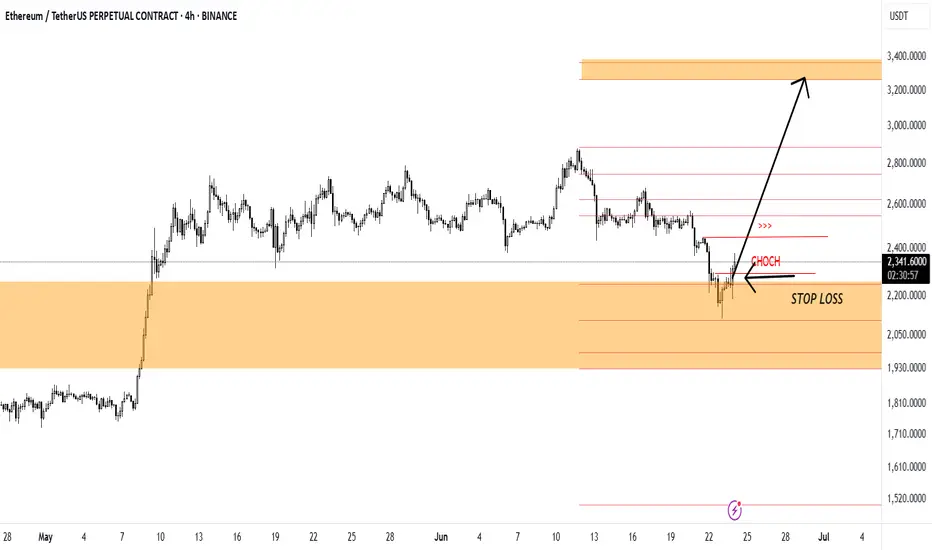
🟢 Trade Journal Entry – Buyside Trade
📍 Pair: ETHUSDT
📅 Date: Monday, June 23, 2025
🕒 Time: 8:00 AM (NY Session AM)
⏱ Time Frame: (Assumed 4Hr TF)
📈 Direction: Buyside
📊 Trade Breakdown:
Metric Value
Entry Price 2422.81
Profit Level 2474.60 (+2.14%)
Stop Loss 2415.04 (−4.08%)
Risk-Reward
Ratio 2.91 : 1
🧠 Context / Trade Notes:
NY Session AM Execution:
Trade entered at the start of the New York session, aiming to capture directional momentum amid strong ETH volatility.
Liquidity Sweep Confirmation:
Clear stop-hunt below prior swing low sets up the reversal conditions
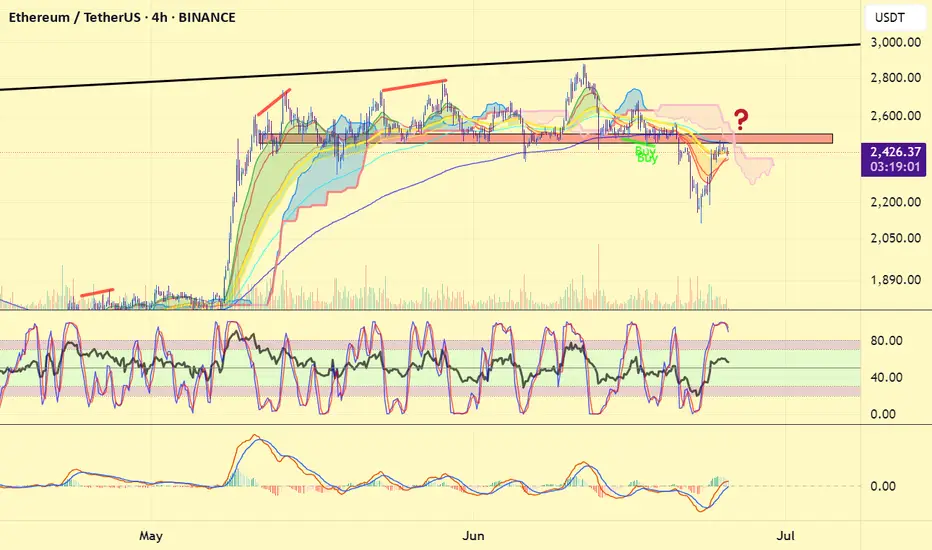
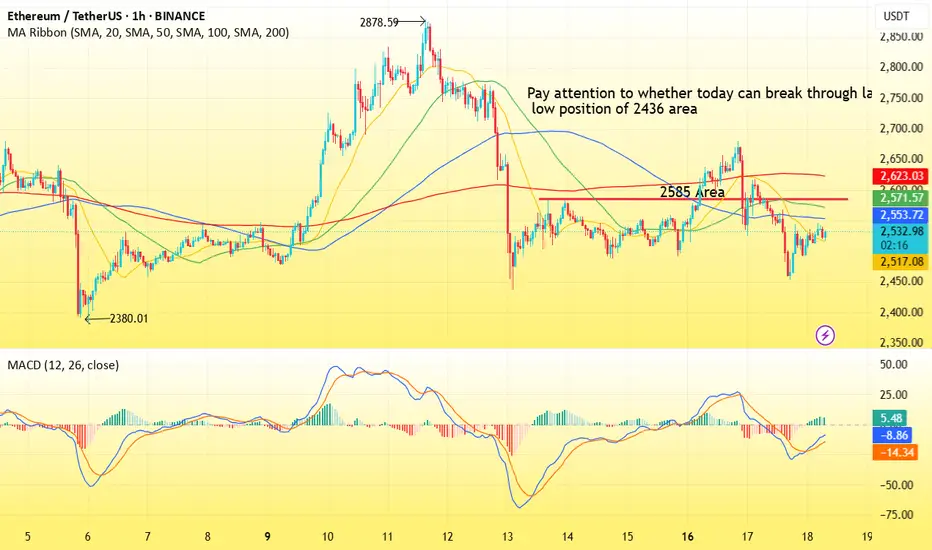
Weekly trading plan for Ethereum BINANCE:ETHUSDT After the weekend, the price showed a solid recovery and is now attempting to break above the recent low at $2,436. If the breakout succeeds, we could see a move toward the marked resistance levels. Alternatively, we might get a local pullback before further upside. However, if the Pivot Point is broken to the downside, there’s a chance we’ll see a continuation of the bearish move
Write a comment with your coins & hit the like button and I will make an analysis for you
The author's opinion may differ from yours,
Consider your risks.
Wish you successful trades ! mura

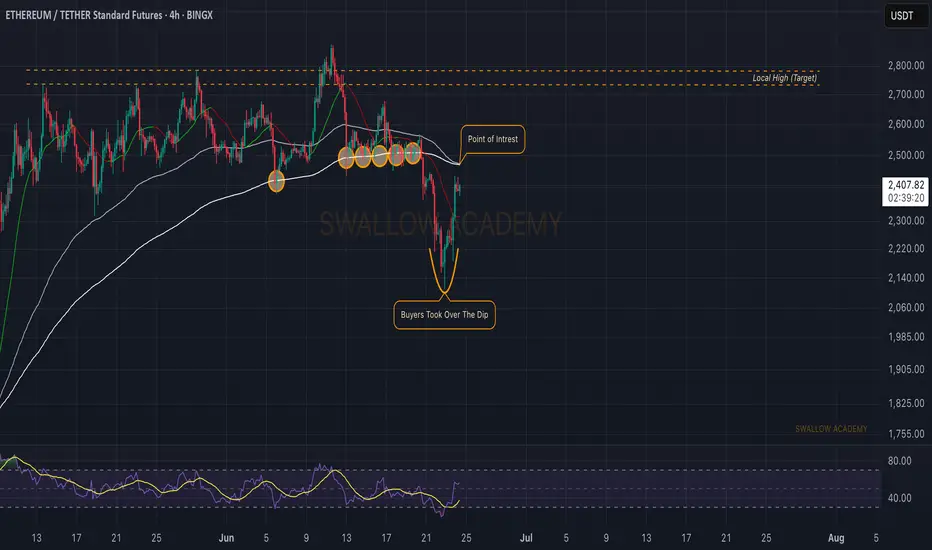
Ethereum (ETH): Attentions at 200EMA | Targeting Local HighEthereum is back near EMAs after a nasty drop we had recently due to news we had. Now it is basically the waiting game, where we just wait for confirmations of either a breakout from here or a rejection and movement back to lower zones.
We are looking more for the breakout scenario just based on the buyside volume we had recently, which showed the dominance of buyers!
Swallow Academy
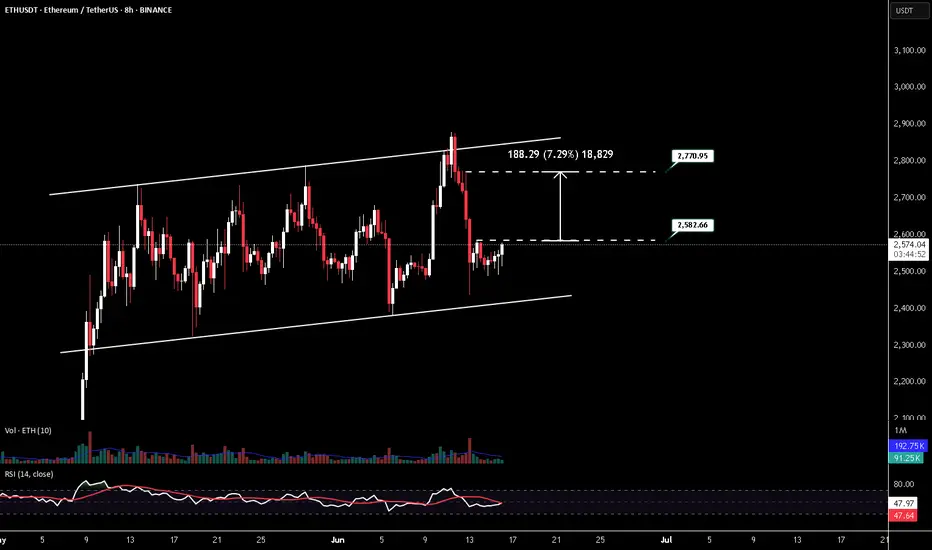
ETHUSDT LONG POSITION ENTRY: 2582.66
TAKE PROFİT : 2770.95
STOP LOSS : 1/3
Do not use high leverage!
Remember cash management (planning)!
Please follow the stop-loss rule!
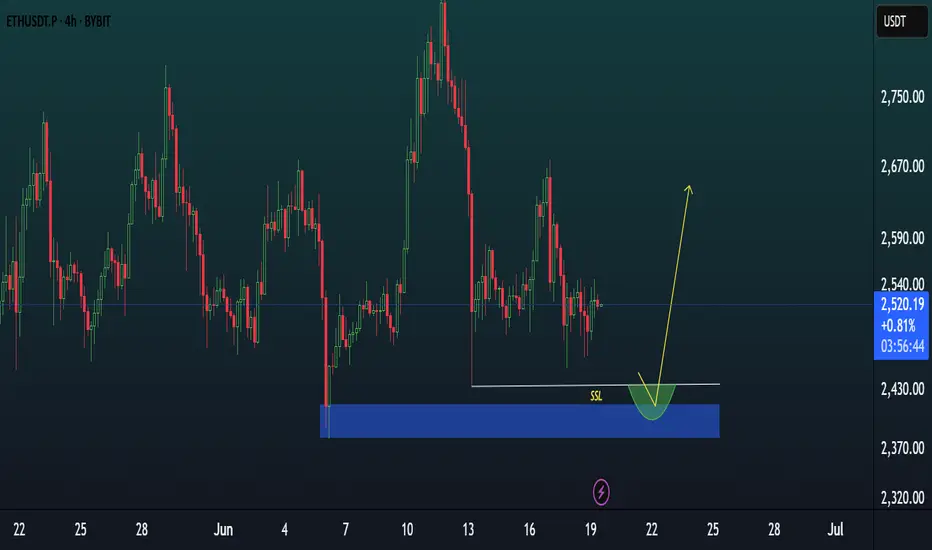
ETHEREUM accumulated and ready to goOn a very negative news price is drop to POI of the dealer and well accumulated. We believe that next bullish move about to happen
ETH(20250618) market analysis and operationTechnical analysis of ETH contract on June 18:
Today, the large-cycle daily level closed with a small negative line yesterday, and the K-line pattern continued to fall. The price was at a high level but had no strength and continued trend. Instead, it was easy to fall under normal pressure. The attached indicator was dead cross, and the big trend was still very obvious. In this way, we are more optimistic about the price continuing to fall and breaking the low point in the future; the short-cycle hourly chart fell continuously yesterday, and the European session continued to break the previous day's low point in the US session. It is still in a corrective trend, but according to the current trend, it is highly likely to continue today. Whether it can break down the low point of last week needs to be paid attention to. There is no room for operation during the day, so wait and see today, focusing on the strength and weakness of the European session and the unemployment data in the evening.
ETH: Short 19/06/25Trade Direction:
ETH Short
Risk Management:
- 0.5%
Reason for Entry:
- Failure to reclaim weekly open
- Loss of weekly open, monthly open, and Monday low
- H2 timeframe oversold but within a reclaimed bearish order block
- Clear bearish grind price action aligning with higher timeframe bearish trend
- Higher confidence in shorts at current level than higher up
Additional Notes:
- Total market cap looks heavy, global situation especially middle east is continuing to see a risk off mindset for risk assets like crypto.
- Until price gives me a reason not to have to assume this is continuing bearish.
- Potential to short higher if this fails
ETh more dump to $2100-$2030Just recently hopped into ETH short. Aiming for $2100 to $2030
Market is correcting on the weekly tf and this is a probably area that it might use to create the new HL for continuation back up.
Time sensitive.
Stop: $2235-$2245 area. $2245 is safer a bit lower RR though.

ETH | Long | 3 Hrs | Target: 2,540This technical analysis is for informational and educational purposes only. It does not constitute financial advice. Remember to always research and consult with a professional before making investment decisions. Good luck! 📈💼🚀
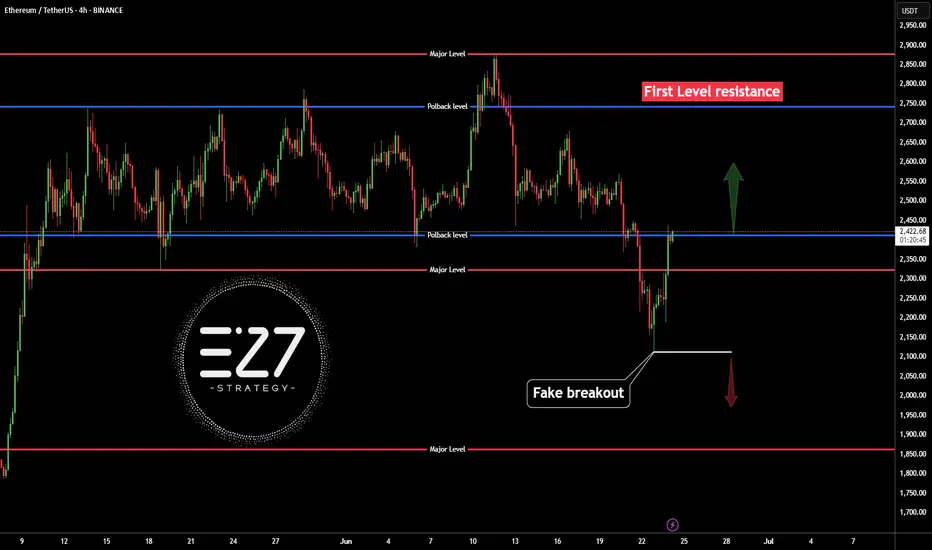
ETHUSDTThis is very easy...
best support level 2300 to 2500 for jump price. but was needed for jump price for get enrgy for movement to high levels by fake breakout.
First level of resistance 2800 to 3000.
⚠️Control Money Management in your capital.
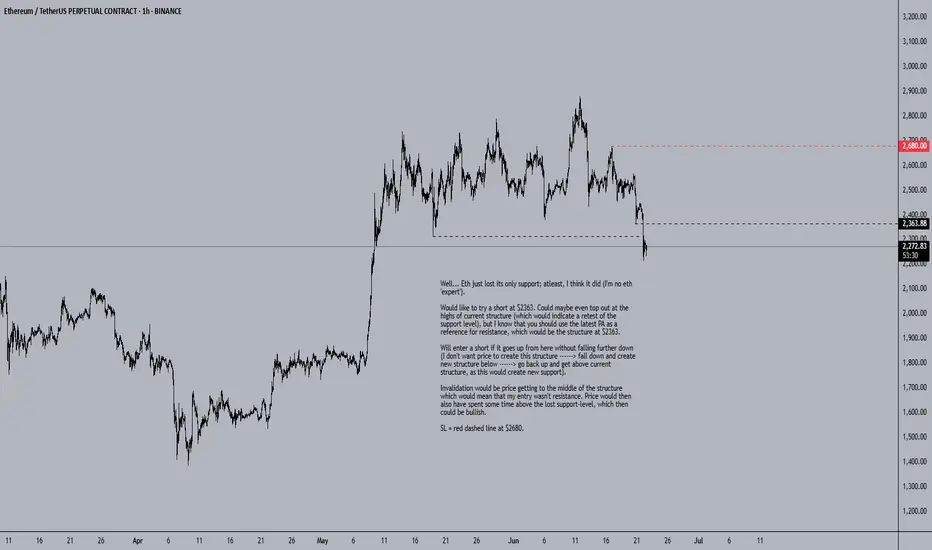
ETH Short SetupWell... Eth just lost its only support; atleast, I think it did (I'm no eth 'expert').
Would like to try a short at $2363. Could maybe even top out at the highs of current structure (which would indicate a retest of the support level), but I know that you should use the latest PA as a reference for resistance, which would be the structure at $2363.
Will enter a short if it goes up from here without falling further down (I don't want price to create this structure ------> fall down and create new structure below ------> go back up and get above current structure, as this would create new support).
Invalidation would be price getting to the middle of the structure which would mean that my entry wasn't resistance. Price would then also have spent some time above the lost support-level, which then could be bullish.
SL = red dashed line at $2680.
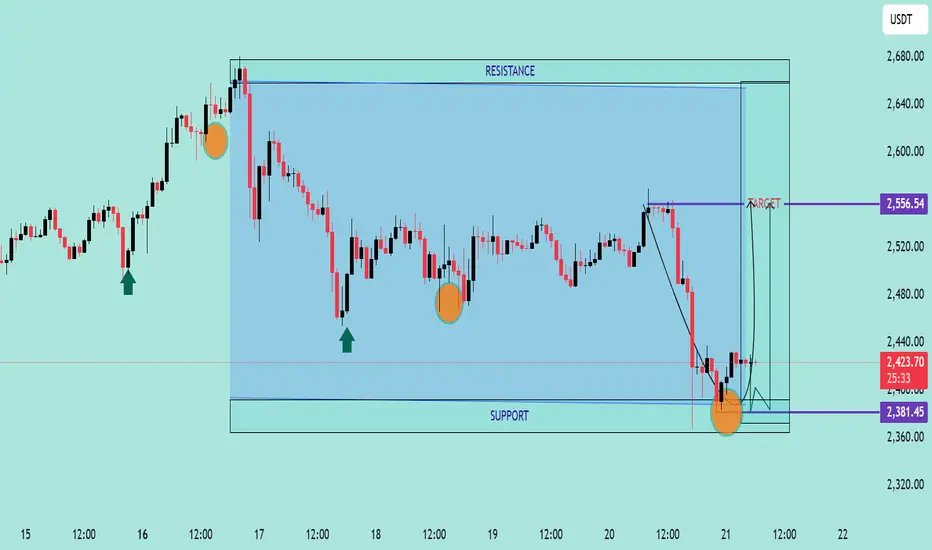
ETH/USDT Bullish Reversal from Support Zone Chart Analysis:
The chart illustrates a range-bound consolidation with clear support around $2,381.45 and resistance near $2,556.54.
🔍 Key Observations:
✅ Multiple Support Tests: Price has tested the support zone several times (highlighted by orange circles) and respected it, indicating strong buying interest at the lower boundary.
📉 Fakeout and Recovery: A false breakout below support occurred, but the candle quickly reversed, signaling a bear trap and potential for bullish momentum.
🔼 Rejection Wick & Consolidation: A strong rejection wick on the most recent candlestick shows buyers defending the zone aggressively. The current price action shows consolidation — a bullish accumulation pattern.
🎯 Upside Target: Based on the range breakout projection, the price could potentially revisit the resistance zone at $2,556.54, marked as the TARGET on the chart.
📌 Technical Outlook:
🟢 Bias: Bullish as long as the price holds above $2,381.45.
💹 Entry Idea: Aggressive buyers may enter near current levels with a stop below the wick low.
🛑 Risk Level: Tight stop-loss needed as the structure relies heavily on support holding.
📈 Conclusion:
A classic range rebound setup is forming with potential for upside movement back toward resistance. A breakout above $2,556.54 could initiate a trend continuation rally
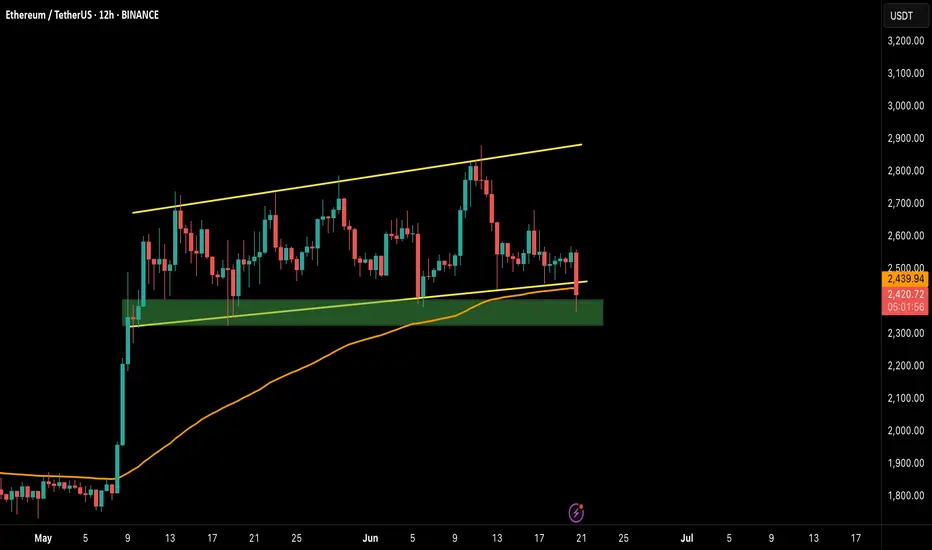
ETHUSDT – LAST HOPE FOR BULLS!Hey Traders!
If you’re finding value in this analysis, smash that 👍 and hit Follow for high-accuracy trade setups that actually deliver!
ETH has officially broken below the ascending channel support and is now testing the final demand zone (highlighted in green). This zone also aligns with the 200 EMA on the 12H timeframe — historically a strong dynamic support.
📉 If ETH fails to hold this green box, it could trigger a deeper correction, potentially dragging the price back towards the $2,200–$2,100 range.
✅ Bullish Case: A quick reclaim of the $2,460–$2,500 area followed by strong volume could invalidate this breakdown and bring back momentum toward $2,800.
🚨 Bearish Confirmation: A clean close below $2,400 on the 12H/Daily with rejection wicks would open the floodgates for lower targets.
💡 This is a make-or-break moment. Bulls need to defend this zone with strength — or risk handing over full control to the bears.
📍 Levels to Watch:
Support: $2,360 / $2,280 / $2,120
Resistance: $2,500 / $2,660 / $2,800
📊 Stay cautious, stay prepared. Follow for real-time crypto breakdowns & setups.

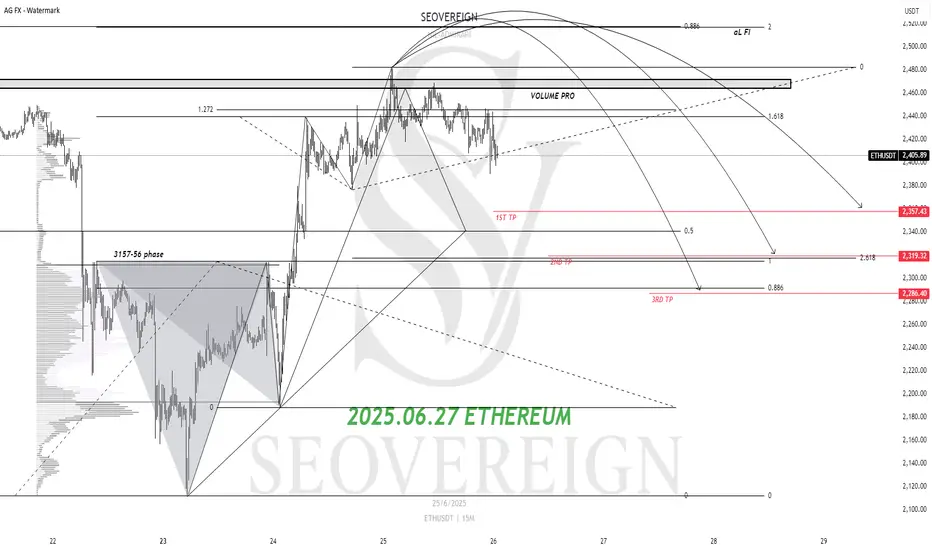
[SeoVereign] ETHEREUM Bearish Outlook – June 27, 2025We are the SeoVereign Trading Team.
With sharp insight and precise analysis, we regularly share trading ideas on Bitcoin and other major assets—always guided by structure, sentiment, and momentum.
🔔 Follow us to never miss a market update.
🚀 Boosts provide strong motivation and drive to the SeoVereign team.
--------------------------------------------------------------------------------------------------------
Hello,
I would like to present a bearish outlook on Ethereum as of June 27, 2025.
In the most recent Bitcoin idea I shared on the 22nd, I explained the reason for setting the take-profit zone at 98,875 and mentioned the possibility of a short-term rebound. Amidst the ongoing war risks in the Middle East that are shaking the overall crypto market, the market has shown a successful rebound, with Bitcoin at the center of this movement.
However, this upward movement has been limited to Bitcoin alone, while other major altcoins have shown weak and sluggish rebounds. In such a situation, when predicting a future decline and considering short positions, I believe it is strategically more advantageous to target altcoins rather than Bitcoin. The inability to properly rebound suggests a momentum issue, which is likely to lead to relative weakness in the market.
Many investors tend to short Bitcoin simply because it has risen significantly in price, but this is a beginner-level mistake. Taking a short position solely based on a large price increase carries high risk, and it is more rational to base strategies on altcoins that are failing to gain upward momentum.
From this perspective, I was preparing the basis for a short position in this idea, and as a technical confirmation signal has appeared, I now present a short strategy for Ethereum. The first target is set around the 2,357 level.
If the movement unfolds, I will further explain the analytical thinking that made it possible to anticipate this decline, along with additional key points to monitor in the market.
Thank you.
ETH/USDTI think it's time for Ethereum to grow and we should wait for higher targets from Ethereum. Tell me what you think.
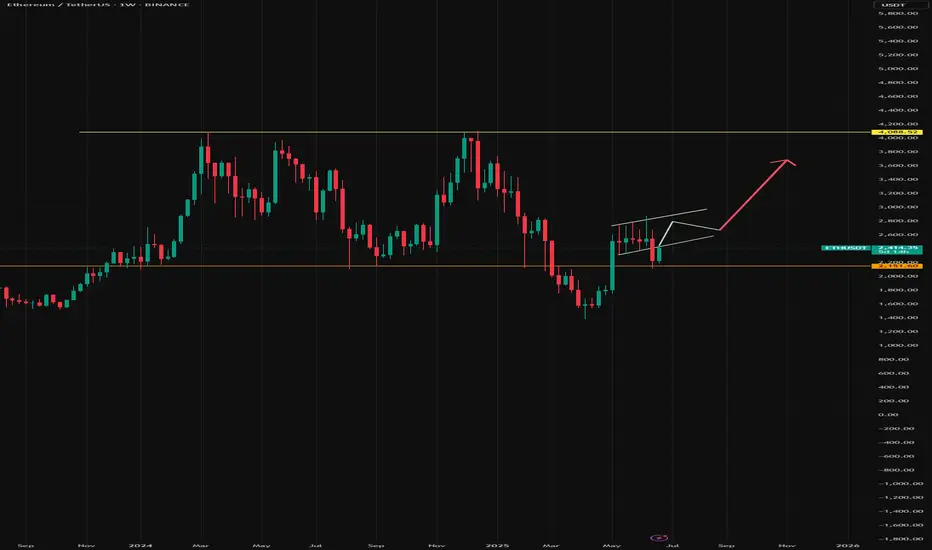
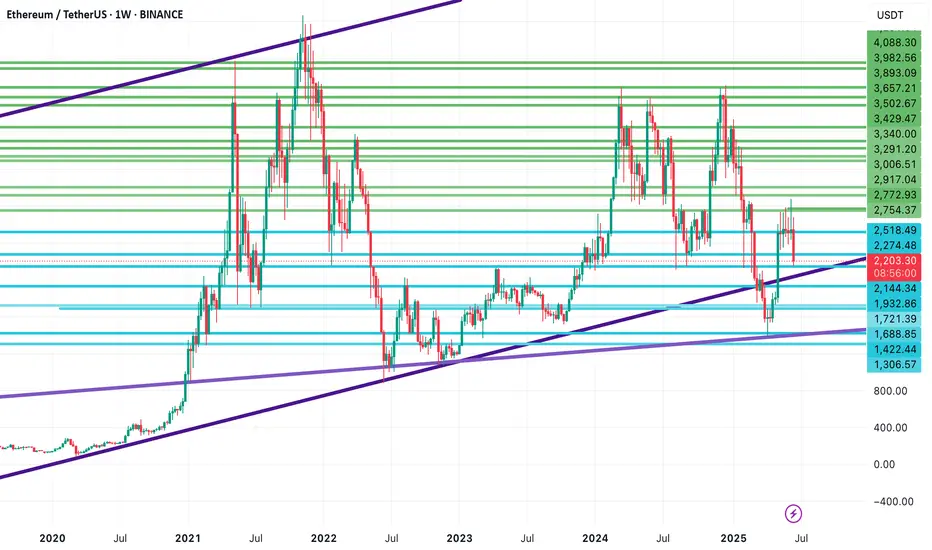
Ethereum at a Critical Support Zone Ethereum Weekly Analysis – Long-Term Perspective
Ethereum is currently experiencing significant bearish pressure and has dropped into a major support zone on the weekly chart. If this critical support breaks, the next key target would be around $2,055, where the price aligns with a long-term ascending trendline, acting as a possible reversal zone.
However, if ETH manages to defend this area and confirms bullish weekly candle closures, we may see a potential recovery toward:
$2,278 as the first resistance
Followed by $2,435 as the next upside target
📌 All support and resistance levels shown in the chart are key decision zones that traders can use for entries, exits, or managing positions.
🧠 Don’t forget to follow for consistent long-term insights and clean technical setups like this.
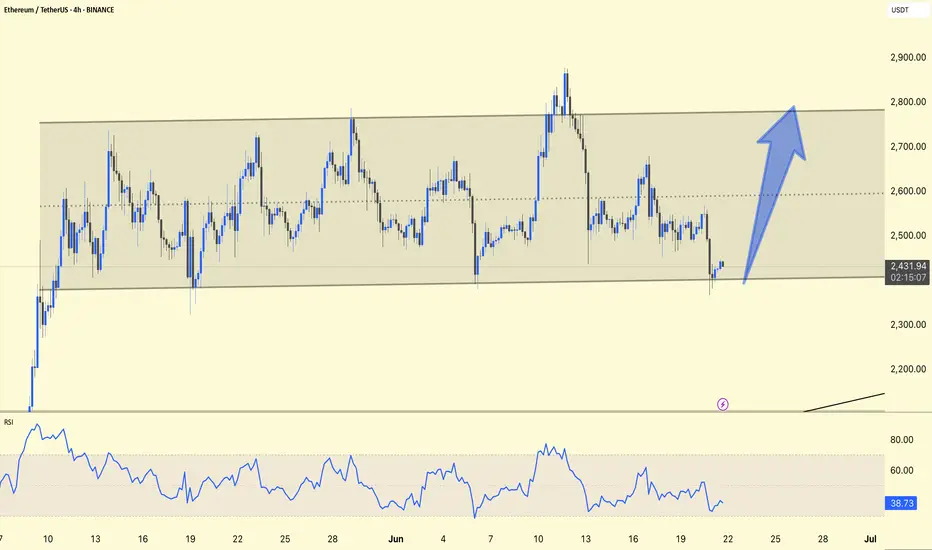
ETH/USDT 4H Technical Analysis UpdateChart Insights:
ETH is holding the lower trendline support (~$2,430), which indicates a potential reversal zone.
The RSI is hovering around 39, which indicates oversold territory, suggesting that buyers may step in soon.
Expected Move:
The chart predicts a strong move upwards towards the $2,800–2,900 zone (blue arrow), which aligns with the top range boundary.
Trade Plan:
Buy Zone: Near the lower trendline ($2,430–2,450)
Stop Loss: Just below the trendline ($2,400)
Target: Near the upper range boundary (~$2,800–2,900)
Stay alert!
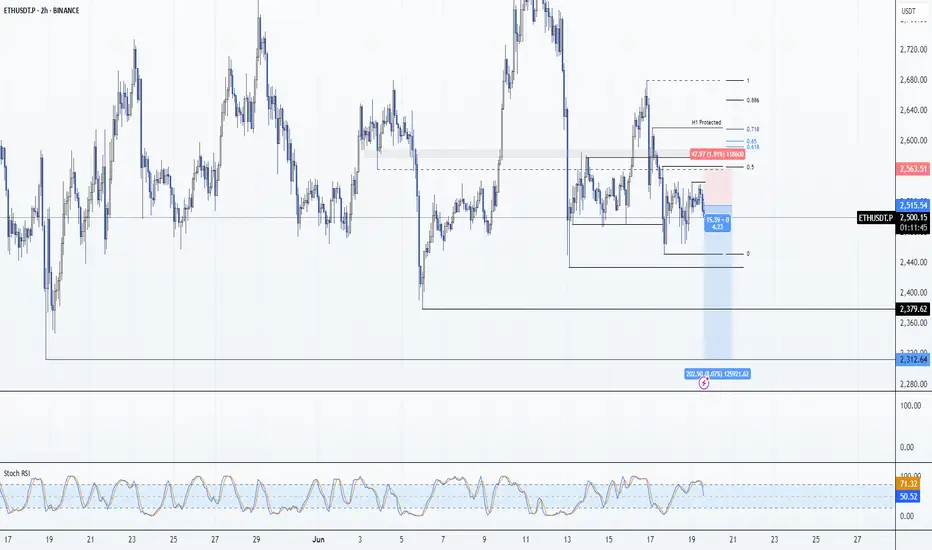
Update on ETHTP hit quicker than expected.
LTF intraday is currently short. Targetting the area where the HTF is more likely than not kicking in for the next leg towards the upside!
Not financial advice.
Onwards!
CRYPTO:ETHUSD
CRYPTO:BTCUSD

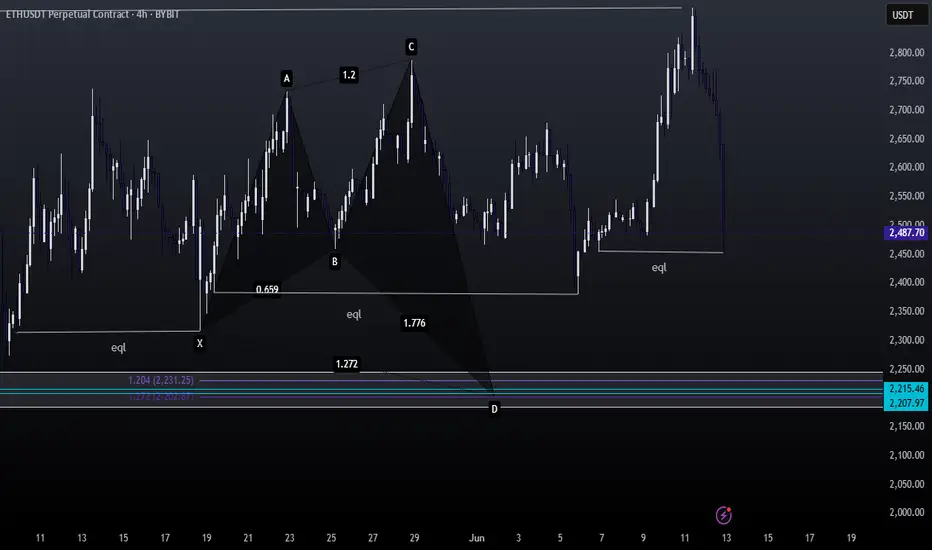
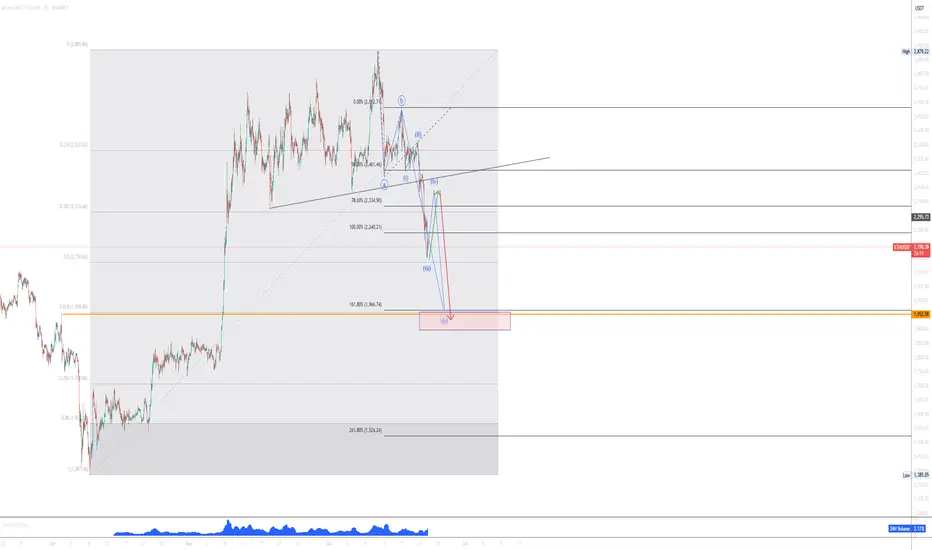
Pullback and DownHi there!
We have a nice pattern and very clear also. We should take care about BTC movement if we trade ETH or any other ALT coin!
Our main target is very clear ABC Fibonacci extension 161,8 and Fibonacci retracement 61,8 and HH of previous cycle! Sure, under this cluster level is a liquidity zone where you can make new cheap buys :-).
Good luck traders!
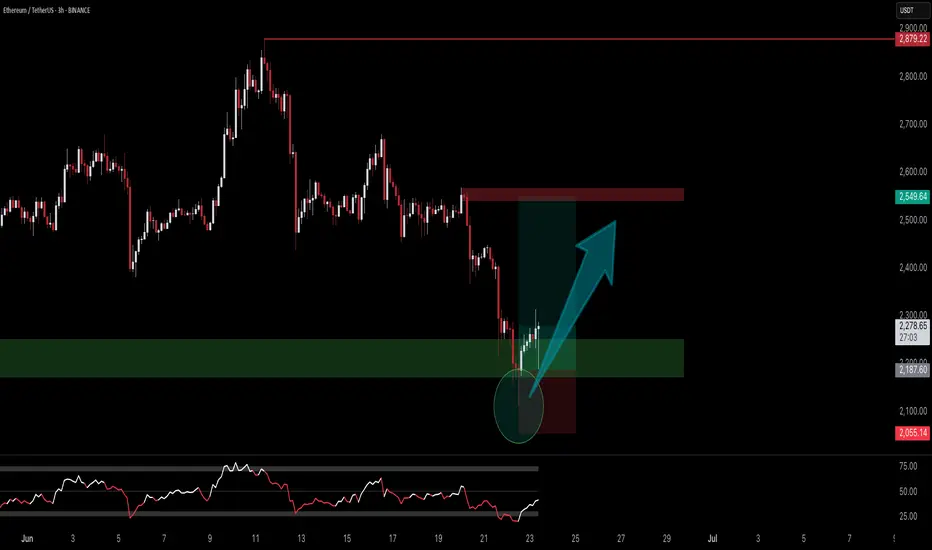
ETH NEXT BUYZONE.ETH has created a wick and below that is a huge liquidity cluster. I want price to fill that liquidity cluster and then upside.